please help me on the case! i will provide a thumbs up! it is urgent for me to complete the case!
1. when it comes to fitting distributions to 10-50-90 percentiles, you may discover that some distributions (e.g., triangular) may be unable to match the specified percentiles; cb will tell you this. this is not a limitation of cb, but a limitation of the particular family of distributions. you can always use custom distributions as described below.
2. here is a description of how to match 10-50-90s using the custom distribution tool. you use this method, you will need not just the 10-50-90s, but also a lower and upper bound to the
distribution. you may assume reasonable values for these bounds.
a. select the cell you want to define a distribution for and choose define assumption; choose custom distribution from the gallery of distributions presented.
b. choose continuous ranges from the parameters menu, so that on the bottom of the define assumption window you see minimum, maximum and probability as the inputs.
c. put the lower bound of the distribution in the minimum field on the dialog box. Put the 10th percentile into the Maximum field and put probability 0.10 in the probability field. hit enter. this will place a uniform distribution between the lower bound and the 10th percentile with total probability of 0.10.
d. when you hit enter above, the minimum, maximum and probability fields should clear. now put the 10th percentile into the field minimum and the 50th percentile into the maximum field and 0.40 into the probability field. hit enter.
e. now put the 50th percentile into the minimum field and the 90th percentile into the maximum field and 0.40 into the probability" field. hit enter.
f. now put the 90th percentile into the minimum field and the upper bound of the distribution into the maximum field and 0.10 into the probability" field. hit enter.
g. hit OK.
you can also link these values for the custom distribution to your worksheet, using load data." [you must hit show more" in the define assumption dialog box to see load data.]
3. on correlating cells: cb allows you to specify correlations between assumptions that are defined using cb dialog boxes. cb does not allow you to specify correlations between the distributions specified as formulas or calculated values in the spreadsheet. [cb doesn't know about these!] in the case, it says that price and broker fees are correlated with 1993 demand. if it simplifies your model, you may assume that this correlation is between 1993 base demand [that is, demand not including the catalog sales] rather than the total 1993 demand.
oil data
cash flow
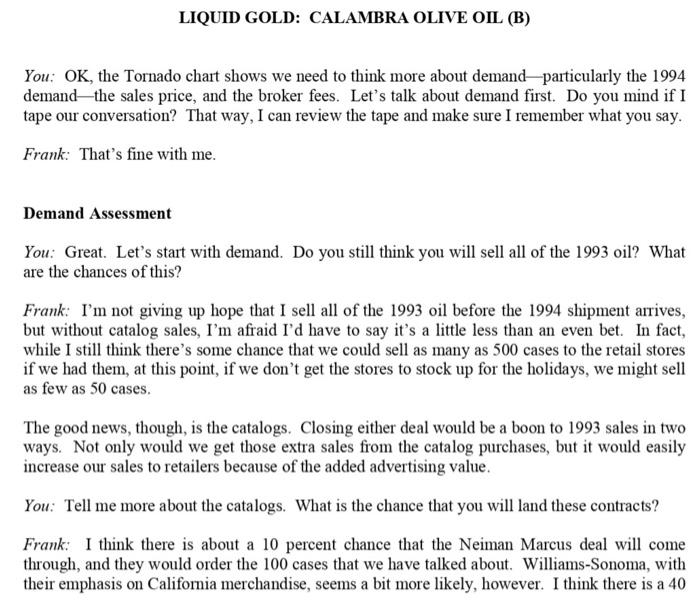
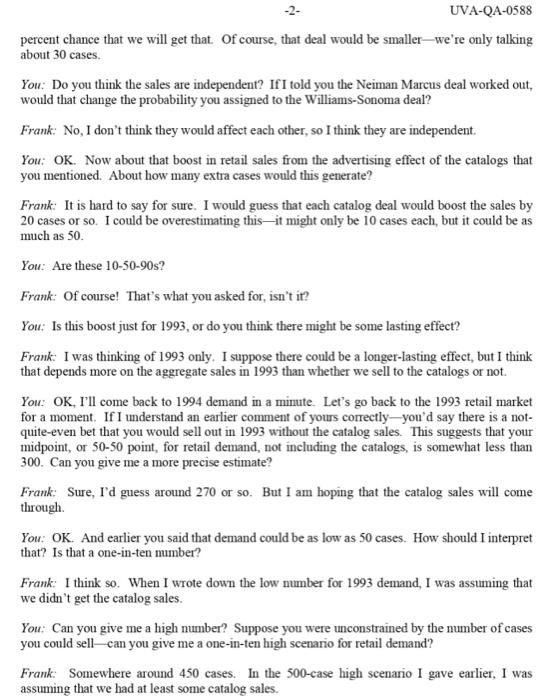
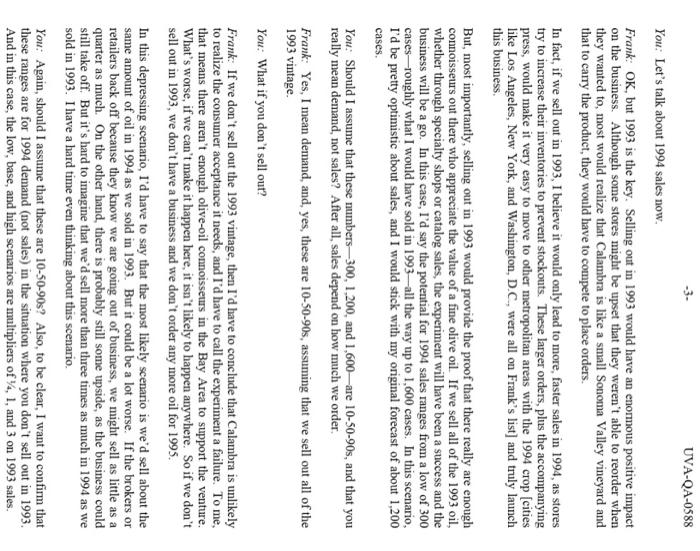
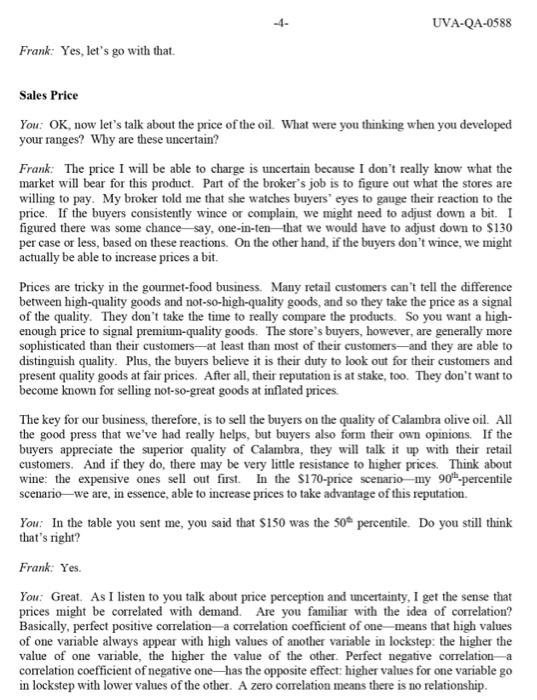
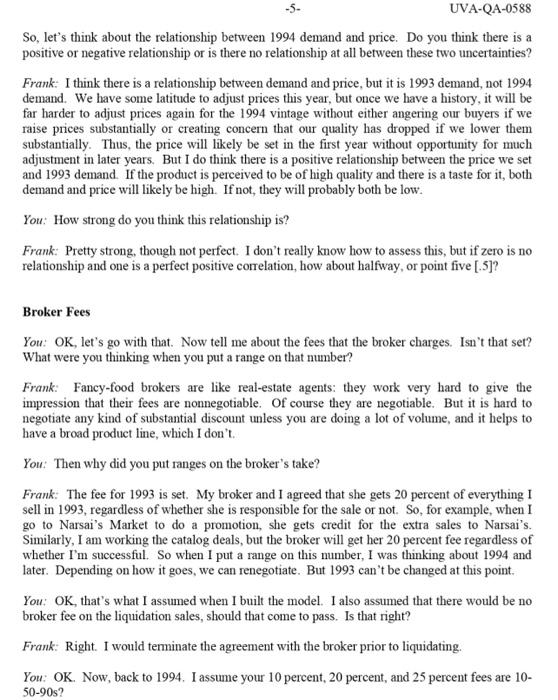
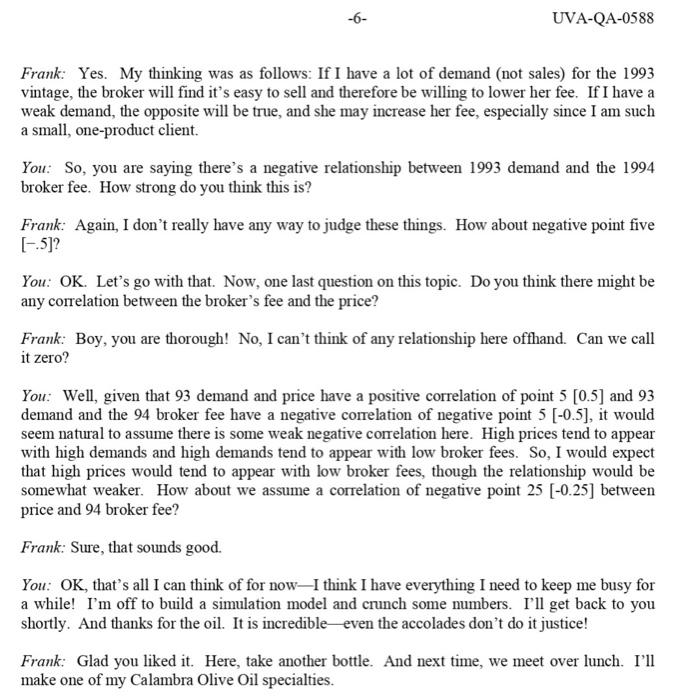
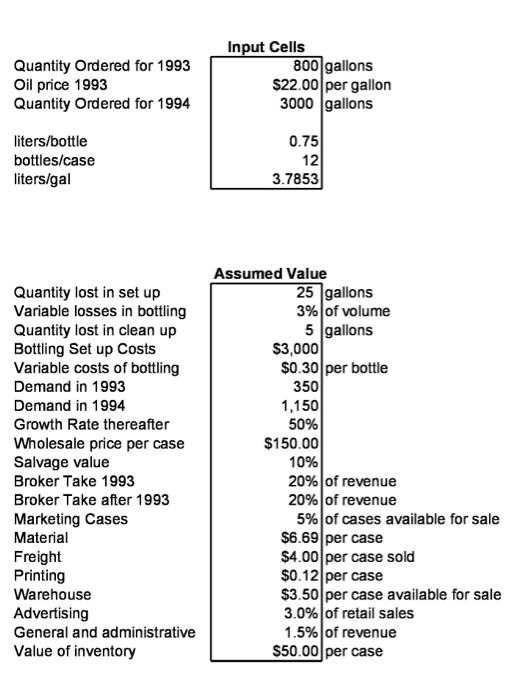
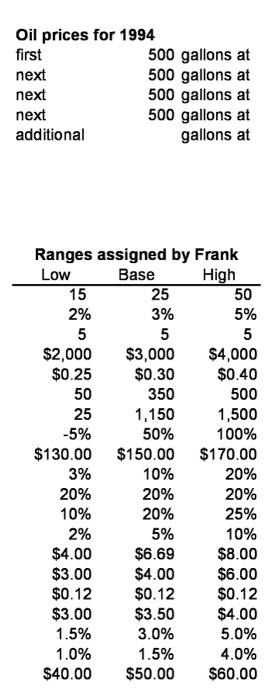
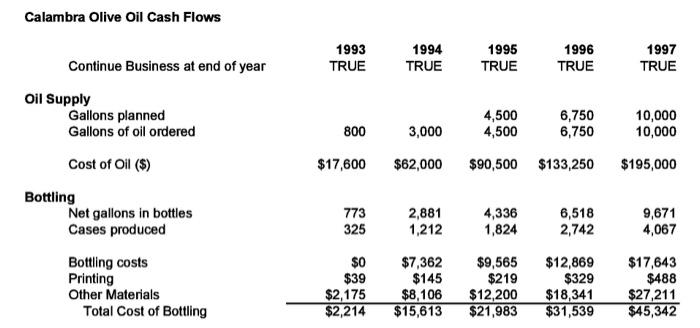
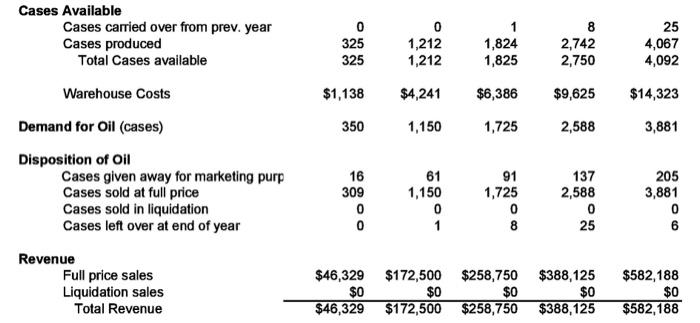
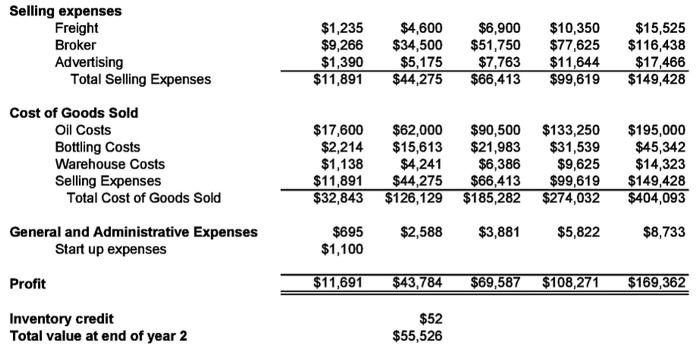
LIQUID GOLD: CALAMBRA OLIVE OIL (B) You: OK, the Tornado chart shows we need to think more about demand-particularly the 1994 demand - the sales price, and the broker fees. Let's talk about demand first. Do you mind if I tape our conversation? That way, I can review the tape and make sure I remember what you say. Frank: That's fine with me. Demand Assessment You: Great. Let's start with demand. Do you still think you will sell all of the 1993 oil? What are the chances of this? Frank: I'm not giving up hope that I sell all of the 1993 oil before the 1994 shipment arrives, but without catalog sales, I'm afraid I'd have to say it's a little less than an even bet. In fact, while I still think there's some chance that we could sell as many as 500 cases to the retail stores if we had them, at this point, if we don't get the stores to stock up for the holidays, we might sell as few as 50 cases. The good news, though, is the catalogs. Closing either deal would be a boon to 1993 sales in two ways. Not only would we get those extra sales from the catalog purchases, but it would easily increase our sales to retailers because of the added advertising value. You: Tell me more about the catalogs. What is the chance that you will land these contracts? Frank: I think there is about a 10 percent chance that the Neiman Marcus deal will come through, and they would order the 100 cases that we have talked about. Williams-Sonoma, with their emphasis on California merchandise, seems a bit more likely, however. I think there is a 40 2 UVA-QA-0588 percent chance that we will get that. Of course, that deal would be smaller-we're only talking about 30 cases. You: Do you think the sales are independent? If I told you the Neiman Marcus deal worked out, would that change the probability you assigned to the Williams-Sonoma deal? Frank: No, I don't think they would affect each other, so I think they are independent. You: OK. Now about that boost in retail sales from the advertising effect of the catalogs that you mentioned. About how many extra cases would this generate? Frank: It is hard to say for sure. I would guess that each catalog deal would boost the sales by 20 cases or so. I could be overestimating this-it might only be 10 cases each, but it could be as much as 50 . You: Are these 10-50-90s? Frank: Of course! That's what you asked for, isn't it? You: Is this boost just for 1993, or do you think there might be some lasting effect? Frank: I was thinking of 1993 only. I suppose there could be a longer-lasting effect, but I think that depends more on the aggregate sales in 1993 than whether we sell to the catalogs or not. You: OK, I'll come back to 1994 demand in a minute. Let's go back to the 1993 retail market for a moment. If I understand an earlier comment of yours correctly - you'd say there is a notquite-even bet that you would sell out in 1993 without the catalog sales. This suggests that your midpoint, or 50-50 point, for retail demand, not including the catalogs, is somewhat less than 300. Can you give me a more precise estimate? Frank: Sure, I'd guess around 270 or so. But I am hoping that the catalog sales will come through. You: OK. And earlier you said that demand could be as low as 50 cases. How should I interpret that? Is that a one-in-ten number? Frank: I think so. When I wrote down the low number for 1993 demand, I was assuming that we didn't get the catalog sales. You: Can you give me a high number? Suppose you were unconstrained by the number of cases you could sell - can you give me a one-in-ten high scenario for retail demand? Frank: Somewhere around 450 cases. In the 500-case high scenario I gave earlier, I was assuming that we had at least some catalog sales. -3- UVAQA0588 You: Let's talk about 1994 sales now. Frank: OK, but 1993 is the key. Selling out in 1993 would have an enormous positive impact on the business. Although some stores might be upset that they weren't able to reorder when they wanted to, most would realize that Calambra is like a small Sonoma Valley vineyard and that to carry the product, they would have to compete to place orders. In fact, if we sell out in 1993 , I believe it would only lead to more, faster sales in 1994, as stores try to increase their inventories to prevent stockouts. These larger orders, plus the accompanying press, would make it very easy to move to other metropolitan areas with the 1994 crop [cities like Los Angeles, New York, and Washington, D.C., were all on Frank's list] and truly launch this business. But, most importantly, selling out in 1993 would provide the proof that there really are enough connoisseurs out there who appreciate the value of a fine olive oil. If we sell all of the 1993 oil, whether through specialty shops or catalog sales, the experiment will have been a success and the business will be a go. In this case, I'd say the potential for 1994 sales ranges from a low of 300 cases-roughly what I would have sold in 1993 -all the way up to 1,600 cases. In this scenario, I'd be pretty optimistic about sales, and I would stick with my original forecast of about 1,200 cases. You: Should I assume that these numbers-300, 1,200, and 1,600-are 10-50-90s, and that you really mean demand, not sales? After all, sales depend on how much we order. Frank: Yes, I mean demand, and, yes, these are 10-50-90s, assuming that we sell out all of the 1993 vintage. You: What if you don't sell out? Frank: If we don't sell out the 1993 vintage, then I'd have to conclude that Calambra is unlikely to realize the consumer acceptance it needs, and I'd have to call the experiment a failure. To me, that means there aren't enough olive-oil connoisseurs in the Bay Area to support the venture. What's worse, if we can't make it happen here, it isn't likely to happen anywhere. So if we don't sell out in 1993, we don't have a business and we don't order any more oil for 1995. In this depressing scenario, I'd have to say that the most likely scenario is we'd sell about the same amount of oil in 1994 as we sold in 1993. But it could be a lot worse. If the brokers or retailers back off because they know we are going out of business, we might sell as little as a quarter as much. On the other hand, there is probably still some upside, as the business could still take off. But it's hard to imagine that we'd sell more than three times as much in 1994 as we sold in 1993. I have a hard time even thinking about this scenario. You: Again, should I assume that these are 10-50-90s? Also, to be clear, I want to confirm that these ranges are for 1994 demand (not sales) in the situation where you don't sell out in 1993. And in this case, the low, base, and high scenarios are multipliers of 1/4,1, and 3 on 1993 sales. Frank: Yes, let's go with that. Sales Price You: OK, now let's talk about the price of the oil. What were you thinking when you developed your ranges? Why are these uncertain? Frank: The price I will be able to charge is uncertain because I don't really know what the market will bear for this product. Part of the broker's job is to figure out what the stores are willing to pay. My broker told me that she watches buyers' eyes to gauge their reaction to the price. If the buyers consistently wince or complain, we might need to adjust down a bit. I figured there was some chance-say, one-in-ten-that we would have to adjust down to $130 per case or less, based on these reactions. On the other hand, if the buyers don't wince, we might actually be able to increase prices a bit. Prices are tricky in the goumet-food business. Many retail customers can't tell the difference between high-quality goods and not-so-high-quality goods, and so they take the price as a signal of the quality. They don't take the time to really compare the products. So you want a highenough price to signal premium-quality goods. The store's buyers, however, are generally more sophisticated than their customers-at least than most of their customers-and they are able to distinguish quality. Plus, the buyers believe it is their duty to look out for their customers and present quality goods at fair prices. After all, their reputation is at stake, too. They don't want to become known for selling not-so-great goods at inflated prices. The key for our business, therefore, is to sell the buyers on the quality of Calambra olive oil. All the good press that we've had really helps, but buyers also form their own opinions. If the buyers appreciate the superior quality of Calambra, they will talk it up with their retail customers. And if they do, there may be very little resistance to higher prices. Think about wine: the expensive ones sell out first. In the $170-price scenario-my 90th-percentile scenario-we are, in essence, able to increase prices to take advantage of this reputation. You: In the table you sent me, you said that $150 was the 50t percentile. Do you still think that's right? Frank: Yes. You: Great. As I listen to you talk about price perception and uncertainty, I get the sense that prices might be correlated with demand. Are you familiar with the idea of correlation? Basically, perfect positive correlation-a correlation coefficient of one-means that high values of one variable always appear with high values of another variable in lockstep: the higher the value of one variable, the higher the value of the other. Perfect negative correlation-a correlation coefficient of negative one-has the opposite effect: higher values for one variable go in lockstep with lower values of the other. A zero correlation means there is no relationship. -5- UVA-QA-0588 So, let's think about the relationship between 1994 demand and price. Do you think there is a positive or negative relationship or is there no relationship at all between these two uncertainties? Frank: I think there is a relationship between demand and price, but it is 1993 demand, not 1994 demand. We have some latitude to adjust prices this year, but once we have a history, it will be far harder to adjust prices again for the 1994 vintage without either angering our buyers if we raise prices substantially or creating concern that our quality has dropped if we lower them substantially. Thus, the price will likely be set in the first year without opportunity for much adjustment in later years. But I do think there is a positive relationship between the price we set and 1993 demand. If the product is perceived to be of high quality and there is a taste for it, both demand and price will likely be high. If not, they will probably both be low. You: How strong do you think this relationship is? Frank: Pretty strong, though not perfect. I don't really know how to assess this, but if zero is no relationship and one is a perfect positive correlation, how about halfway, or point five [.5]? Broker Fees You: OK, let's go with that. Now tell me about the fees that the broker charges. Isn't that set? What were you thinking when you put a range on that number? Frank: Fancy-food brokers are like real-estate agents: they work very hard to give the impression that their fees are nonnegotiable. Of course they are negotiable. But it is hard to negotiate any kind of substantial discount unless you are doing a lot of volume, and it helps to have a broad product line, which I don't. You: Then why did you put ranges on the broker's take? Frank: The fee for 1993 is set. My broker and I agreed that she gets 20 percent of everything I sell in 1993, regardless of whether she is responsible for the sale or not. So, for example, when I go to Narsai's Market to do a promotion, she gets credit for the extra sales to Narsai's. Similarly, I am working the catalog deals, but the broker will get her 20 percent fee regardless of whether I'm successful. So when I put a range on this number, I was thinking about 1994 and later. Depending on how it goes, we can renegotiate. But 1993 can't be changed at this point. You: OK, that's what I assumed when I built the model. I also assumed that there would be no broker fee on the liquidation sales, should that come to pass. Is that right? Frank: Right. I would teminate the agreement with the broker prior to liquidating. You: OK. Now, back to 1994. I assume your 10 percent, 20 percent, and 25 percent fees are 10 5090 s? -6- UVA-QA-0588 Frank: Yes. My thinking was as follows: If I have a lot of demand (not sales) for the 1993 vintage, the broker will find it's easy to sell and therefore be willing to lower her fee. If I have a weak demand, the opposite will be true, and she may increase her fee, especially since I am such a small, one-product client. You: So, you are saying there's a negative relationship between 1993 demand and the 1994 broker fee. How strong do you think this is? Frank: Again, I don't really have any way to judge these things. How about negative point five [.5]? You: OK. Let's go with that. Now, one last question on this topic. Do you think there might be any correlation between the broker's fee and the price? Frank: Boy, you are thorough! No, I can't think of any relationship here offhand. Can we call it zero? You: Well, given that 93 demand and price have a positive correlation of point 5[0.5] and 93 demand and the 94 broker fee have a negative correlation of negative point 5[0.5], it would seem natural to assume there is some weak negative correlation here. High prices tend to appear with high demands and high demands tend to appear with low broker fees. So, I would expect that high prices would tend to appear with low broker fees, though the relationship would be somewhat weaker. How about we assume a correlation of negative point 25[0.25] between price and 94 broker fee? Frank: Sure, that sounds good. You: OK, that's all I can think of for now-I think I have everything I need to keep me busy for a while! I'm off to build a simulation model and crunch some numbers. I'll get back to you shortly. And thanks for the oil. It is incredible - even the accolades don't do it justice! Frank: Glad you liked it. Here, take another bottle. And next time, we meet over lunch. I'll make one of my Calambra Olive Oil specialties. Oil Data Gallons to case conversion Potential Uncertainties Bottling Data Market Data Miscellaneous Costs \begin{tabular}{l|r|l|l} & Assumed Value \\ \cline { 2 - 4 } & 25 & gallons \\ Variable losses in bottling & 3% & of volume \\ Quantity lost in clean up & 5 & gallons \\ Bottling Set up Costs & $3,000 & \\ Variable costs of bottling & $0.30 & per bottle \\ Demand in 1993 & 350 & \\ Demand in 1994 & 1,150 & \\ Growth Rate thereafter & 50% & \\ Wholesale price per case & $150.00 & \\ Salvage value & 10% & \\ Broker Take 1993 & 20% & of revenue \\ Broker Take after 1993 & 20% & of revenue \\ Marketing Cases & 5% & of cases available for sale \\ Material & $6.69 & per case \\ Freight & $4.00 & per case sold \\ Printing & $0.12 & per case \\ Warehouse & $3.50 & per case available for sale \\ Advertising & 3.0% & of retail sales \\ General and administrative & 1.5% & of revenue \\ Value of inventory & $50.00 & per case \\ \hline \end{tabular} Oil prices for 1994 first 500 gallons at next 500 gallons at next 500 gallons at next 500 gallons at additional gallons at Calambra Olive Oil Cash Flows ContinueBusinessatendofyear1993TRUE1994TRUE1995TRUE1996TRUE1997TRUE Oil Supply GallonsplannedGallonsofoilordered8003,0004,5004,5006,7506,75010,00010,000 Cost of Oil (\$) $17,600$62,000$90,500$133,250$195,000 Bottling NetgallonsinbottlesCasesproduced7733252,8811,2124,3361,8246,5182,7429,6714,067 Bottling costs Printing Other Materials Total Cost of Bottling \begin{tabular}{rrrrr} $0 & $7,362 & $9,565 & $12,869 & $17,643 \\ $39 & $145 & $219 & $329 & $488 \\ $2,175 & $8,106 & $12,200 & $18,341 & $27,211 \\ \hline$2,214 & $15,613 & $21,983 & $31,539 & $45,342 \end{tabular} Cases Available Cases carried over from prev. year Cases produced Total Cases available Demand for Oil (cases) 0325325$1,13835001,2121,212$4,2411,15011,8241,825$6,3861,72582,7422,750$9,6252,588254,0674,092$14,3233,881 Disposition of Oil Cases given away for marketing purp Cases sold at full price Cases sold in liquidation Cases left over at end of year 1630900611,15001911,725081372,5880252053,88106 Revenue Full price sales Liquidation sales Total Revenue \begin{tabular}{rrrrr} $46,329 & $172,500 & $258,750 & $388,125 & $582,188 \\ $0 & $0 & $0 & $0 & $0 \\ \hline$46,329 & $172,500 & $258,750 & $388,125 & $582,188 \end{tabular} Selling expenses \begin{tabular}{lrrrrr} Freight & $1,235 & $4,600 & $6,900 & $10,350 & $15,525 \\ Broker & $9,266 & $34,500 & $51,750 & $77,625 & $116,438 \\ Advertising & $1,390 & $5,175 & $7,763 & $11,644 & $17,466 \\ \hline Total Selling Expenses & $11,891 & $44,275 & $66,413 & $99,619 & $149,428 \end{tabular} Cost of Goods Sold \begin{tabular}{lrrrrr} Oil Costs & $17,600 & $62,000 & $90,500 & $133,250 & $195,000 \\ Bottling Costs & $2,214 & $15,613 & $21,983 & $31,539 & $45,342 \\ Warehouse Costs & $1,138 & $4,241 & $6,386 & $9,625 & $14,323 \\ Selling Expenses & $11,891 & $44,275 & $66,413 & $99,619 & $149,428 \\ \hline Total Cost of Goods Sold & $32,843 & $126,129 & $185,282 & $274,032 & $404,093 \end{tabular} Profit \begin{tabular}{lllll} \hline$11,691 & $43,784 & $69,587 & $108,271 & $169,362 \\ \hline \hline \end{tabular} Inventory credit Total value at end of year 2 $52 $55,526 LIQUID GOLD: CALAMBRA OLIVE OIL (B) You: OK, the Tornado chart shows we need to think more about demand-particularly the 1994 demand - the sales price, and the broker fees. Let's talk about demand first. Do you mind if I tape our conversation? That way, I can review the tape and make sure I remember what you say. Frank: That's fine with me. Demand Assessment You: Great. Let's start with demand. Do you still think you will sell all of the 1993 oil? What are the chances of this? Frank: I'm not giving up hope that I sell all of the 1993 oil before the 1994 shipment arrives, but without catalog sales, I'm afraid I'd have to say it's a little less than an even bet. In fact, while I still think there's some chance that we could sell as many as 500 cases to the retail stores if we had them, at this point, if we don't get the stores to stock up for the holidays, we might sell as few as 50 cases. The good news, though, is the catalogs. Closing either deal would be a boon to 1993 sales in two ways. Not only would we get those extra sales from the catalog purchases, but it would easily increase our sales to retailers because of the added advertising value. You: Tell me more about the catalogs. What is the chance that you will land these contracts? Frank: I think there is about a 10 percent chance that the Neiman Marcus deal will come through, and they would order the 100 cases that we have talked about. Williams-Sonoma, with their emphasis on California merchandise, seems a bit more likely, however. I think there is a 40 2 UVA-QA-0588 percent chance that we will get that. Of course, that deal would be smaller-we're only talking about 30 cases. You: Do you think the sales are independent? If I told you the Neiman Marcus deal worked out, would that change the probability you assigned to the Williams-Sonoma deal? Frank: No, I don't think they would affect each other, so I think they are independent. You: OK. Now about that boost in retail sales from the advertising effect of the catalogs that you mentioned. About how many extra cases would this generate? Frank: It is hard to say for sure. I would guess that each catalog deal would boost the sales by 20 cases or so. I could be overestimating this-it might only be 10 cases each, but it could be as much as 50 . You: Are these 10-50-90s? Frank: Of course! That's what you asked for, isn't it? You: Is this boost just for 1993, or do you think there might be some lasting effect? Frank: I was thinking of 1993 only. I suppose there could be a longer-lasting effect, but I think that depends more on the aggregate sales in 1993 than whether we sell to the catalogs or not. You: OK, I'll come back to 1994 demand in a minute. Let's go back to the 1993 retail market for a moment. If I understand an earlier comment of yours correctly - you'd say there is a notquite-even bet that you would sell out in 1993 without the catalog sales. This suggests that your midpoint, or 50-50 point, for retail demand, not including the catalogs, is somewhat less than 300. Can you give me a more precise estimate? Frank: Sure, I'd guess around 270 or so. But I am hoping that the catalog sales will come through. You: OK. And earlier you said that demand could be as low as 50 cases. How should I interpret that? Is that a one-in-ten number? Frank: I think so. When I wrote down the low number for 1993 demand, I was assuming that we didn't get the catalog sales. You: Can you give me a high number? Suppose you were unconstrained by the number of cases you could sell - can you give me a one-in-ten high scenario for retail demand? Frank: Somewhere around 450 cases. In the 500-case high scenario I gave earlier, I was assuming that we had at least some catalog sales. -3- UVAQA0588 You: Let's talk about 1994 sales now. Frank: OK, but 1993 is the key. Selling out in 1993 would have an enormous positive impact on the business. Although some stores might be upset that they weren't able to reorder when they wanted to, most would realize that Calambra is like a small Sonoma Valley vineyard and that to carry the product, they would have to compete to place orders. In fact, if we sell out in 1993 , I believe it would only lead to more, faster sales in 1994, as stores try to increase their inventories to prevent stockouts. These larger orders, plus the accompanying press, would make it very easy to move to other metropolitan areas with the 1994 crop [cities like Los Angeles, New York, and Washington, D.C., were all on Frank's list] and truly launch this business. But, most importantly, selling out in 1993 would provide the proof that there really are enough connoisseurs out there who appreciate the value of a fine olive oil. If we sell all of the 1993 oil, whether through specialty shops or catalog sales, the experiment will have been a success and the business will be a go. In this case, I'd say the potential for 1994 sales ranges from a low of 300 cases-roughly what I would have sold in 1993 -all the way up to 1,600 cases. In this scenario, I'd be pretty optimistic about sales, and I would stick with my original forecast of about 1,200 cases. You: Should I assume that these numbers-300, 1,200, and 1,600-are 10-50-90s, and that you really mean demand, not sales? After all, sales depend on how much we order. Frank: Yes, I mean demand, and, yes, these are 10-50-90s, assuming that we sell out all of the 1993 vintage. You: What if you don't sell out? Frank: If we don't sell out the 1993 vintage, then I'd have to conclude that Calambra is unlikely to realize the consumer acceptance it needs, and I'd have to call the experiment a failure. To me, that means there aren't enough olive-oil connoisseurs in the Bay Area to support the venture. What's worse, if we can't make it happen here, it isn't likely to happen anywhere. So if we don't sell out in 1993, we don't have a business and we don't order any more oil for 1995. In this depressing scenario, I'd have to say that the most likely scenario is we'd sell about the same amount of oil in 1994 as we sold in 1993. But it could be a lot worse. If the brokers or retailers back off because they know we are going out of business, we might sell as little as a quarter as much. On the other hand, there is probably still some upside, as the business could still take off. But it's hard to imagine that we'd sell more than three times as much in 1994 as we sold in 1993. I have a hard time even thinking about this scenario. You: Again, should I assume that these are 10-50-90s? Also, to be clear, I want to confirm that these ranges are for 1994 demand (not sales) in the situation where you don't sell out in 1993. And in this case, the low, base, and high scenarios are multipliers of 1/4,1, and 3 on 1993 sales. Frank: Yes, let's go with that. Sales Price You: OK, now let's talk about the price of the oil. What were you thinking when you developed your ranges? Why are these uncertain? Frank: The price I will be able to charge is uncertain because I don't really know what the market will bear for this product. Part of the broker's job is to figure out what the stores are willing to pay. My broker told me that she watches buyers' eyes to gauge their reaction to the price. If the buyers consistently wince or complain, we might need to adjust down a bit. I figured there was some chance-say, one-in-ten-that we would have to adjust down to $130 per case or less, based on these reactions. On the other hand, if the buyers don't wince, we might actually be able to increase prices a bit. Prices are tricky in the goumet-food business. Many retail customers can't tell the difference between high-quality goods and not-so-high-quality goods, and so they take the price as a signal of the quality. They don't take the time to really compare the products. So you want a highenough price to signal premium-quality goods. The store's buyers, however, are generally more sophisticated than their customers-at least than most of their customers-and they are able to distinguish quality. Plus, the buyers believe it is their duty to look out for their customers and present quality goods at fair prices. After all, their reputation is at stake, too. They don't want to become known for selling not-so-great goods at inflated prices. The key for our business, therefore, is to sell the buyers on the quality of Calambra olive oil. All the good press that we've had really helps, but buyers also form their own opinions. If the buyers appreciate the superior quality of Calambra, they will talk it up with their retail customers. And if they do, there may be very little resistance to higher prices. Think about wine: the expensive ones sell out first. In the $170-price scenario-my 90th-percentile scenario-we are, in essence, able to increase prices to take advantage of this reputation. You: In the table you sent me, you said that $150 was the 50t percentile. Do you still think that's right? Frank: Yes. You: Great. As I listen to you talk about price perception and uncertainty, I get the sense that prices might be correlated with demand. Are you familiar with the idea of correlation? Basically, perfect positive correlation-a correlation coefficient of one-means that high values of one variable always appear with high values of another variable in lockstep: the higher the value of one variable, the higher the value of the other. Perfect negative correlation-a correlation coefficient of negative one-has the opposite effect: higher values for one variable go in lockstep with lower values of the other. A zero correlation means there is no relationship. -5- UVA-QA-0588 So, let's think about the relationship between 1994 demand and price. Do you think there is a positive or negative relationship or is there no relationship at all between these two uncertainties? Frank: I think there is a relationship between demand and price, but it is 1993 demand, not 1994 demand. We have some latitude to adjust prices this year, but once we have a history, it will be far harder to adjust prices again for the 1994 vintage without either angering our buyers if we raise prices substantially or creating concern that our quality has dropped if we lower them substantially. Thus, the price will likely be set in the first year without opportunity for much adjustment in later years. But I do think there is a positive relationship between the price we set and 1993 demand. If the product is perceived to be of high quality and there is a taste for it, both demand and price will likely be high. If not, they will probably both be low. You: How strong do you think this relationship is? Frank: Pretty strong, though not perfect. I don't really know how to assess this, but if zero is no relationship and one is a perfect positive correlation, how about halfway, or point five [.5]? Broker Fees You: OK, let's go with that. Now tell me about the fees that the broker charges. Isn't that set? What were you thinking when you put a range on that number? Frank: Fancy-food brokers are like real-estate agents: they work very hard to give the impression that their fees are nonnegotiable. Of course they are negotiable. But it is hard to negotiate any kind of substantial discount unless you are doing a lot of volume, and it helps to have a broad product line, which I don't. You: Then why did you put ranges on the broker's take? Frank: The fee for 1993 is set. My broker and I agreed that she gets 20 percent of everything I sell in 1993, regardless of whether she is responsible for the sale or not. So, for example, when I go to Narsai's Market to do a promotion, she gets credit for the extra sales to Narsai's. Similarly, I am working the catalog deals, but the broker will get her 20 percent fee regardless of whether I'm successful. So when I put a range on this number, I was thinking about 1994 and later. Depending on how it goes, we can renegotiate. But 1993 can't be changed at this point. You: OK, that's what I assumed when I built the model. I also assumed that there would be no broker fee on the liquidation sales, should that come to pass. Is that right? Frank: Right. I would teminate the agreement with the broker prior to liquidating. You: OK. Now, back to 1994. I assume your 10 percent, 20 percent, and 25 percent fees are 10 5090 s? -6- UVA-QA-0588 Frank: Yes. My thinking was as follows: If I have a lot of demand (not sales) for the 1993 vintage, the broker will find it's easy to sell and therefore be willing to lower her fee. If I have a weak demand, the opposite will be true, and she may increase her fee, especially since I am such a small, one-product client. You: So, you are saying there's a negative relationship between 1993 demand and the 1994 broker fee. How strong do you think this is? Frank: Again, I don't really have any way to judge these things. How about negative point five [.5]? You: OK. Let's go with that. Now, one last question on this topic. Do you think there might be any correlation between the broker's fee and the price? Frank: Boy, you are thorough! No, I can't think of any relationship here offhand. Can we call it zero? You: Well, given that 93 demand and price have a positive correlation of point 5[0.5] and 93 demand and the 94 broker fee have a negative correlation of negative point 5[0.5], it would seem natural to assume there is some weak negative correlation here. High prices tend to appear with high demands and high demands tend to appear with low broker fees. So, I would expect that high prices would tend to appear with low broker fees, though the relationship would be somewhat weaker. How about we assume a correlation of negative point 25[0.25] between price and 94 broker fee? Frank: Sure, that sounds good. You: OK, that's all I can think of for now-I think I have everything I need to keep me busy for a while! I'm off to build a simulation model and crunch some numbers. I'll get back to you shortly. And thanks for the oil. It is incredible - even the accolades don't do it justice! Frank: Glad you liked it. Here, take another bottle. And next time, we meet over lunch. I'll make one of my Calambra Olive Oil specialties. Oil Data Gallons to case conversion Potential Uncertainties Bottling Data Market Data Miscellaneous Costs \begin{tabular}{l|r|l|l} & Assumed Value \\ \cline { 2 - 4 } & 25 & gallons \\ Variable losses in bottling & 3% & of volume \\ Quantity lost in clean up & 5 & gallons \\ Bottling Set up Costs & $3,000 & \\ Variable costs of bottling & $0.30 & per bottle \\ Demand in 1993 & 350 & \\ Demand in 1994 & 1,150 & \\ Growth Rate thereafter & 50% & \\ Wholesale price per case & $150.00 & \\ Salvage value & 10% & \\ Broker Take 1993 & 20% & of revenue \\ Broker Take after 1993 & 20% & of revenue \\ Marketing Cases & 5% & of cases available for sale \\ Material & $6.69 & per case \\ Freight & $4.00 & per case sold \\ Printing & $0.12 & per case \\ Warehouse & $3.50 & per case available for sale \\ Advertising & 3.0% & of retail sales \\ General and administrative & 1.5% & of revenue \\ Value of inventory & $50.00 & per case \\ \hline \end{tabular} Oil prices for 1994 first 500 gallons at next 500 gallons at next 500 gallons at next 500 gallons at additional gallons at Calambra Olive Oil Cash Flows ContinueBusinessatendofyear1993TRUE1994TRUE1995TRUE1996TRUE1997TRUE Oil Supply GallonsplannedGallonsofoilordered8003,0004,5004,5006,7506,75010,00010,000 Cost of Oil (\$) $17,600$62,000$90,500$133,250$195,000 Bottling NetgallonsinbottlesCasesproduced7733252,8811,2124,3361,8246,5182,7429,6714,067 Bottling costs Printing Other Materials Total Cost of Bottling \begin{tabular}{rrrrr} $0 & $7,362 & $9,565 & $12,869 & $17,643 \\ $39 & $145 & $219 & $329 & $488 \\ $2,175 & $8,106 & $12,200 & $18,341 & $27,211 \\ \hline$2,214 & $15,613 & $21,983 & $31,539 & $45,342 \end{tabular} Cases Available Cases carried over from prev. year Cases produced Total Cases available Demand for Oil (cases) 0325325$1,13835001,2121,212$4,2411,15011,8241,825$6,3861,72582,7422,750$9,6252,588254,0674,092$14,3233,881 Disposition of Oil Cases given away for marketing purp Cases sold at full price Cases sold in liquidation Cases left over at end of year 1630900611,15001911,725081372,5880252053,88106 Revenue Full price sales Liquidation sales Total Revenue \begin{tabular}{rrrrr} $46,329 & $172,500 & $258,750 & $388,125 & $582,188 \\ $0 & $0 & $0 & $0 & $0 \\ \hline$46,329 & $172,500 & $258,750 & $388,125 & $582,188 \end{tabular} Selling expenses \begin{tabular}{lrrrrr} Freight & $1,235 & $4,600 & $6,900 & $10,350 & $15,525 \\ Broker & $9,266 & $34,500 & $51,750 & $77,625 & $116,438 \\ Advertising & $1,390 & $5,175 & $7,763 & $11,644 & $17,466 \\ \hline Total Selling Expenses & $11,891 & $44,275 & $66,413 & $99,619 & $149,428 \end{tabular} Cost of Goods Sold \begin{tabular}{lrrrrr} Oil Costs & $17,600 & $62,000 & $90,500 & $133,250 & $195,000 \\ Bottling Costs & $2,214 & $15,613 & $21,983 & $31,539 & $45,342 \\ Warehouse Costs & $1,138 & $4,241 & $6,386 & $9,625 & $14,323 \\ Selling Expenses & $11,891 & $44,275 & $66,413 & $99,619 & $149,428 \\ \hline Total Cost of Goods Sold & $32,843 & $126,129 & $185,282 & $274,032 & $404,093 \end{tabular} Profit \begin{tabular}{lllll} \hline$11,691 & $43,784 & $69,587 & $108,271 & $169,362 \\ \hline \hline \end{tabular} Inventory credit Total value at end of year 2 $52 $55,526
