

Answered step by step
Verified Expert Solution
Question
1 Approved Answer
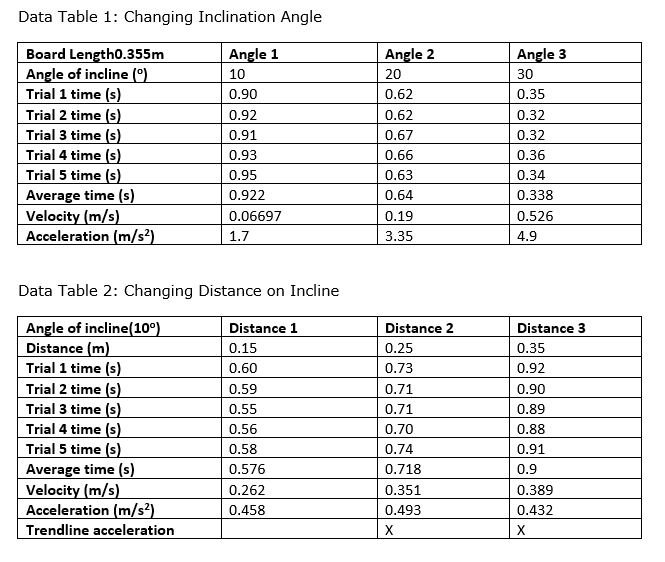
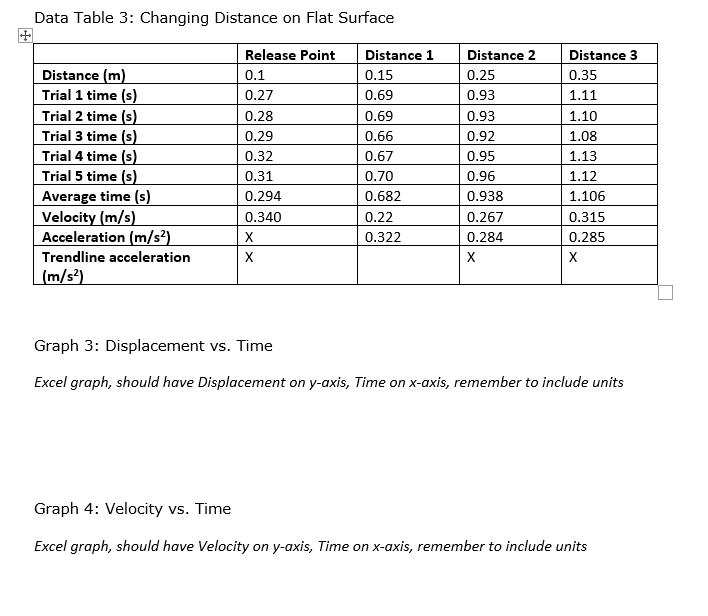
Please help me out! My excel isn't working, please help me make the graphs in excel! Thank you so much for your time! Data Table
Please help me out! My excel isn't working, please help me make the graphs in excel! Thank you so much for your time!
Step by Step Solution
There are 3 Steps involved in it
Step: 1

Get Instant Access to Expert-Tailored Solutions
See step-by-step solutions with expert insights and AI powered tools for academic success
Step: 2

Step: 3
Ace Your Homework with AI
Get the answers you need in no time with our AI-driven, step-by-step assistance
Get Started
Introduction to Electrodynamics
Authors: David J. Griffiths
3rd Edition
978-0138053260, 013805326X, 8120316010, 978-8120316010