please help me out with the following:
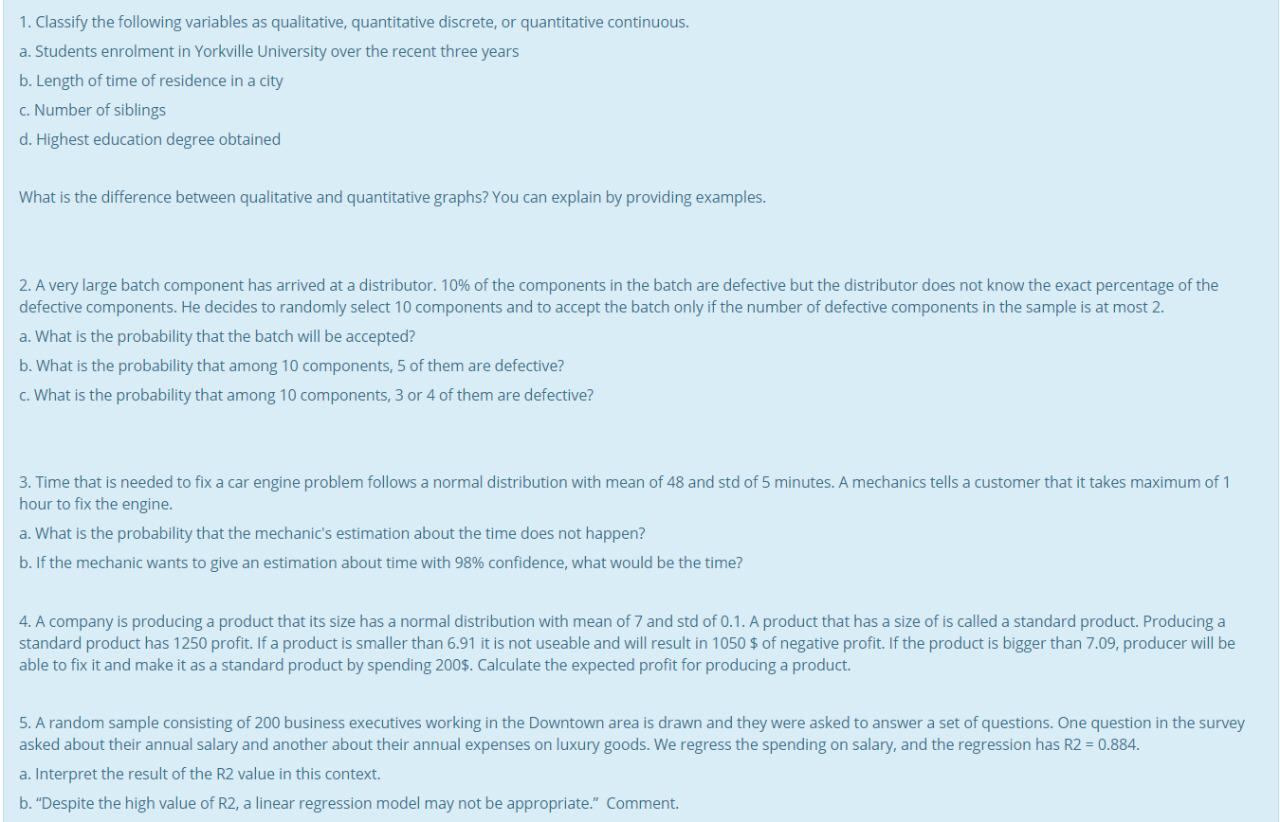
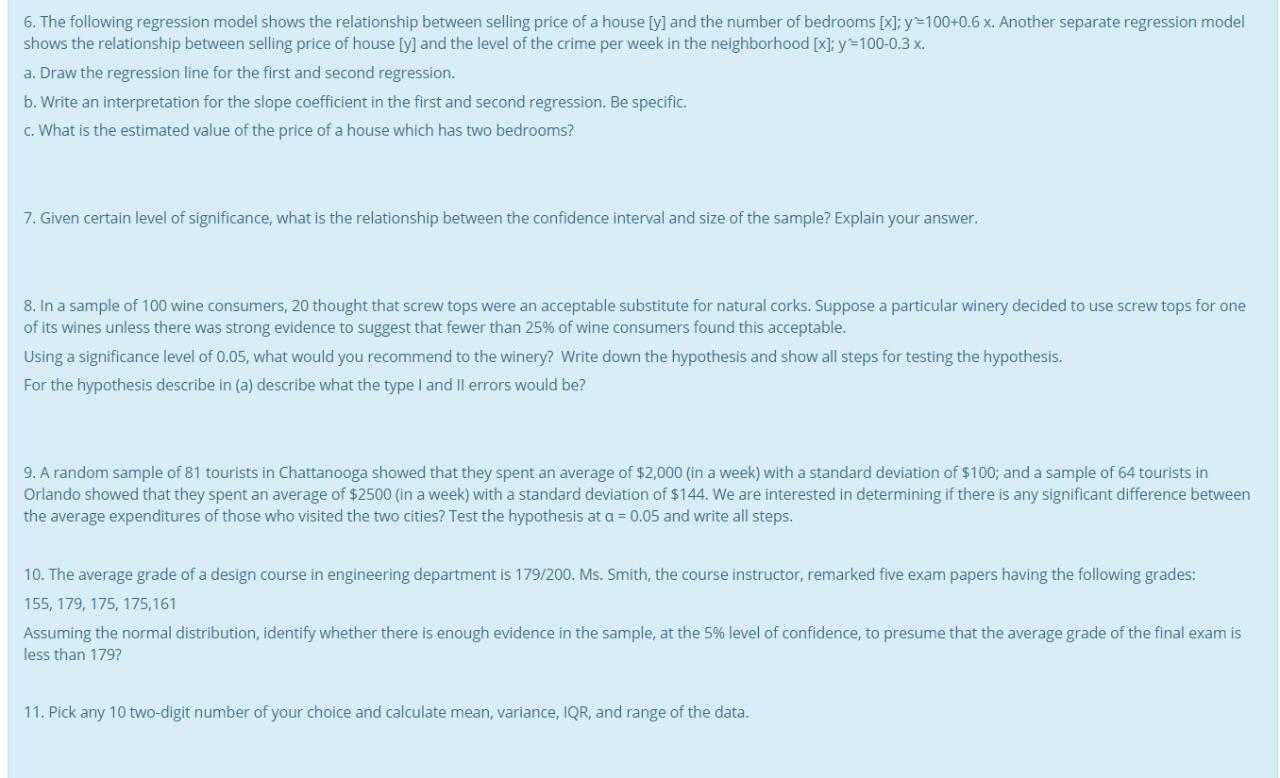
1. Classify the following variables as qualitative, quantitative discrete, or quantitative continuous. a. Students enrolment in Yorkville University over the recent three years b. Length of time of residence in a city c. Number of siblings d. Highest education degree obtained What is the difference between qualitative and quantitative graphs? You can explain by providing examples. 2. A very large batch component has arrived at a distributor. 10% of the components in the batch are defective but the distributor does not know the exact percentage of the defective components. He decides to randomly select 10 components and to accept the batch only if the number of defective components in the sample is at most 2. a. What is the probability that the batch will be accepted? b. What is the probability that among 10 components, 5 of them are defective? c. What is the probability that among 10 components, 3 or 4 of them are defective? 3. Time that is needed to fix a car engine problem follows a normal distribution with mean of 48 and std of 5 minutes. A mechanics tells a customer that it takes maximum of 1 hour to fix the engine. a. What is the probability that the mechanic's estimation about the time does not happen? b. If the mechanic wants to give an estimation about time with 98% confidence, what would be the time? 4. A company is producing a product that its size has a normal distribution with mean of 7 and std of 0.1. A product that has a size of is called a standard product. Producing a standard product has 1250 profit. If a product is smaller than 6.91 it is not useable and will result in 1050 $ of negative profit. If the product is bigger than 7.09, producer will be able to fix it and make it as a standard product by spending 200$. Calculate the expected profit for producing a product. 5. A random sample consisting of 200 business executives working in the Downtown area is drawn and they were asked to answer a set of questions. One question in the survey asked about their annual salary and another about their annual expenses on luxury goods. We regress the spending on salary, and the regression has R2 = 0.884. a. Interpret the result of the R2 value in this context. b. "Despite the high value of R2, a linear regression model may not be appropriate." Comment.6. The following regression model shows the relationship between selling price of a house [y] and the number of bedrooms [x]; y-100+0.6 x. Another separate regression model shows the relationship between selling price of house [y] and the level of the crime per week in the neighborhood [x]; y =100-0.3 x. a. Draw the regression line for the first and second regression. b. Write an interpretation for the slope coefficient in the first and second regression. Be specific. c. What is the estimated value of the price of a house which has two bedrooms? 7. Given certain level of significance, what is the relationship between the confidence interval and size of the sample? Explain your answer. 8. In a sample of 100 wine consumers, 20 thought that screw tops were an acceptable substitute for natural corks. Suppose a particular winery decided to use screw tops for one of its wines unless there was strong evidence to suggest that fewer than 25% of wine consumers found this acceptable. Using a significance level of 0.05, what would you recommend to the winery? Write down the hypothesis and show all steps for testing the hypothesis. For the hypothesis describe in (a) describe what the type I and II errors would be? 9. A random sample of 81 tourists in Chattanooga showed that they spent an average of $2,000 (in a week) with a standard deviation of $100; and a sample of 64 tourists in Orlando showed that they spent an average of $2500 (in a week) with a standard deviation of $144. We are interested in determining if there is any significant difference between the average expenditures of those who visited the two cities? Test the hypothesis at a = 0.05 and write all steps. 10. The average grade of a design course in engineering department is 179/200. Ms. Smith, the course instructor, remarked five exam papers having the following grades: 155, 179, 175, 175,161 Assuming the normal distribution, identify whether there is enough evidence in the sample, at the 5% level of confidence, to presume that the average grade of the final exam is less than 179? 11. Pick any 10 two-digit number of your choice and calculate mean, variance, IQR, and range of the data