

Question
please help me solve this n the following graph, use the orange points (square symbol) to plot points along the portion of the industrys short-run
please help me solve this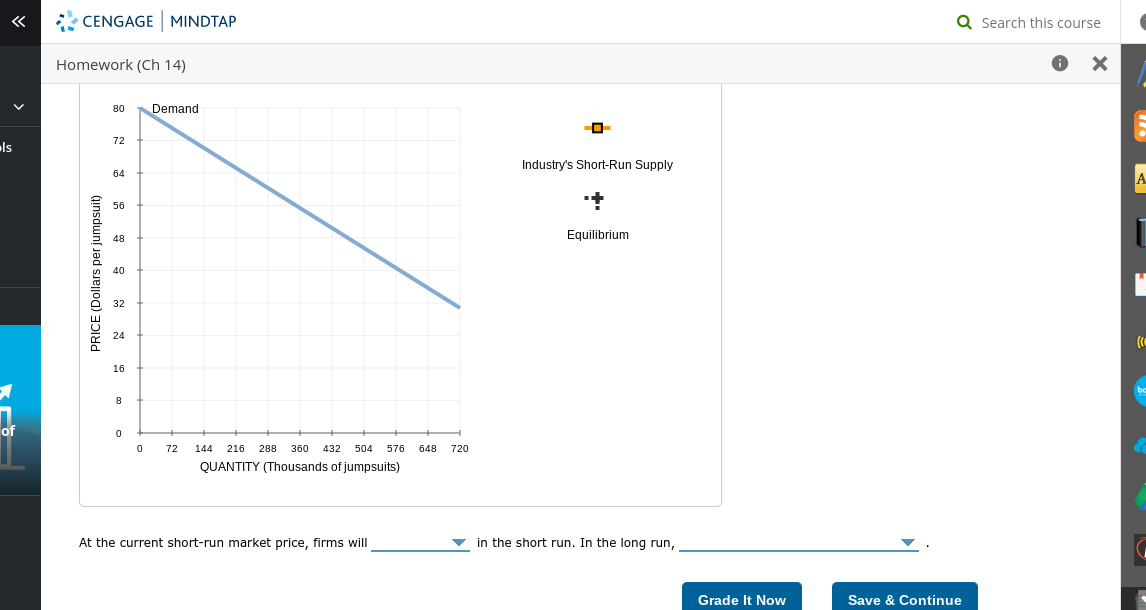
n the following graph, use the orange points (square symbol) to plot points along the portion of the industrys short-run supply curve that corresponds to prices where there is positive output. (Note: For the graphing tool to grade correctly, you must plot these points in order from left to right, starting with the point closest to the origin. You are given more points to plot than you need.) Next, place the black point (plus symbol) on the graph to indicate the short-run equilibrium price and quantity in this market.
Note: Dashed drop lines will automatically extend to both axes.
please help me solve this
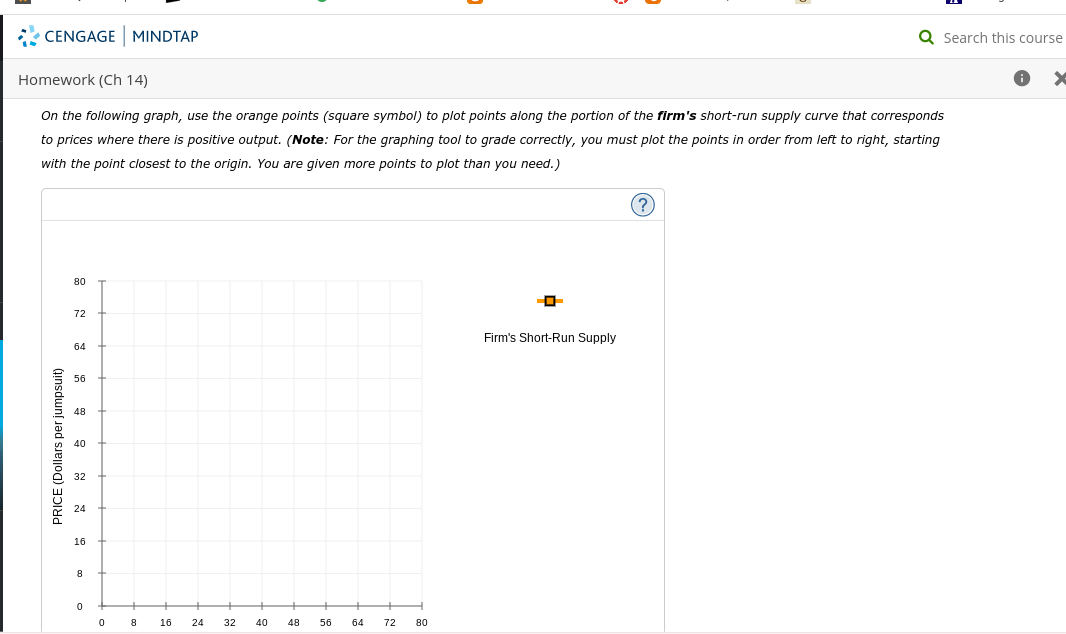
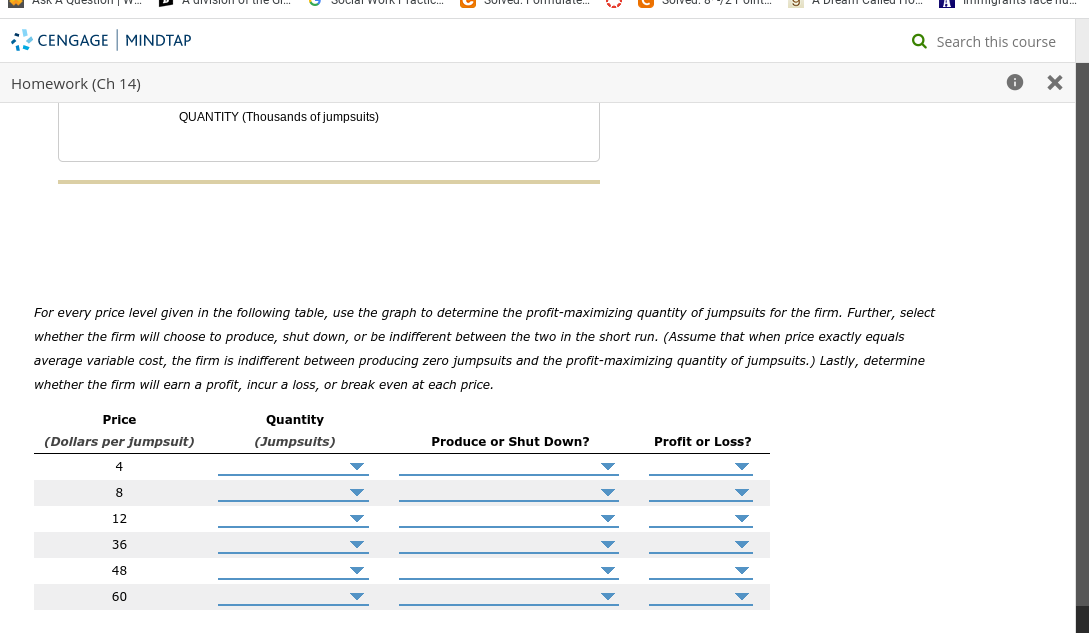
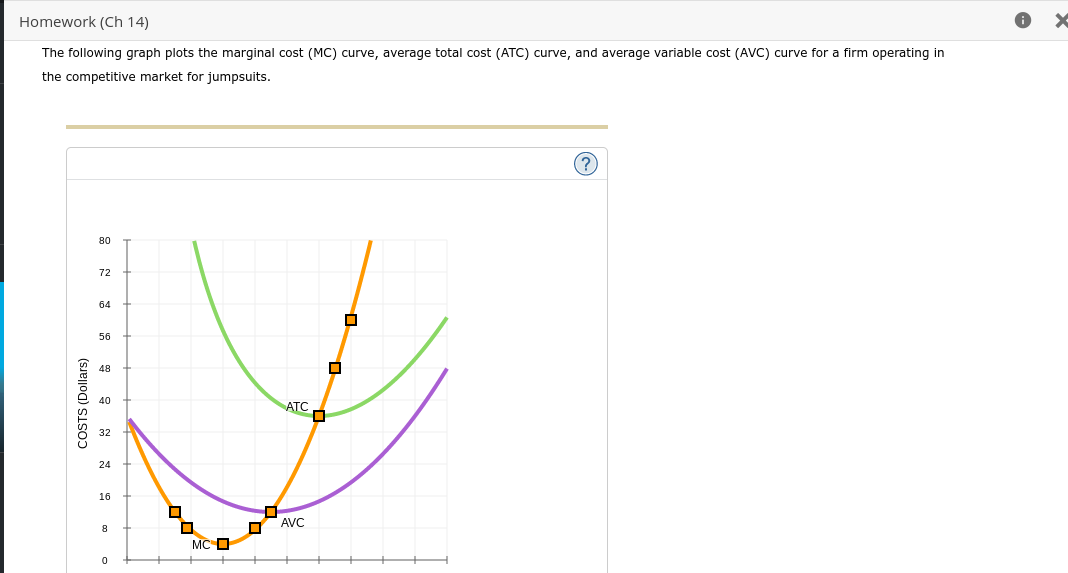
At the current short-run market price, firms will in the short run. In the long run, On the following graph, use the orange points (square symbol) to plot points along the portion of the firm's short-run supply curve that corresponds to prices where there is positive output. (Note: For the graphing tool to grade correctly, you must plot the points in order from left to right, starting with the point closest to the origin. You are given more points to plot than you need.) For every price level given in the following table, use the graph to determine the profit-maximizing quantity of jumpsuits for the firm. Further, select whether the firm will choose to produce, shut down, or be indifferent between the two in the short run. (Assume that when price exactly equals average variable cost, the firm is indifferent between producing zero jumpsuits and the profit-maximizing quantity of jumpsuits.) Lastly, determine whether the firm will earn a profit, incur a loss, or break even at each price. The following graph plots the marginal cost (MC) curve, average total cost (ATC) curve, and average variable cost (AVC) curve for a firm operating in the competitive market for jumpsuits. At the current short-run market price, firms will in the short run. In the long run, On the following graph, use the orange points (square symbol) to plot points along the portion of the firm's short-run supply curve that corresponds to prices where there is positive output. (Note: For the graphing tool to grade correctly, you must plot the points in order from left to right, starting with the point closest to the origin. You are given more points to plot than you need.) For every price level given in the following table, use the graph to determine the profit-maximizing quantity of jumpsuits for the firm. Further, select whether the firm will choose to produce, shut down, or be indifferent between the two in the short run. (Assume that when price exactly equals average variable cost, the firm is indifferent between producing zero jumpsuits and the profit-maximizing quantity of jumpsuits.) Lastly, determine whether the firm will earn a profit, incur a loss, or break even at each price. The following graph plots the marginal cost (MC) curve, average total cost (ATC) curve, and average variable cost (AVC) curve for a firm operating in the competitive market for jumpsuitsStep by Step Solution
There are 3 Steps involved in it
Step: 1

Get Instant Access to Expert-Tailored Solutions
See step-by-step solutions with expert insights and AI powered tools for academic success
Step: 2

Step: 3
Ace Your Homework with AI
Get the answers you need in no time with our AI-driven, step-by-step assistance
Get Started
Accounting for Decision Making and Control
Authors: Jerold Zimmerman
8th edition
78025745, 978-0078025747