Answered step by step
Verified Expert Solution
Question
1 Approved Answer
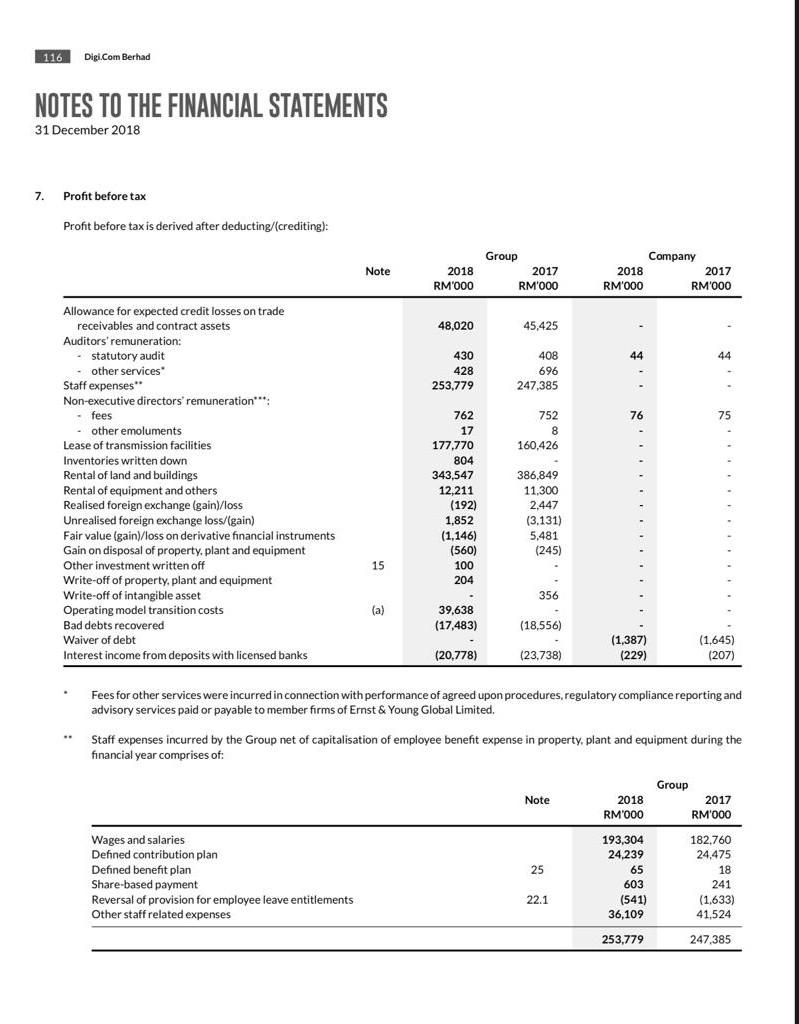
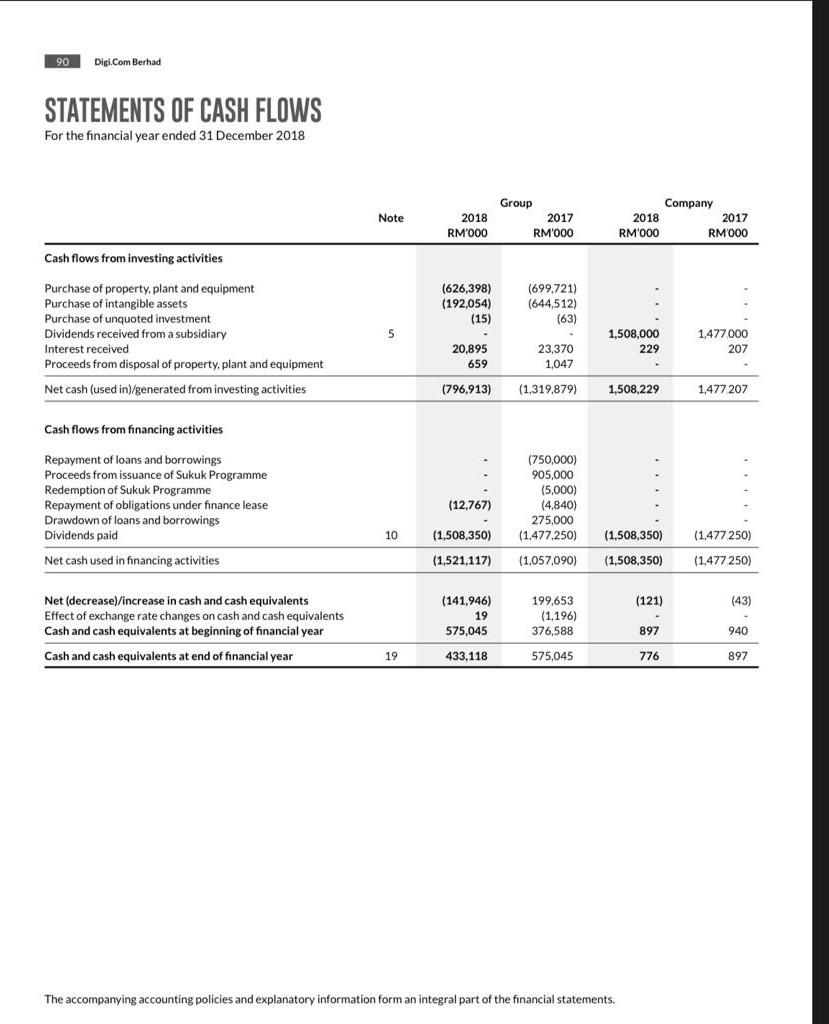
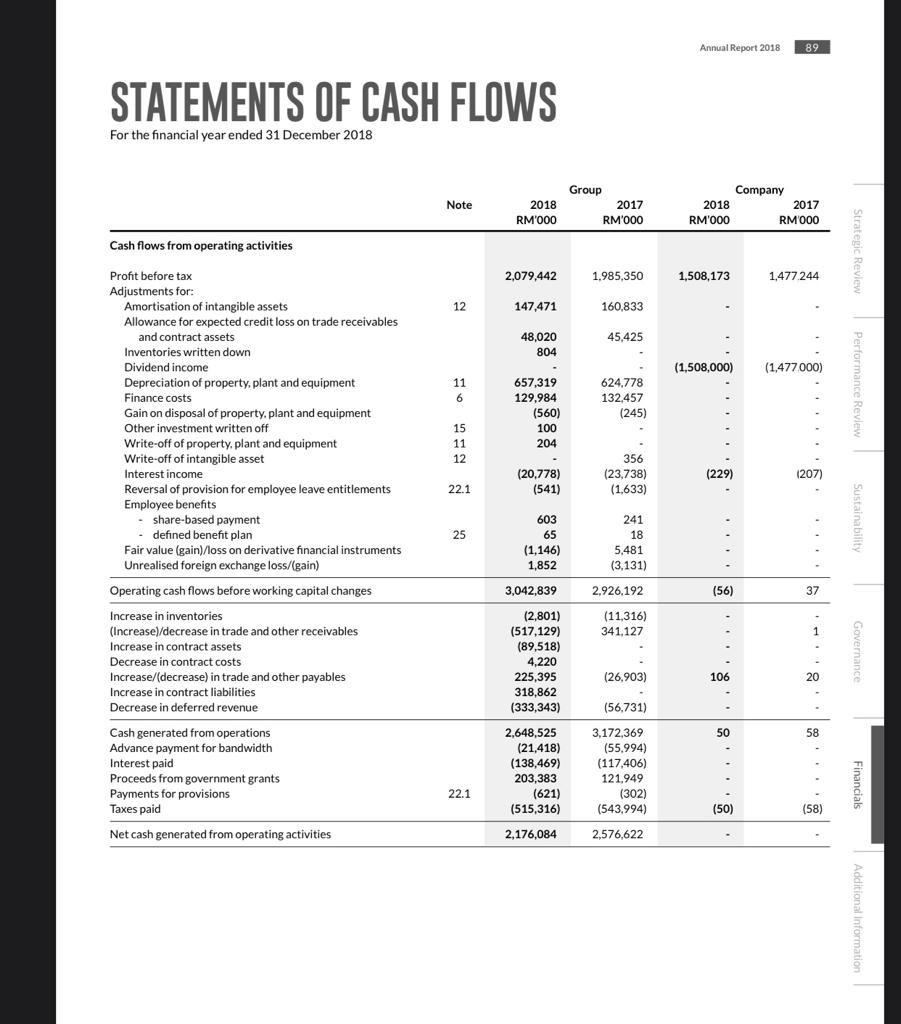
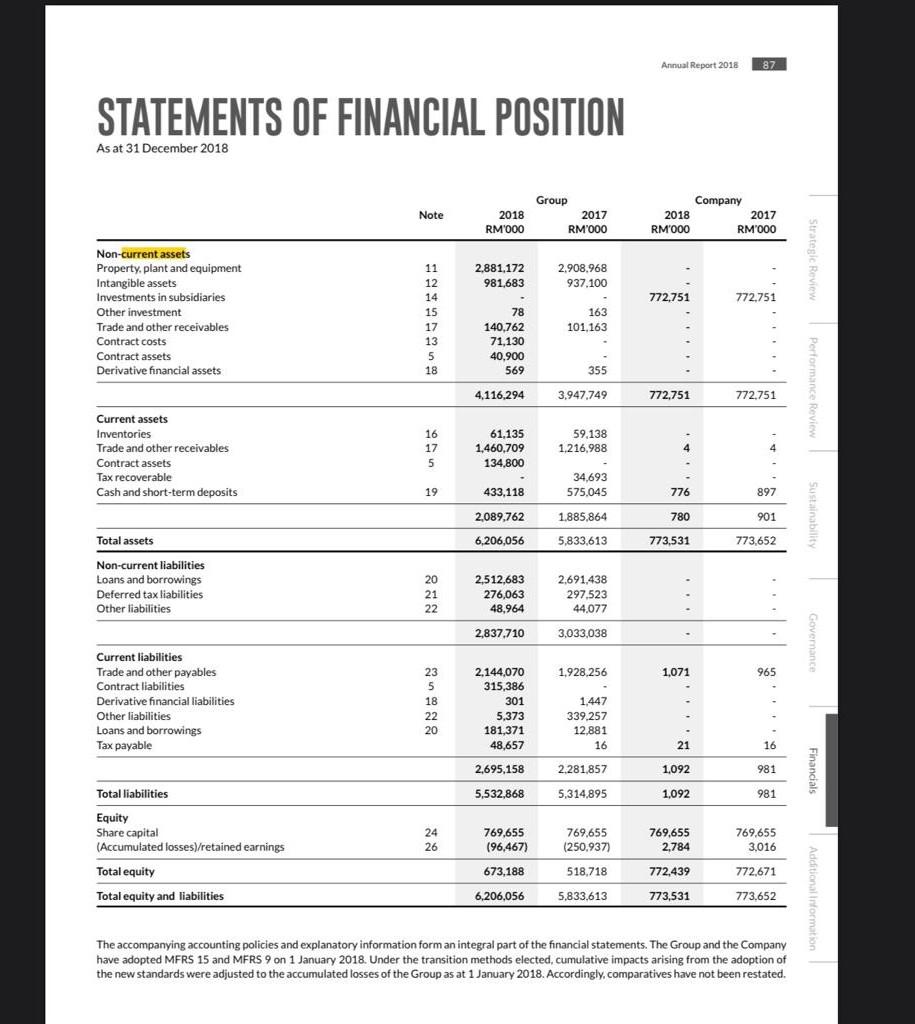
Please help me solve this, thanks! Calculate the following ratio categories and show the calculations for the year 2018: 1. Liquidity ratio 2. Activity/ Efficiency
Please help me solve this, thanks! Calculate the following ratio categories and show the calculations for the year 2018: 1. Liquidity ratio 2. Activity/ Efficiency ratio 3. Leverage/ debt ratio


116 Digi.Com Berhad NOTES TO THE FINANCIAL STATEMENTS 31 December 2018 7. Profit before tax Profit before tax is derived after deducting/crediting): Group Note 2018 RM'000 2017 RM'000 Company 2018 2017 RM'000 RM'000 48,020 45,425 44 44 430 428 253,779 408 696 247,385 76 75 762 17 177.770 804 752 8 160,426 Allowance for expected credit losses on trade receivables and contract assets Auditors' remuneration: statutory audit other services Staff expenses Non-executive directors' remuneration": fees - other emoluments Lease of transmission facilities Inventories written down Rental of land and buildings Rental of equipment and others Realised foreign exchange (gain)/loss Unrealised foreign exchange loss/(gain) Fair value (gain)/loss on derivative financial instruments Gain on disposal of property, plant and equipment Other investment written off Write-off of property, plant and equipment Write-off of intangible asset Operating model transition costs Bad debts recovered Waiver of debt Interest income from deposits with licensed banks 343,547 12,211 (192) 1,852 (1,146) (560) 100 204 386,849 11,300 2,447 (3.131) () 5,481 (245) ) 15 356 (a) 39.638 (17,483) (18,556) (20.778) (1,387) (229) (23,738) (1.645) (207) ( Fees for other services were incurred in connection with performance of agreed upon procedures, regulatory compliance reporting and advisory services paid or payable to member firms of Ernst & Young Global Limited. Staff expenses incurred by the Group net of capitalisation of employee benefit expense in property, plant and equipment during the financial year comprises of: Group Note 2018 RM'000 2017 RM'000 25 Wages and salaries Defined contribution plan Defined benefit plan Share-based payment Reversal of provision for employee leave entitlements Other staff related expenses 193,304 24,239 65 603 (541) 36,109 182.760 24,475 18 241 (1,633) 41,524 22.1 253,779 247.385 90 Digi.Com Berhad STATEMENTS OF CASH FLOWS For the financial year ended 31 December 2018 Note 2018 RM'000 Group 2017 RM'000 Company 2018 2017 RM'000 RM 000 Cash flows from investing activities (626,398) (192,054) (15) Purchase of property, plant and equipment Purchase of intangible assets Purchase of unquoted investment Dividends received from a subsidiary Interest received Proceeds from disposal of property, plant and equipment (699.721) (644,512) (63) 5 1,508,000 229 1,477 000 207 20,895 659 23,370 1,047 Net cash (used in)/generated from investing activities (796,913) (1,319,879) 1,508,229 1,477 207 Cash flows from financing activities Repayment of loans and borrowings Proceeds from issuance of Sukuk Programme Redemption of Sukuk Programme Repayment of obligations under finance lease Drawdown of loans and borrowings Dividends paid (750,000) 905,000 (5,000) (4,840) 275,000 (1.477.250) (12,767) 10 (1,508,350) (1,508,350) ) (1,508,350) (1.477 250) (1,477 250) Net cash used in financing activities (1,521,117) (1,057,090) () (121) (43) Net (decrease]/increase in cash and cash equivalents Effect of exchange rate changes on cash and cash equivalents Cash and cash equivalents at beginning of financial year (141,946) 19 575,045 199,653 (1,196) 376,588 897 940 Cash and cash equivalents at end of financial year 19 433.118 575,045 776 897 The accompanying accounting policies and explanatory information form an integral part of the financial statements. Annual Report 2018 89 STATEMENTS OF CASH FLOWS For the financial year ended 31 December 2018 Note 2018 RM'000 Group 2017 RM'000 Company 2018 2017 RM'000 RM1000 Cash flows from operating activities Strateic Review 2,079,442 1.985,350 1,508,173 1,477 244 12 147,471 160.833 48,020 45,425 804 (1,508,000) ) (1,477 000) 11 6 Profit before tax Adjustments for: Amortisation of intangible assets Allowance for expected credit loss on trade receivables and contract assets Inventories written down Dividend income Depreciation of property, plant and equipment Finance costs Gain on disposal of property, plant and equipment Other investment written off Write-off of property, plant and equipment Write-off of intangible asset Interest income Reversal of provision for employee leave entitlements Employee benefits - share-based payment defined benefit plan Fair value (gain)/loss on derivative financial instruments Unrealised foreign exchange loss/gain) 657,319 129,984 (560) 100 204 624.778 132,457 (245) Performance Review 15 11 12 356 (23,738) (1,633) (229) (20,778) (541) (207) 22.1 603 65 (1,146) 1,852 25 241 18 5,481 (3.131) Sustainability Operating cash flows before working capital changes 3,042,839 2.926.192 (56) 37 (11,316) 341.127 1 (2,801) (517,129) (89,518) 4,220 225,395 318,862 (333,343) Governance (26,903) 106 20 (56,731) Increase in inventories (Increase)/decrease in trade and other receivables Increase in contract assets Decrease in contract costs Increase/(decrease) in trade and other payables Increase in contract liabilities Decrease in deferred revenue Cash generated from operations Advance payment for bandwidth Interest paid Proceeds from government grants Payments for provisions Taxes paid Net cash generated from operating activities 50 58 2,648,525 (21,418) (138,469) 203,383 (621) (515,316) 3,172,369 (55.994) (117,406) 121,949 (302) (543,994) Financials 22.1 (50) (58) 2,176,084 2,576,622 Additional information Annual Report 2018 87 STATEMENTS OF FINANCIAL POSITION As at 31 December 2018 Note 2018 RM'000 Group 2017 RM'000 Company 2018 2017 RM'000 RM'000 2.881,172 981,683 2.908.968 937.100 772.751 772.751 Non-current assets - Property, plant and equipment Intangible assets Investments in subsidiaries Other investment Trade and other receivables Contract costs Contract assets Derivative financial assets 11 12 14 15 17 13 5 18 163 101,163 78 140.762 71,130 40.900 569 355 4,116,294 3,947,749 772.751 772.751 16 17 5 Current assets Inventories Trade and other receivables Contract assets Tax recoverable Cash and short-term deposits 61,135 1,460,709 134,800 59,138 1,216,988 4 34,693 575,045 19 433,118 776 897 2,089,762 1.885,864 780 901 6,206,056 5,833,613 773,531 773,652 Total assets Non-current liabilities Loans and borrowings Deferred tax liabilities Other liabilities 20 21 22 2,512,683 276,063 48,964 2.691.438 297,523 44,077 2,837,710 3,033,038 Governance 1.928,256 1,071 965 Current liabilities Trade and other payables Contract liabilities Derivative financial liabilities Other liabilities Loans and borrowings Tax payable 23 5 18 22 20 2,144,070 315,386 301 5,373 181,371 48,657 1,447 339.257 12,881 16 21 16 2,695,158 2.281.857 1,092 981 Financials Total liabilities 5,532,868 5,314,895 1,092 981 Equity Share capital (Accumulated losses)/retained earnings Total equity 24 26 769,655 (96,467) 769,655 (250,937) 769,655 2,784 769.655 3,016 673,188 772,439 772,671 518,718 5,833.613 Total equity and liabilities 6,206,056 773,531 773,652 The accompanying accounting policies and explanatory information form an integral part of the financial statements. The Group and the Company have adopted MFRS 15 and MFRS 9 on 1 January 2018. Under the transition methods elected, cumulative impacts arising from the adoption of the new standards were adjusted to the accumulated losses of the Group as at 1 January 2018. Accordingly. comparatives have not been restated
Step by Step Solution
There are 3 Steps involved in it
Step: 1

Get Instant Access to Expert-Tailored Solutions
See step-by-step solutions with expert insights and AI powered tools for academic success
Step: 2

Step: 3

Ace Your Homework with AI
Get the answers you need in no time with our AI-driven, step-by-step assistance
Get Started


