Please help me solve this, thanks!
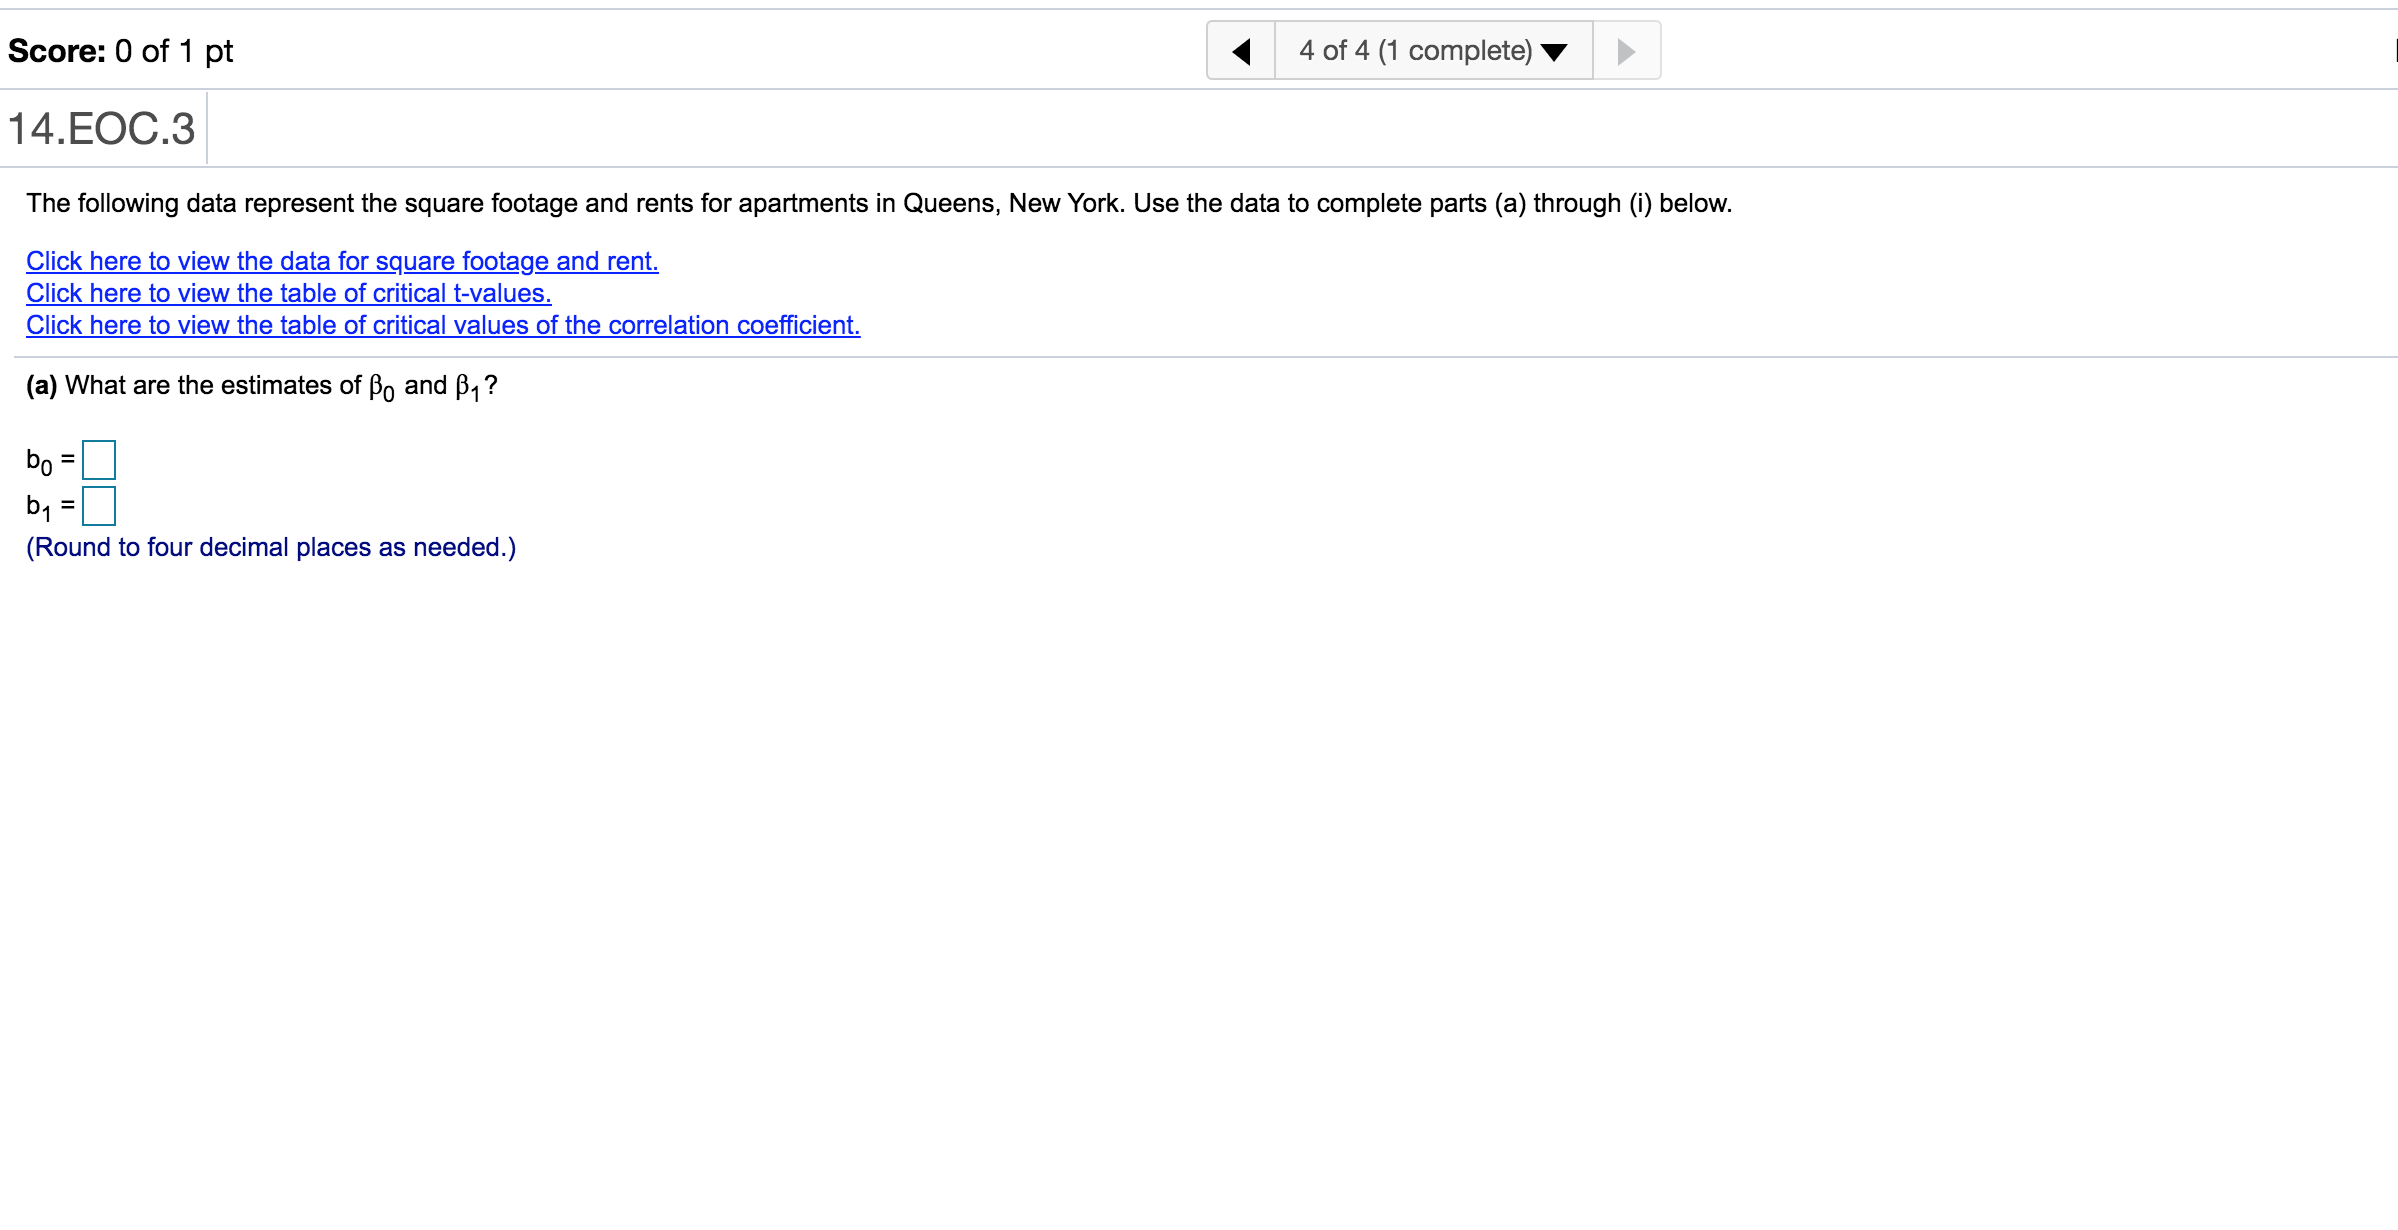
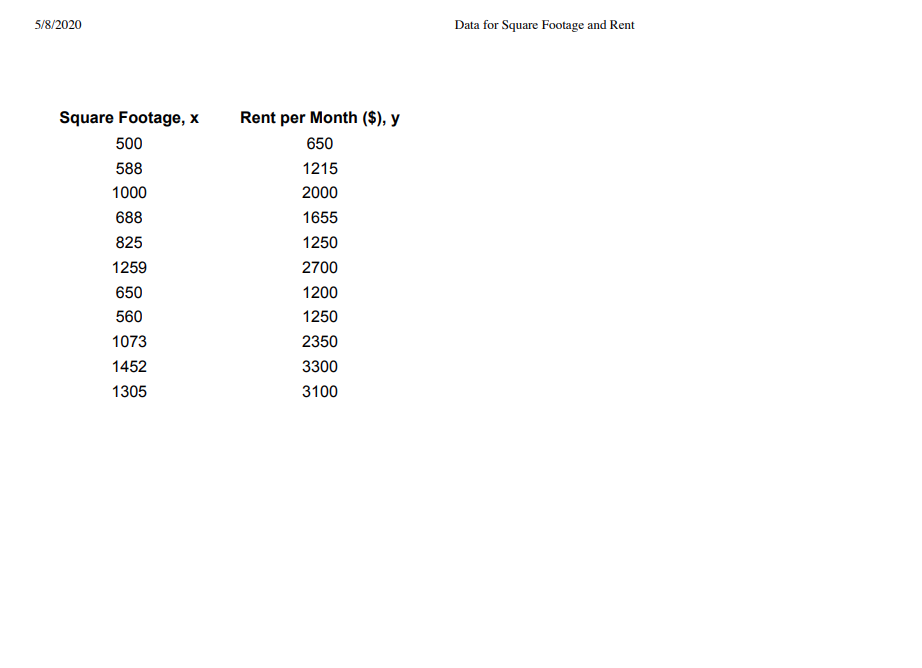
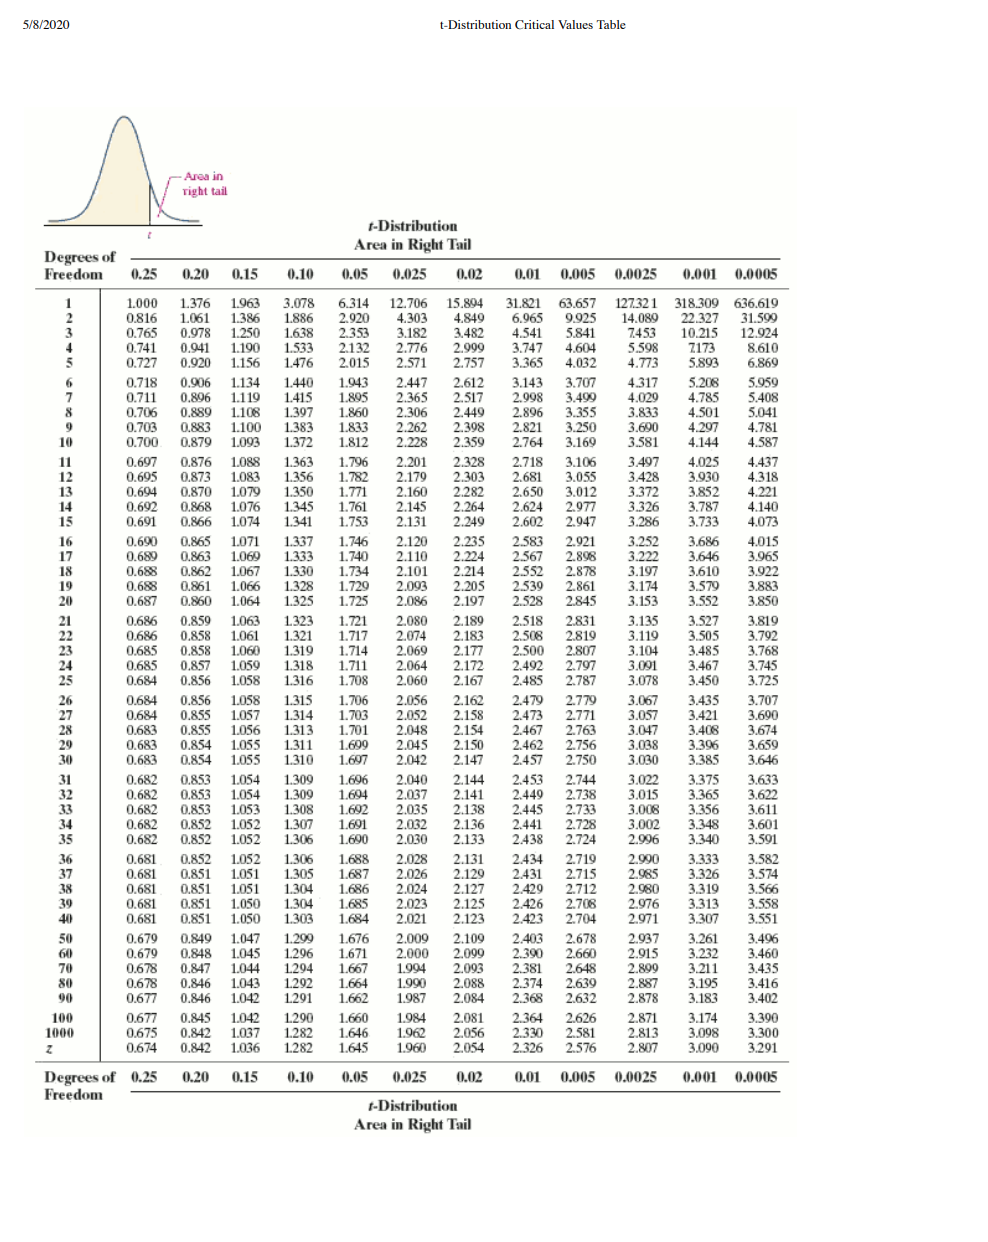
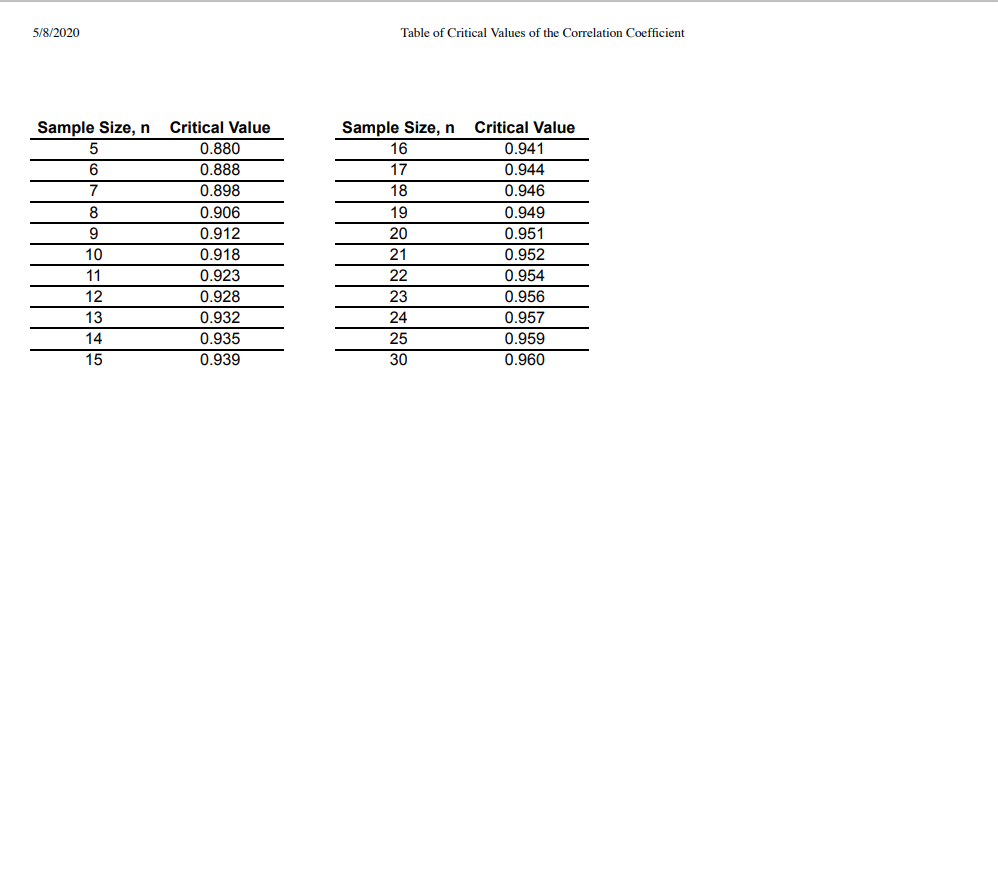
Score: 0 of 1 pt I 4 of 4 (1 complete) V D 14.EOC.3 The following data represent the square footage and rents for apartments in Queens. New York. Use the data to complete parts (a) through (i) below. Click here to View the data for square footage and rent. Click here to View the table of critical t-values. Click here to View the table of critical values of the correlation coefcient. (a) What are the estimates of [30 and [51? bo=:l b1=:l (Round to four decimal places as needed.) 51312021] Data for Square Footage and Rent Square Footage, x Rent per Month 6), y 500 650 588 121 5 1 000 2000 688 1655 825 1250 1 259 2700 650 1200 560 1250 1 073 2 350 1452 3300 1305 3100 5/8/2020 right tail Area in Right Tail Degrees of Freedom 0.25 0.05 0.025 ).02 0.0025 1.376 5.314 63.657 0.816 1.061 1.386 1.886 2.920 4.303 4.849 6.965 9.925 14.089 0.765 1.250 1.638 2.353 3.182 3.482 4.541 5.841 7453 0.941 1.190 1.533 2132 2.776 2.909 3,747 5.598 7173 8.610 0.727 1.156 2.571 2.757 5.893 2.44 2.365 0.889 1.108 1.397 1.860 2.306 2.449 2.896 3.355 3.833 4.501 5.041 0.703 1.100 1.833 2.26 2.398 2.821 3.250 4.297 4.781 0.879 1.093 1.812 2.359 3.169 3.581 4.144 4.587 0.697 1.363 1.79 2.201 2.328 3.106 3.497 4.025 4.437 0.695 0.873 1.083 1.356 2.179 2.681 3.055 3.930 4.318 0.694 0.870 1.079 .221 3.787 1.074 0.690 1.337 1.746 2.120 2.235 2.921 3.252 3.686 0.863 1.069 1.333 1.740 2.567 2.898 3.222 3.646 3.965 0.688 0.862 1.330 1.734 2.101 2.552 2.878 3.197 3.610 0.861 1.066 2.093 2.861 3.174 3.579 3.153 3.552 2.08 3.527 0.858 1.319 1.714 2.069 2.500 2.492 2.807 3.104 0.857 1.059 1.318 2.797 3.091 3.745 0.856 1.058 1.316 1.708 2.167 2.485 2.787 3.078 3.450 3.725 1.315 1.706 2.056 2.779 3.067 0.684 0.855 1.057 1.314 1.703 2.05 2.158 2.473 2.771 3.057 3.421 0.683 1.056 1.313 1.701 3.047 3.408 1.690 0.682 1.054 1.309 2.453 3.022 3.375 0.853 1.054 1.309 1.694 2.03 2.141 2.449 3.015 3.365 3.622 1.308 1.692 2.733 3.008 0.8.52 1.052 1.307 1.691 2.032 2.441 3.002 3.601 2.133 2.438 3.59 0.852 1.306 1.688 2.028 3.333 1.304 2.02 2.980 1.304 2.02 0.851 2.02 2.123 2.423 2.704 2.971 3.307 3.551 0.679 1.209 1.676 2.109 2.403 2.678 3.261 3.496 0.679 0.848 1.045 1.296 2.000 2.390 2.660 3.232 0.847 1.044 1.99 2.093 2.648 3.435 0.678 0.846 1.043 1.292 2.639 0.677 0.845 1.042 1.98 2.081 2.364 3.174 1000 0.675 1.037 1.282 1.646 1.962 2.056 2.330 2.581 2.813 3.098 3.300 0.674 1.282 1.645 1.961 2.054 2.326 2.576 2.807 3.090 Degrees of 0.25 0.15 0.10 0.05 0.02 0.01 0.005 0.0025 0.001 0.0005 Freedom Area in Right Tail5/8/2020 Table of Critical Values of the Correlation Coefficient Sample Size, n Critical Value 5 0.880 Sample Size, n Critical Value 6 16 0.888 0.941 7 17 0.898 0.944 8 18 0.906 0.946 9 0.912 19 0.949 10 20 0.918 ).951 11 21 0.923 0.952 12 22 0.928 0.954 13 23 0.932 0.956 14 24 0.935 ).957 15 25 0.939 0.959 30 0.960


