

Answered step by step
Verified Expert Solution
Question
1 Approved Answer
please help me. Table 1: Number of individuals in population after several significant events Bean Mimic Variant: Brown Mottled Plain White Black Ringed Beige Original
please help me.
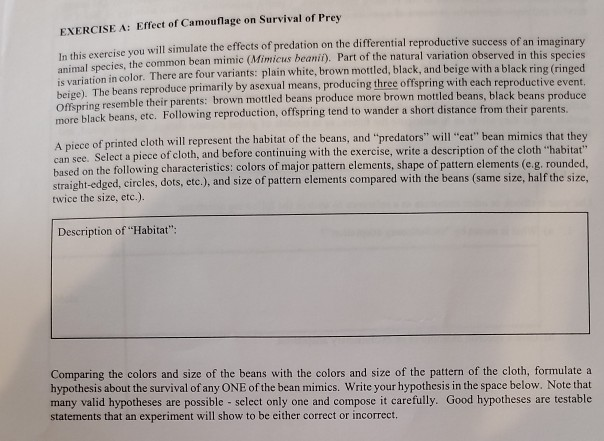
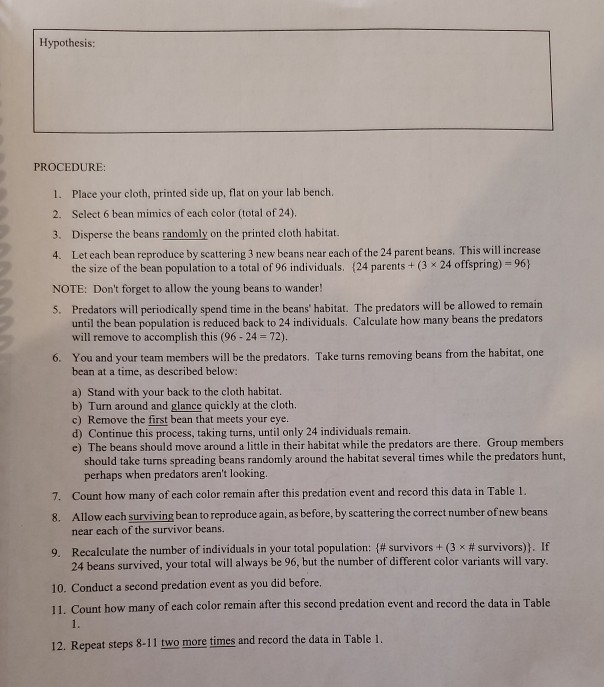
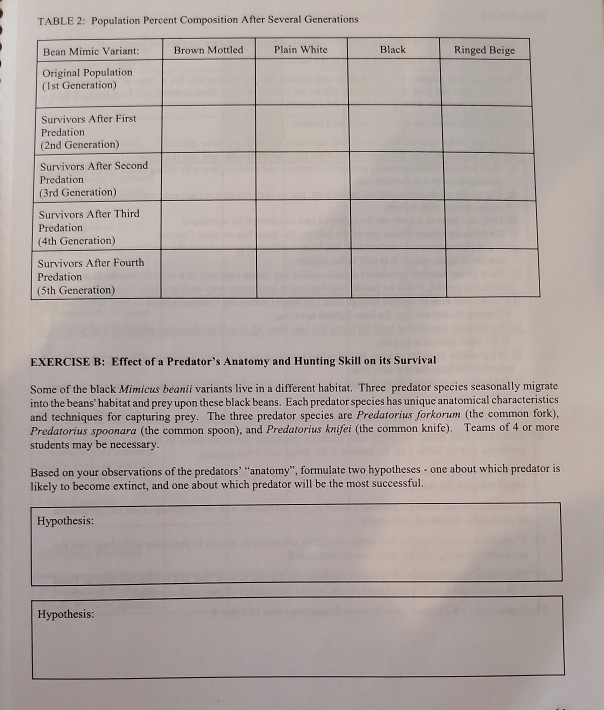
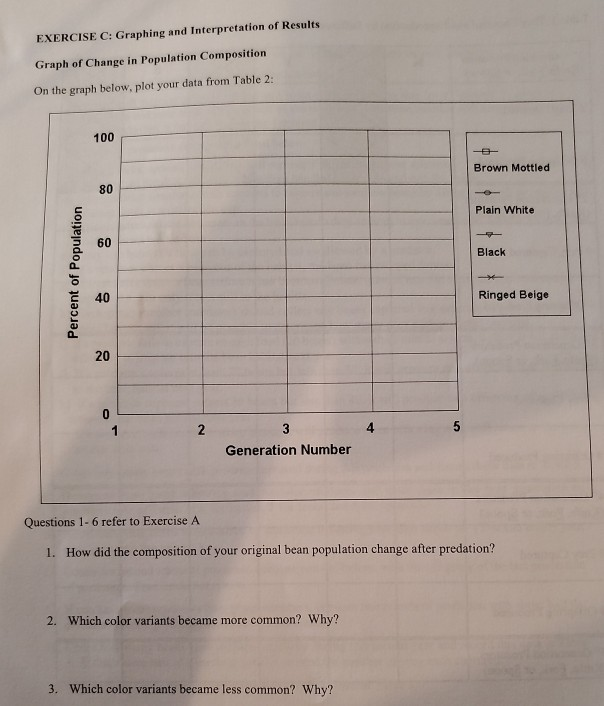
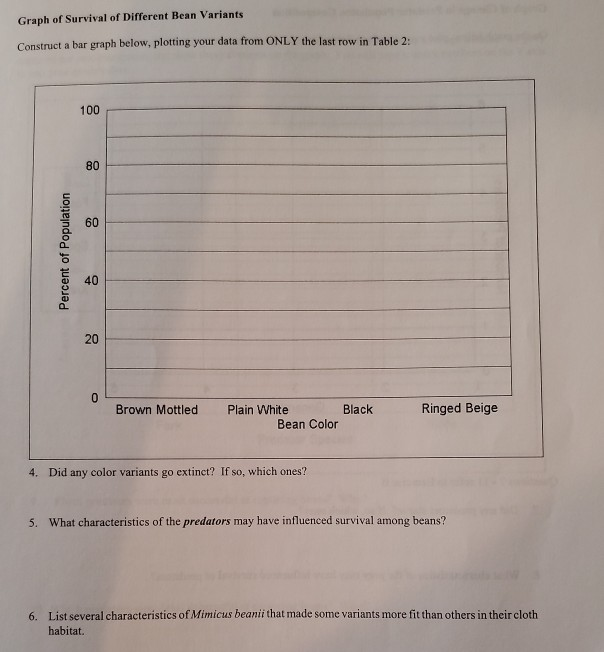
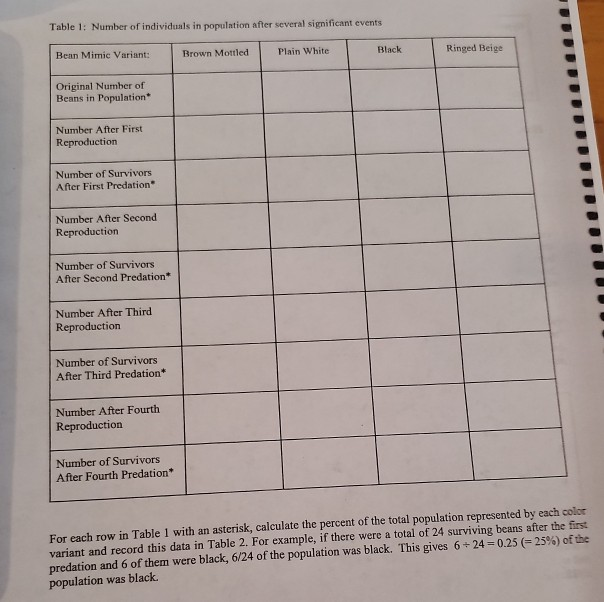
Table 1: Number of individuals in population after several significant events Bean Mimic Variant: Brown Mottled Plain White Black Ringed Beige Original Number of Beans in Population Number After First Reproduction Number of Survivors After First Predation* Number After Second Reproduction Number of Survivors After Second Predation* Number After Third Reproduction Number of Survivors After Third Predation* Number After Fourth Reproduction Number of Survivors After Fourth Predation For each row in Table 1 with an asterisk, calculate the percent of the total population represented by each color variant and record this data in Table 2. For example, if there were a total of 24 surviving beans after the first predation and 6 of them were black, 6/24 of the population was black. This gives 6 + 24 = 0.25=25%) of the population was black EXERCISE A: Effect of Camouflage on Survival of Prey In this exercise you will simulate the effects of predation on the differential reproductive success of an imaginary animal species, the common bean mimic (Mimicus beanin). Part of the natural variation observed in this species is variation in color. There are four variants: plain white, brown mottled, black, and beige with a black ring (ringed beige). The beans reproduce primarily by asexual means, producing three offspring with each reproductive event. Offspring resemble their parents: brown mottled beans produce more brown mottled beans, black beans produce more black beans, etc. Following reproduction, offspring tend to wander a short distance from their parents. A piece of printed cloth will represent the habitat of the beans, and "predators" will "eat bean mimics that they can see. Select a piece of cloth, and before continuing with the exercise, write a description of the cloth "habitat based on the following characteristics: colors of major pattern elements, shape of pattern elements (eg, rounded, straight-edged, circles, dots, etc.), and size of pattern elements compared with the beans (same size, half the size, twice the size, etc.). Description of "Habitat": Comparing the colors and size of the beans with the colors and size of the pattern of the cloth, formulate a hypothesis about the survival of any ONE of the bean mimics. Write your hypothesis in the space below. Note that many valid hypotheses are possible - select only one and compose it carefully. Good hypotheses are testable statements that an experiment will show to be either correct or incorrect. Hypothesis: PROCEDURE: 1. Place your cloth, printed side up, flat on your lab bench 2. Select 6 bean mimics of each color (total of 24). 3. Disperse the beans randomly on the printed cloth habitat. 4. Let cach bean reproduce by scattering 3 new beans near each of the 24 parent beans. This will increase the size of the bean population to a total of 96 individuals. (24 parents + (3 x 24 offspring) = 96) NOTE: Don't forget to allow the young beans to wander! 5. Predators will periodically spend time in the beans' habitat. The predators will be allowed to remain until the bean population is reduced back to 24 individuals. Calculate how many beans the predators will remove to accomplish this (96 - 24 = 72), 6. You and your team members will be the predators. Take turns removing beans from the habitat, one bean at a time, as described below: a) Stand with your back to the cloth habitat. b) Turn around and glance quickly at the cloth. c) Remove the first bean that meets your eye. d) Continue this process, taking turns, until only 24 individuals remain. e) The beans should move around a little in their habitat while the predators are there. Group members should take turns spreading beans randomly around the habitat several times while the predators hunt, perhaps when predators aren't looking 7. Count how many of each color remain after this predation event and record this data in Table 1. 8. Allow cach surviving bean to reproduce again, as before, by scattering the correct number of new beans near each of the survivor beans. 9. Recalculate the number of individuals in your total population: (# survivors +(3 x # survivors). If 24 beans survived, your total will always be 96, but the number of different color variants will vary. 10. Conduct a second predation event as you did before. 11. Count how many of each color remain after this second predation event and record the data in Table 1. 12. Repeat steps 8-11 two more times and record the data in Table 1. TABLE 2: Population Percent Composition After Several Generations Bean Mimic Variant: Brown Mottled Plain White Black Ringed Beige Original Population (Ist Generation) Survivors After First Predation (2nd Generation) Survivors After Second Predation (3rd Generation) Survivors After Third Predation (4th Generation) Survivors After Fourth Predation (5th Generation) EXERCISE B: Effect of a Predator's Anatomy and Hunting Skill on its Survival Some of the black Mimicus beanii variants live in a different habitat. Three predator species seasonally migrate into the beans' habitat and prey upon these black beans. Each predator species has unique anatomical characteristics and techniques for capturing prey. The three predator species are Predatorius forkorum (the common fork), Predatorius spoonara (the common spoon), and Predatorius knifei (the common knife). Teams of 4 or more students may be necessary. Based on your observations of the predators' anatomy", formulate two hypotheses - one about which predator is likely to become extinct, and one about which predator will be the most successful. Hypothesis: Hypothesis: EXERCISE C: Graphing and Interpretation of Results Graph of Change in Population Composition On the graph below, plot your data from Table 2: 100 Brown Mottled 80 Plain White 60 - Black Percent of Population 40 Ringed Beige 20 0 1 2 3 5 Generation Number Questions 1-6 refer to Exercise A 1. How did the composition of your original bean population change after predation? 2. Which color variants became more common? Why? 3. Which color variants became less common? Why? Graph of Survival of Different Bean Variants Construct a bar graph below, plotting your data from ONLY the last row in Table 2: 100 80 60 Percent of Population 40 20 0 Brown Mottled Plain White Black Bean Color Ringed Beige 4. Did any color variants go extinct? If so, which ones? 5. What characteristics of the predators may have influenced survival among beans? 6. List several characteristics of Mimicus beanii that made some variants more fit than others in their cloth habitat. Table 1: Number of individuals in population after several significant events Bean Mimic Variant: Brown Mottled Plain White Black Ringed Beige Original Number of Beans in Population Number After First Reproduction Number of Survivors After First Predation* Number After Second Reproduction Number of Survivors After Second Predation* Number After Third Reproduction Number of Survivors After Third Predation* Number After Fourth Reproduction Number of Survivors After Fourth Predation For each row in Table 1 with an asterisk, calculate the percent of the total population represented by each color variant and record this data in Table 2. For example, if there were a total of 24 surviving beans after the first predation and 6 of them were black, 6/24 of the population was black. This gives 6 + 24 = 0.25=25%) of the population was black EXERCISE A: Effect of Camouflage on Survival of Prey In this exercise you will simulate the effects of predation on the differential reproductive success of an imaginary animal species, the common bean mimic (Mimicus beanin). Part of the natural variation observed in this species is variation in color. There are four variants: plain white, brown mottled, black, and beige with a black ring (ringed beige). The beans reproduce primarily by asexual means, producing three offspring with each reproductive event. Offspring resemble their parents: brown mottled beans produce more brown mottled beans, black beans produce more black beans, etc. Following reproduction, offspring tend to wander a short distance from their parents. A piece of printed cloth will represent the habitat of the beans, and "predators" will "eat bean mimics that they can see. Select a piece of cloth, and before continuing with the exercise, write a description of the cloth "habitat based on the following characteristics: colors of major pattern elements, shape of pattern elements (eg, rounded, straight-edged, circles, dots, etc.), and size of pattern elements compared with the beans (same size, half the size, twice the size, etc.). Description of "Habitat": Comparing the colors and size of the beans with the colors and size of the pattern of the cloth, formulate a hypothesis about the survival of any ONE of the bean mimics. Write your hypothesis in the space below. Note that many valid hypotheses are possible - select only one and compose it carefully. Good hypotheses are testable statements that an experiment will show to be either correct or incorrect. Hypothesis: PROCEDURE: 1. Place your cloth, printed side up, flat on your lab bench 2. Select 6 bean mimics of each color (total of 24). 3. Disperse the beans randomly on the printed cloth habitat. 4. Let cach bean reproduce by scattering 3 new beans near each of the 24 parent beans. This will increase the size of the bean population to a total of 96 individuals. (24 parents + (3 x 24 offspring) = 96) NOTE: Don't forget to allow the young beans to wander! 5. Predators will periodically spend time in the beans' habitat. The predators will be allowed to remain until the bean population is reduced back to 24 individuals. Calculate how many beans the predators will remove to accomplish this (96 - 24 = 72), 6. You and your team members will be the predators. Take turns removing beans from the habitat, one bean at a time, as described below: a) Stand with your back to the cloth habitat. b) Turn around and glance quickly at the cloth. c) Remove the first bean that meets your eye. d) Continue this process, taking turns, until only 24 individuals remain. e) The beans should move around a little in their habitat while the predators are there. Group members should take turns spreading beans randomly around the habitat several times while the predators hunt, perhaps when predators aren't looking 7. Count how many of each color remain after this predation event and record this data in Table 1. 8. Allow cach surviving bean to reproduce again, as before, by scattering the correct number of new beans near each of the survivor beans. 9. Recalculate the number of individuals in your total population: (# survivors +(3 x # survivors). If 24 beans survived, your total will always be 96, but the number of different color variants will vary. 10. Conduct a second predation event as you did before. 11. Count how many of each color remain after this second predation event and record the data in Table 1. 12. Repeat steps 8-11 two more times and record the data in Table 1. TABLE 2: Population Percent Composition After Several Generations Bean Mimic Variant: Brown Mottled Plain White Black Ringed Beige Original Population (Ist Generation) Survivors After First Predation (2nd Generation) Survivors After Second Predation (3rd Generation) Survivors After Third Predation (4th Generation) Survivors After Fourth Predation (5th Generation) EXERCISE B: Effect of a Predator's Anatomy and Hunting Skill on its Survival Some of the black Mimicus beanii variants live in a different habitat. Three predator species seasonally migrate into the beans' habitat and prey upon these black beans. Each predator species has unique anatomical characteristics and techniques for capturing prey. The three predator species are Predatorius forkorum (the common fork), Predatorius spoonara (the common spoon), and Predatorius knifei (the common knife). Teams of 4 or more students may be necessary. Based on your observations of the predators' anatomy", formulate two hypotheses - one about which predator is likely to become extinct, and one about which predator will be the most successful. Hypothesis: Hypothesis: EXERCISE C: Graphing and Interpretation of Results Graph of Change in Population Composition On the graph below, plot your data from Table 2: 100 Brown Mottled 80 Plain White 60 - Black Percent of Population 40 Ringed Beige 20 0 1 2 3 5 Generation Number Questions 1-6 refer to Exercise A 1. How did the composition of your original bean population change after predation? 2. Which color variants became more common? Why? 3. Which color variants became less common? Why? Graph of Survival of Different Bean Variants Construct a bar graph below, plotting your data from ONLY the last row in Table 2: 100 80 60 Percent of Population 40 20 0 Brown Mottled Plain White Black Bean Color Ringed Beige 4. Did any color variants go extinct? If so, which ones? 5. What characteristics of the predators may have influenced survival among beans? 6. List several characteristics of Mimicus beanii that made some variants more fit than others in their cloth habitat
Step by Step Solution
There are 3 Steps involved in it
Step: 1

Get Instant Access to Expert-Tailored Solutions
See step-by-step solutions with expert insights and AI powered tools for academic success
Step: 2

Step: 3
Ace Your Homework with AI
Get the answers you need in no time with our AI-driven, step-by-step assistance
Get Started
Advanced Financial Accounting
Authors: Theodore E. Christensen, David M. Cottrell, Richard E. Baker
10th edition
78025621, 978-0078025624