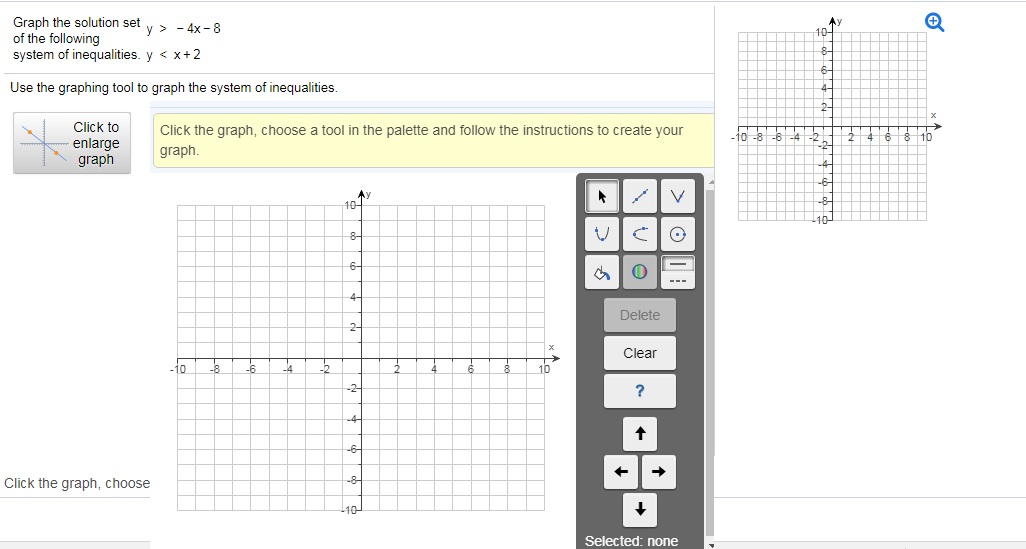
please help me the best way you can, the professor has provided us with how she would like us to graph. i attached her faq. can you please answer with a graph attached. thanks
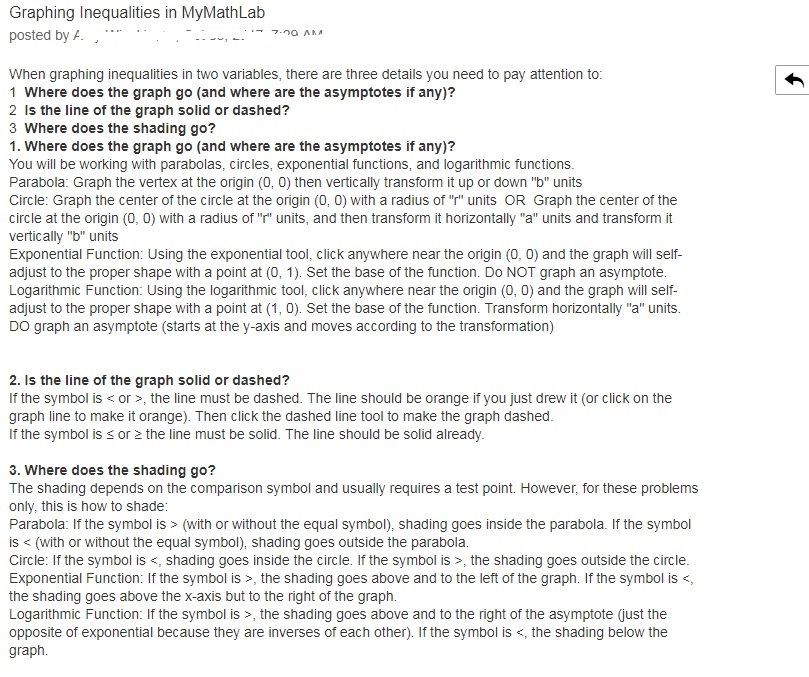
Graphing Inequalities in MylvlathLab posted by}! _. ...- -' . ._---'-'1 ._.I '' T-J'ID .I'lltl When graphing inequalities in two variables, there are three details you need to pay attention to: 1 Where does the graph go {and where are the asymptotes if any}? 2 Is the line of the graph solid or dashed? 3 Where does the shading go? 1. Where does the graph go {and where are the asymptotes if any}? You will be wort-ring with parabolas, circles, exponential functions, and logarithmic functions. Parabola: Graph the vertex at the origin {(1, D} then vertically transform it up or down "b" units Circle: Graph the center of the circle at the origin {(1, D} with a radius of "r' units DR Graph the center of the circle at the origin {I}, D} with a radius of "f" units. and then transform it honzontalty "a" units and transform it vertically "b" units Exponential Function: Using the exponential tool, clicl-r anywhere near the origin [I], D] and the graph will self- adjust to the proper shape with a point at [l]. 1}. Set the base of the function. Do NOT graph an asymptote. Logarithmic Function: Using the logarithmic tool, click anywhere nearthe origin (D. U} and the graph will self- adjust to the proper shape with a point at {1, [1}. Set the base of the function. Transform horizontally "a" units. no graph an asymptote {starts at the y-axis and moves according to the transformation] 2. Is the line of the graph solid or dashed? If the symbol is a; or a, the line must be dashed. The line should be orange if you just drew it {orcliclr on the graph line to make it orange}. Then click the dashed line tool to make the graph dashed. If the symbol is s or a the line must be solid. The line should be solid already. 3. Where does the shading go? The shading depends on the comparison symbol and usually requires a test point. However, for these problems only, this is how to shade: Parabola: If the symbol is > (with or without the equal symbol], shading goes inside the parabola. If the symbol is <: or without the equal symbol shading goes outside parabola. circle: lfthe is inside circle. if a exponential function: above and to left of graph. xaxis but right logarithmic>1 the shading goes above and to the right of the asymptote (just the opposite of exponential because they are inverses of each other]. If the symbol is


