please help me
this is round 3
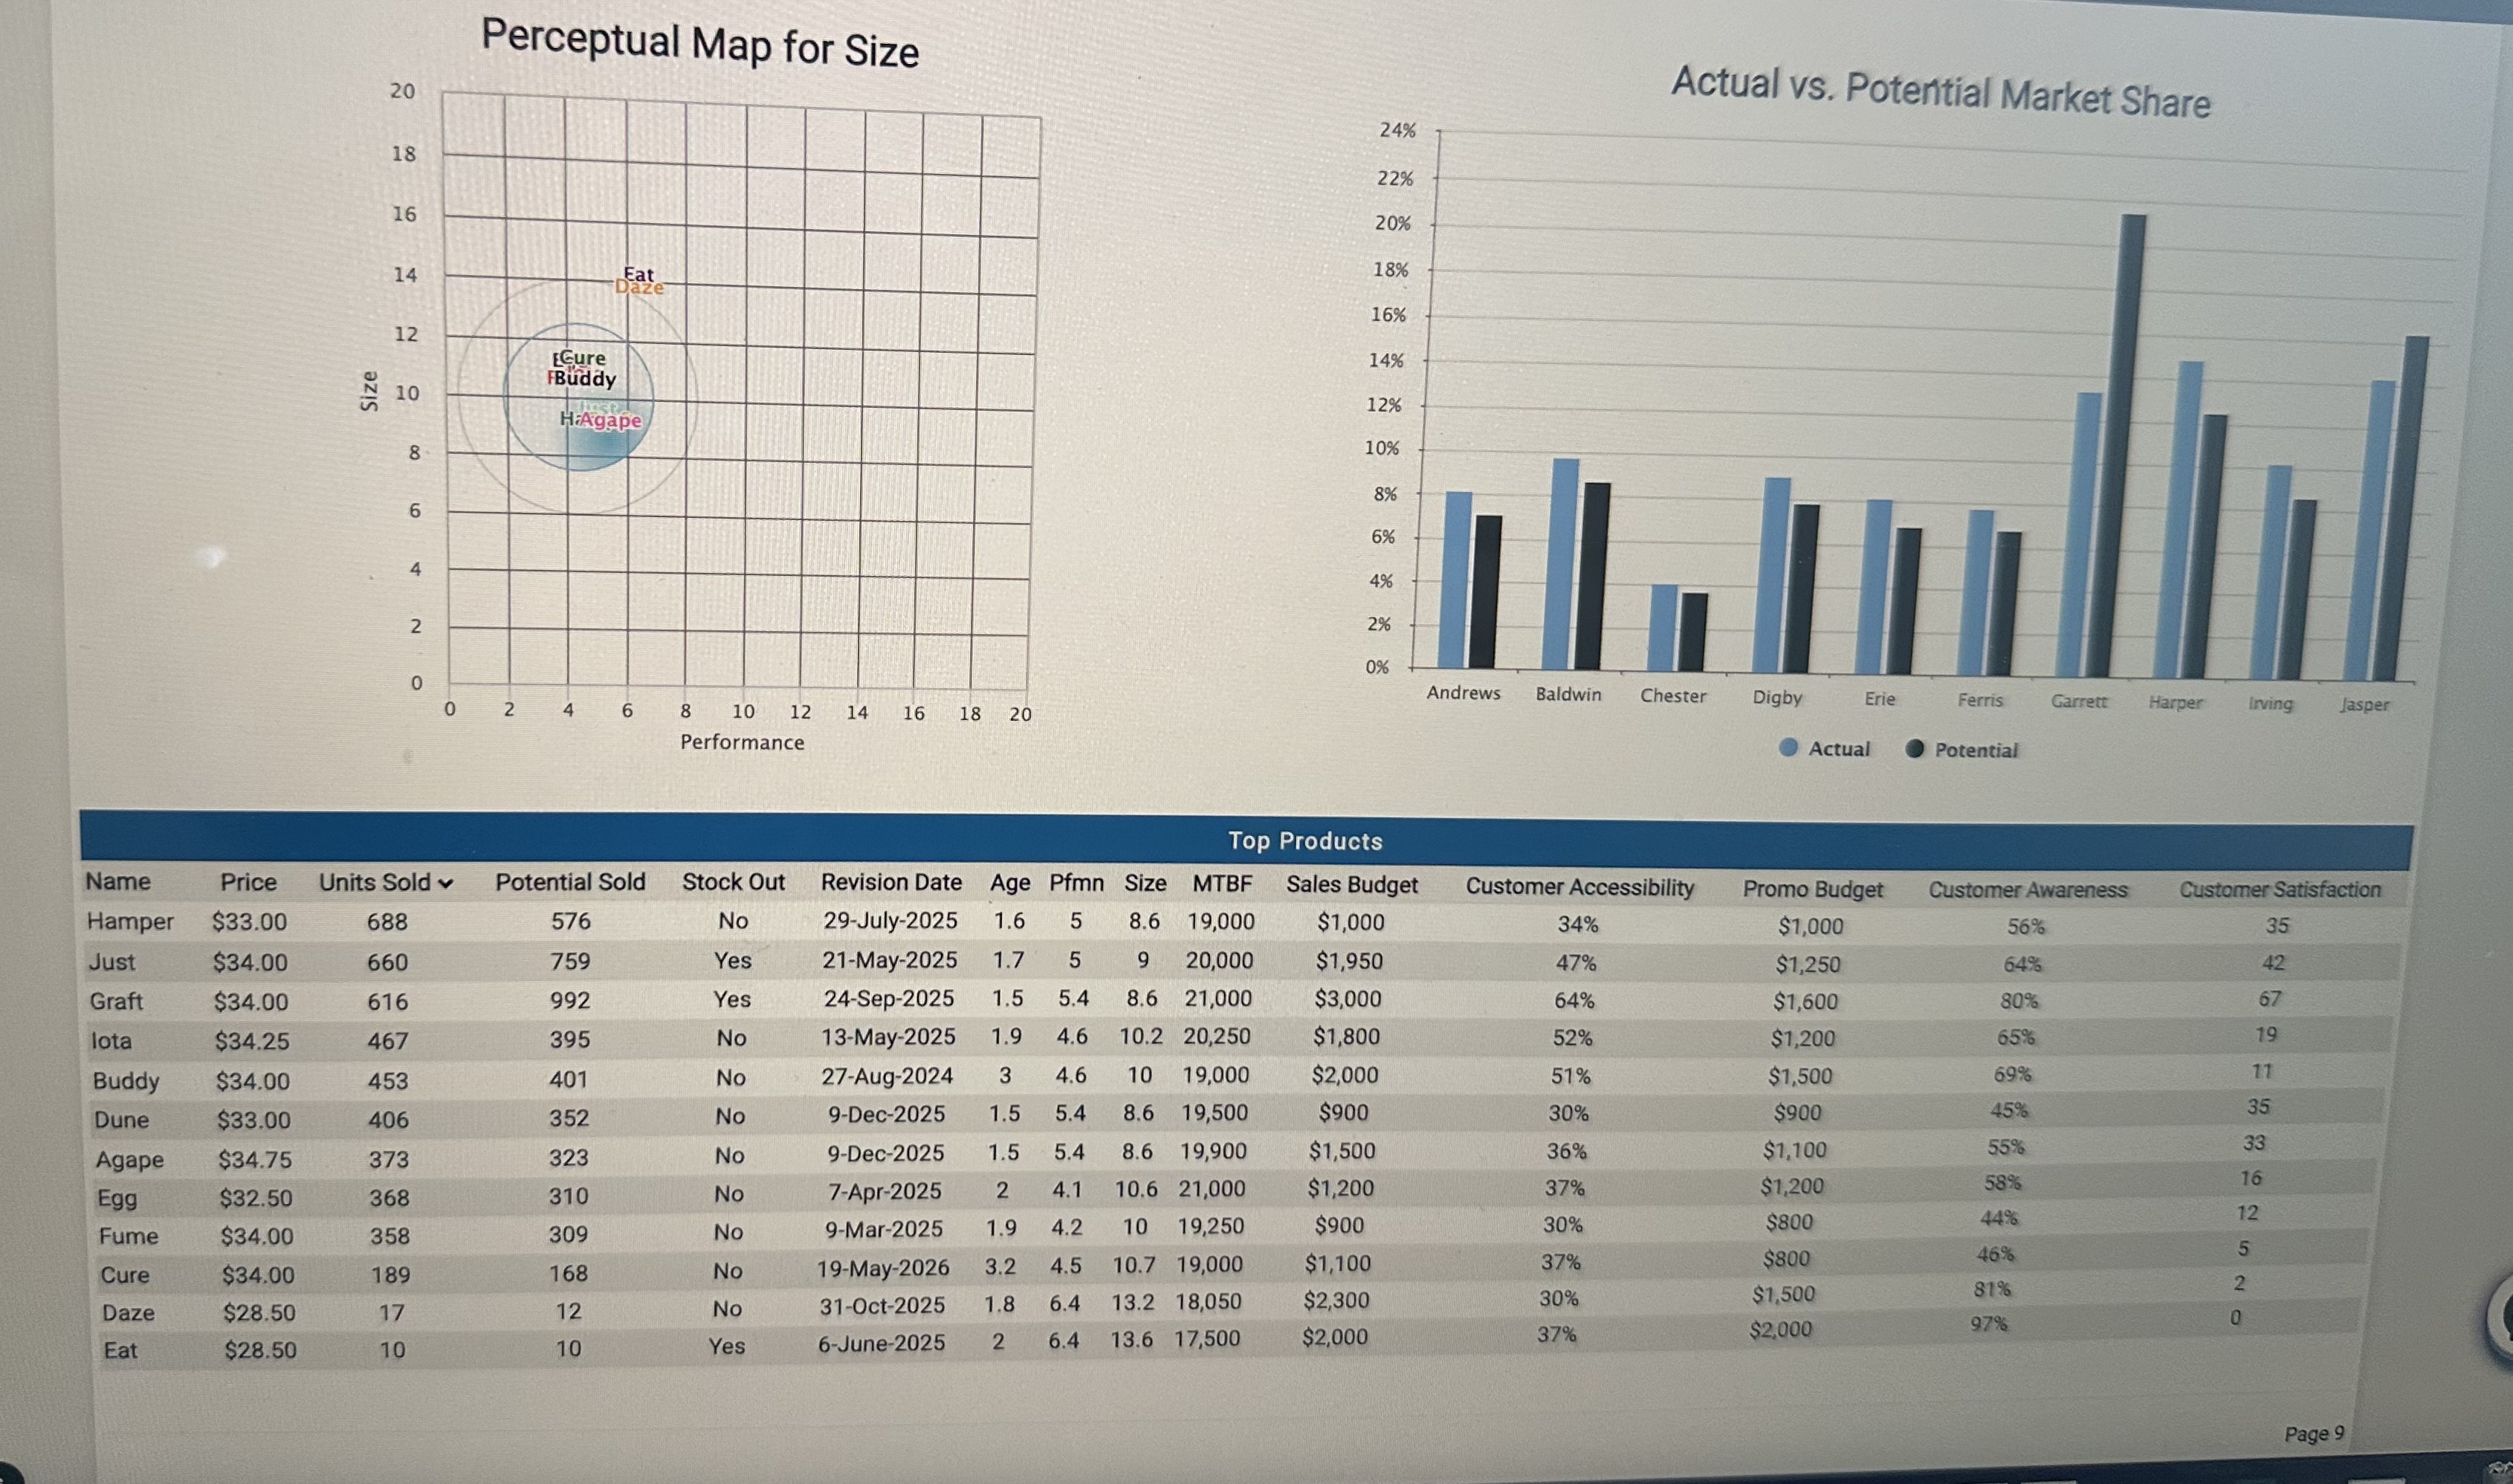
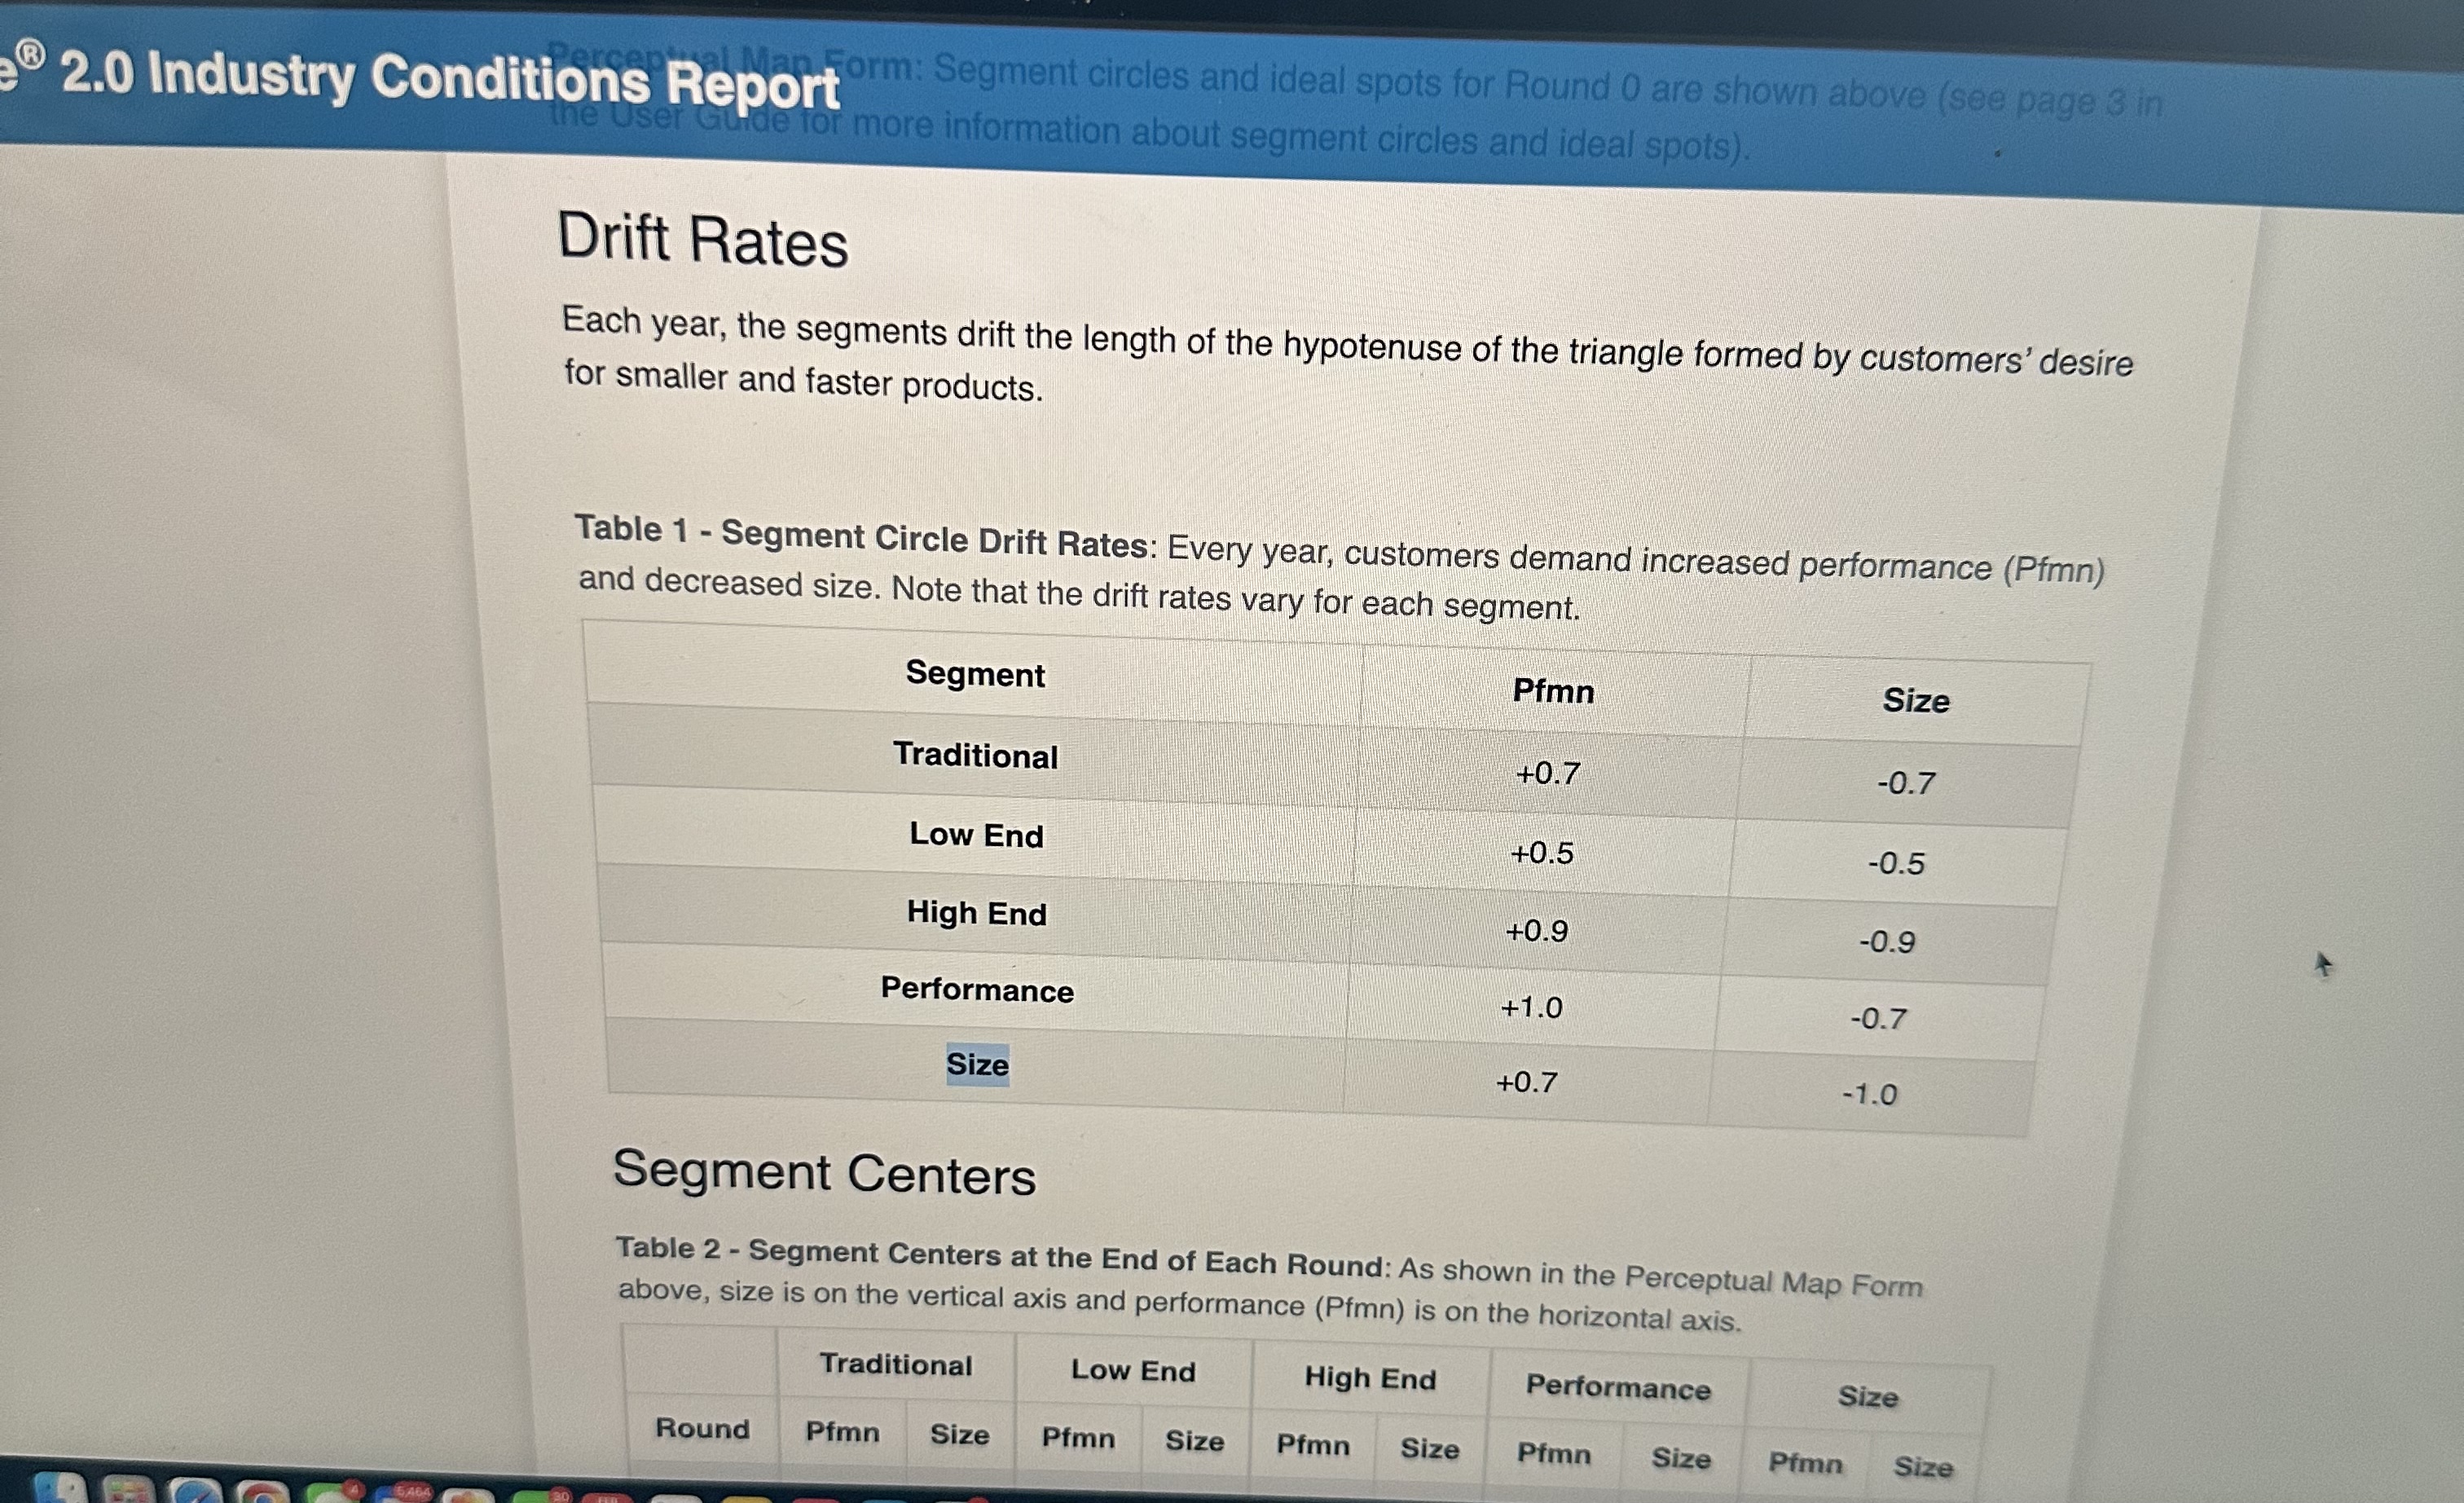
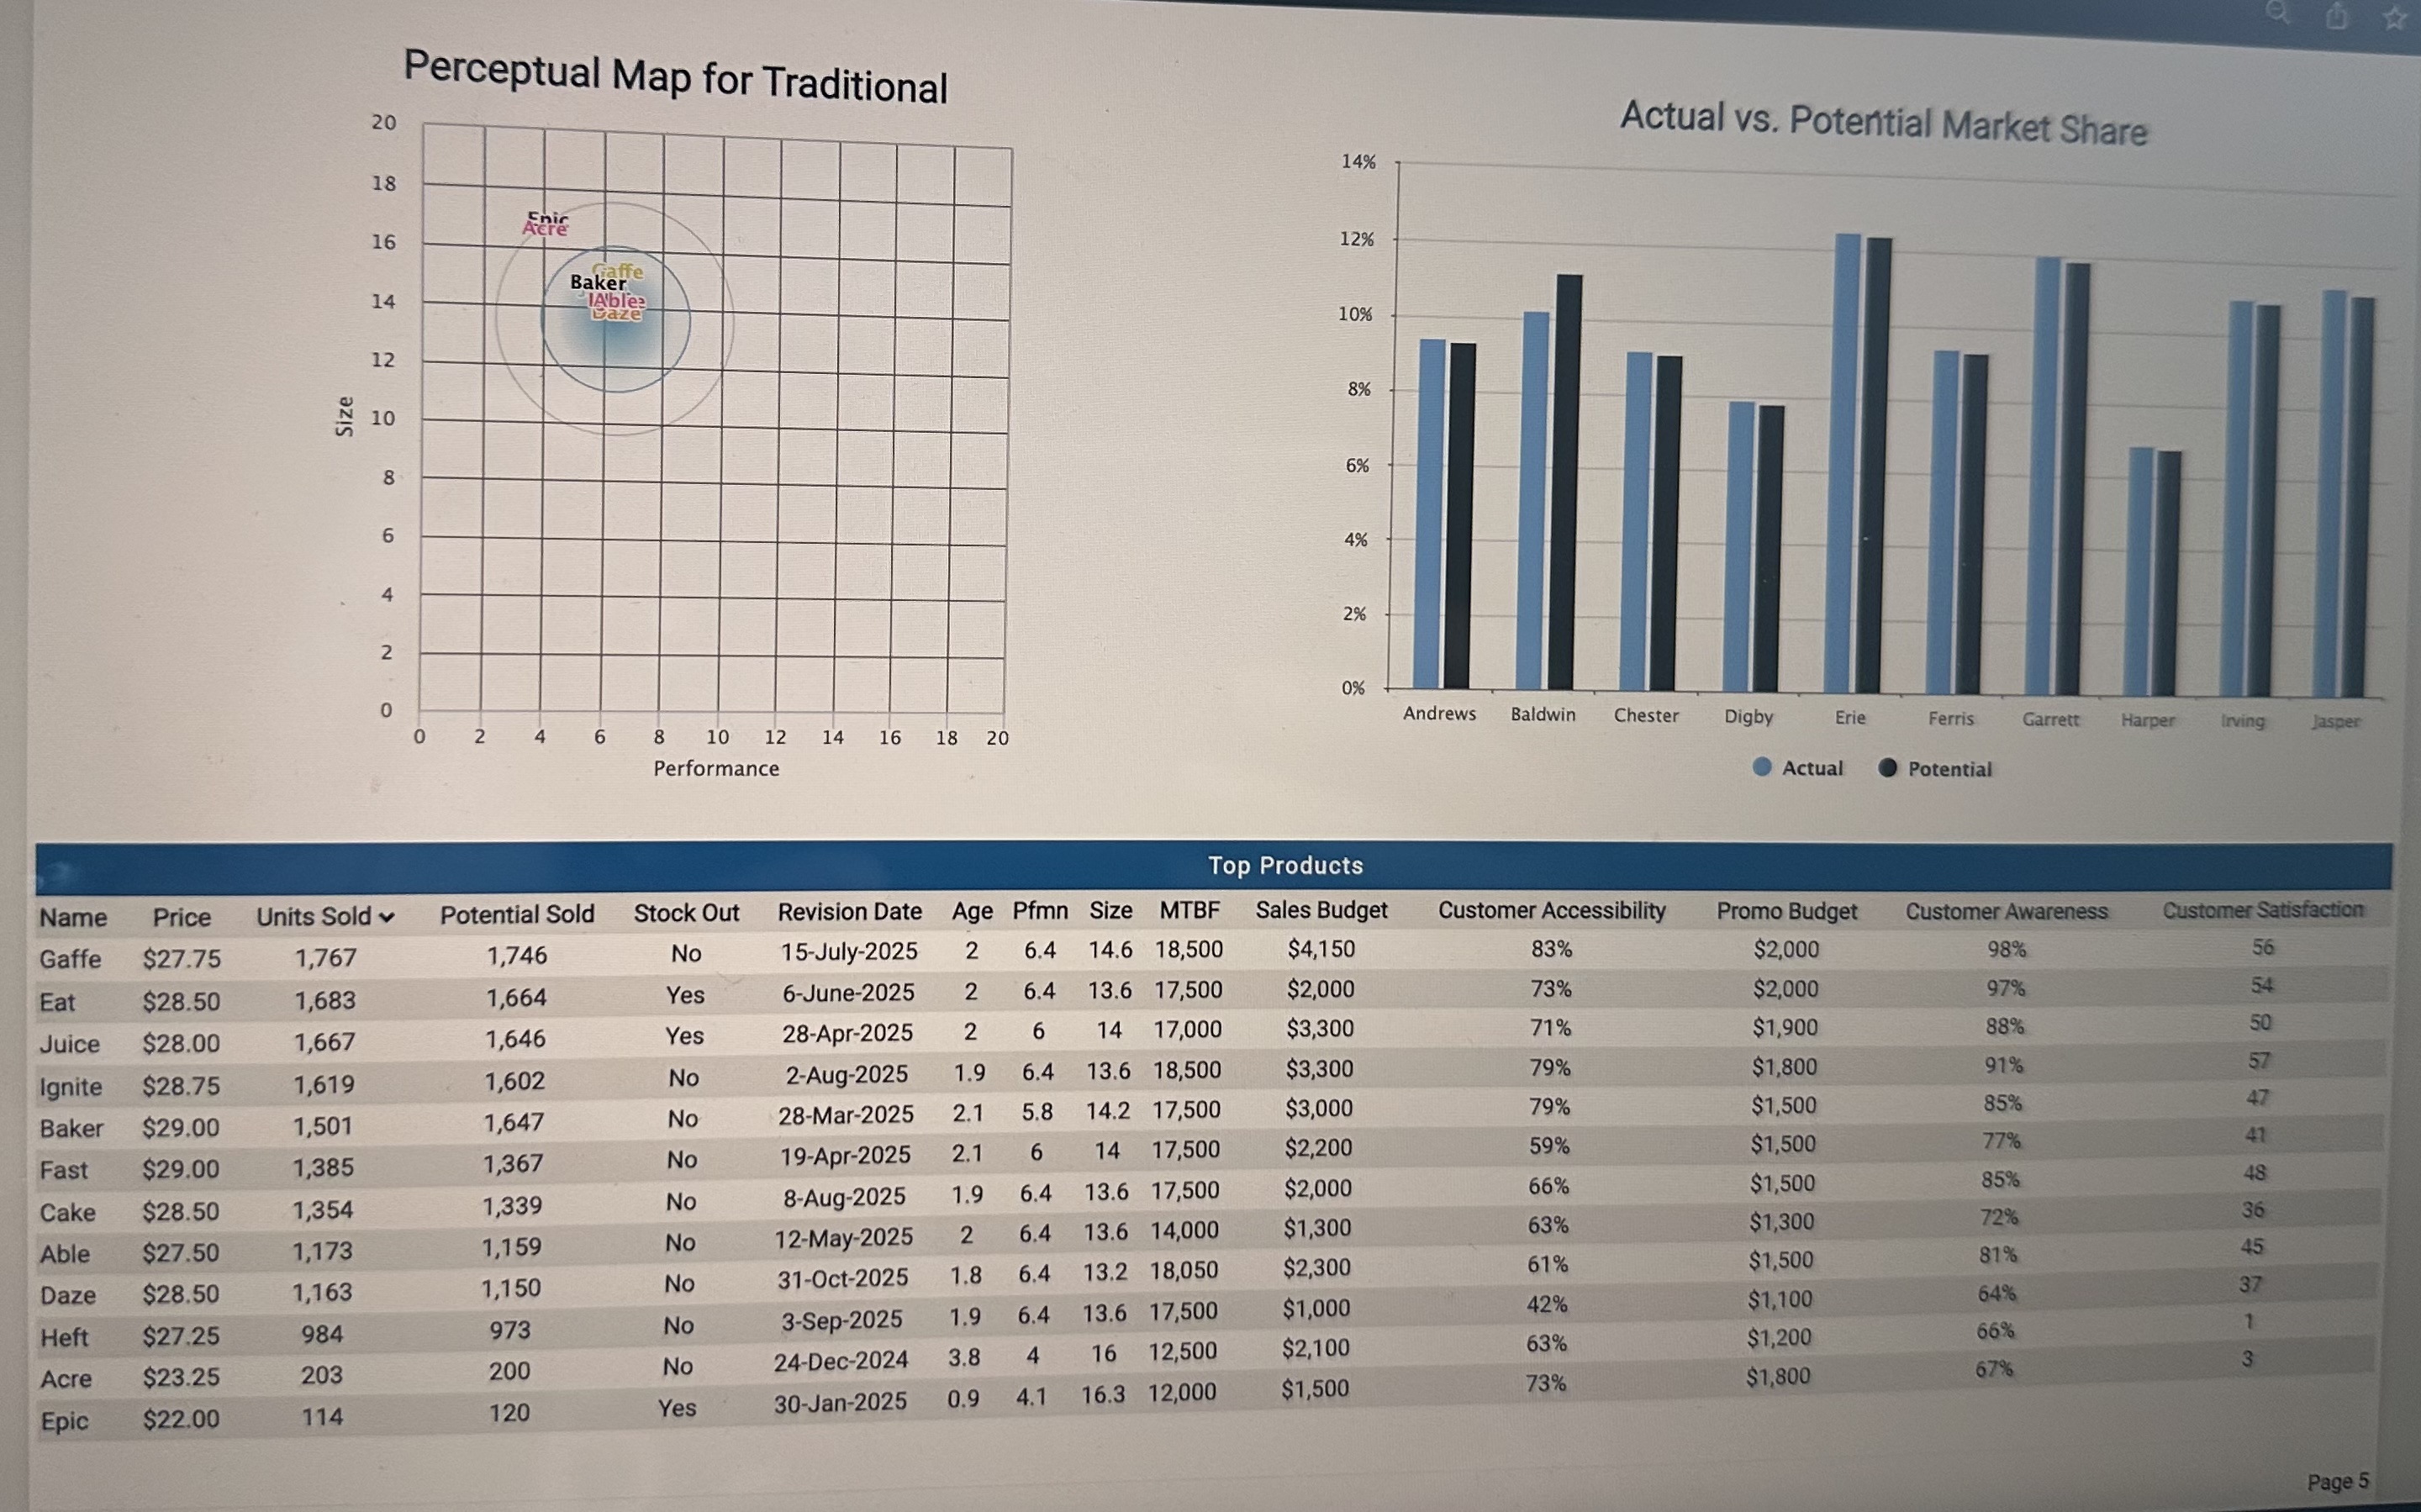
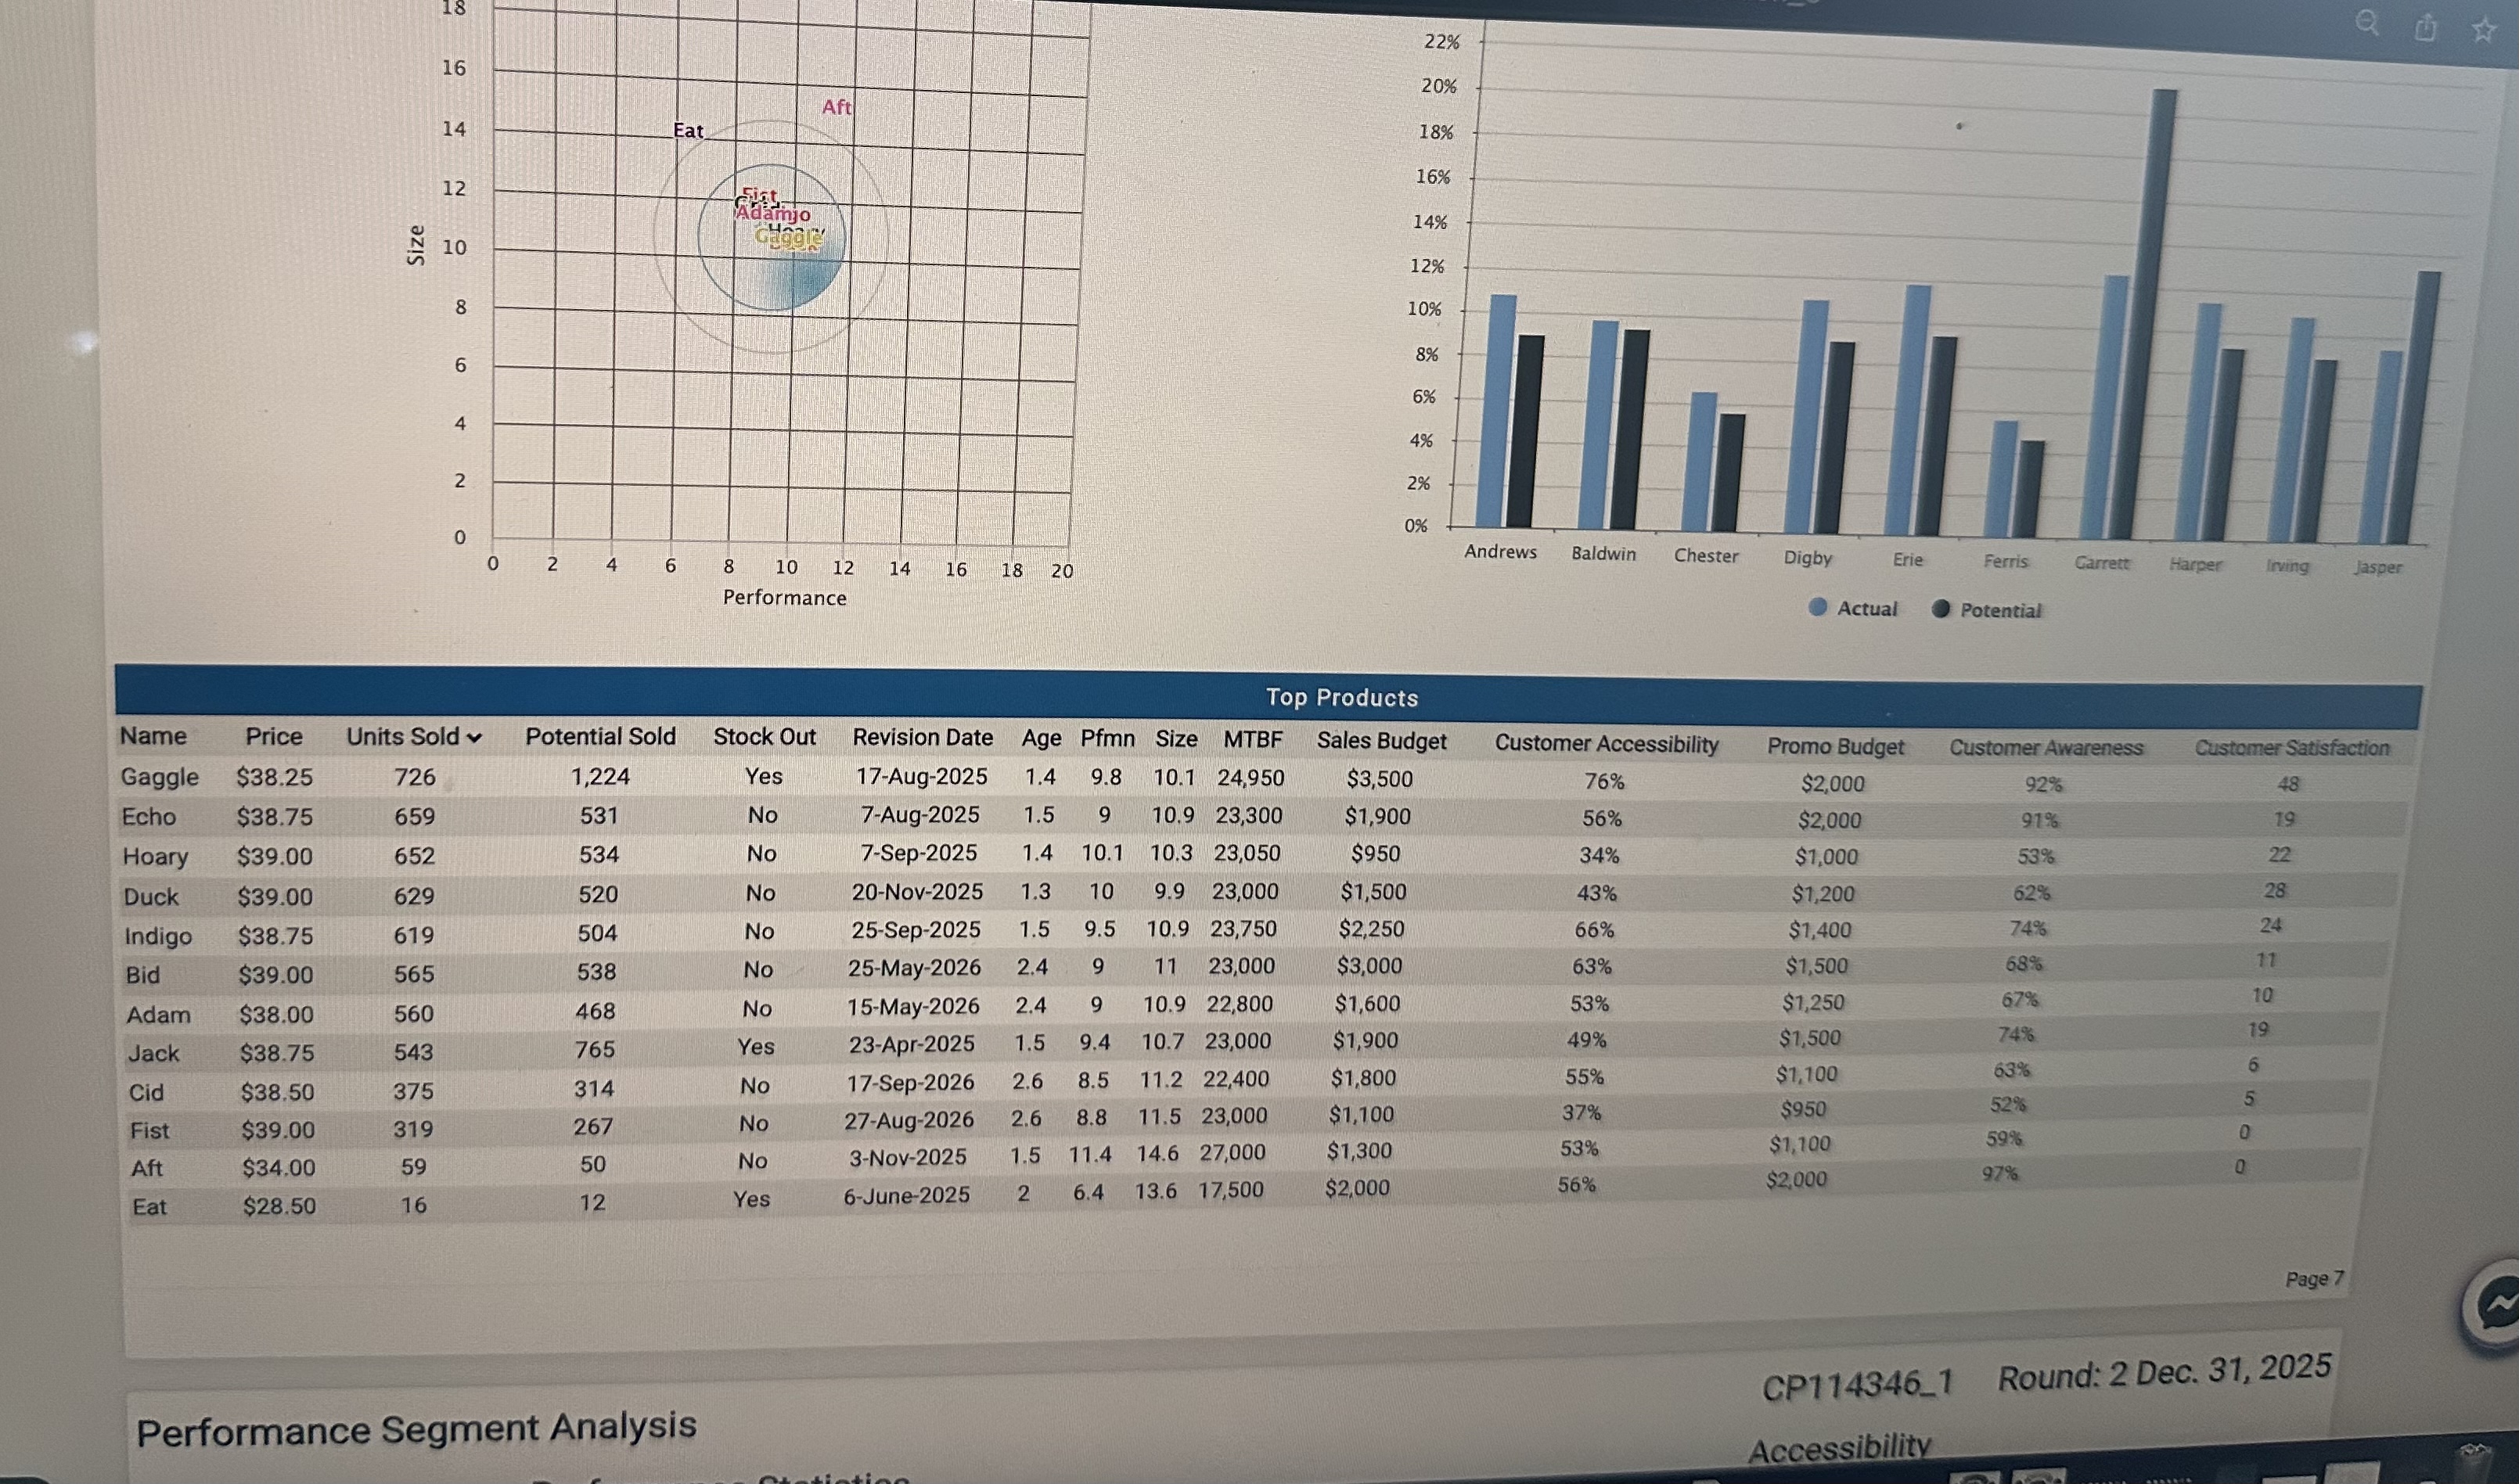
Perceptual Map for Size 20 Actual vs. Potential Market Share 24% 18 22% 16 20% 14 Eat 18% 16% 12 Cure 14% Buddy Size 10 12% HiAgape 8 10% 8% 6% A 4% 2% N 0% Andrews Baldwin Chester Digby Erie Ferris Garrett Harper Irving Jasper 8 10 12 14 16 18 20 Performance Actual Potential Top Products Name Price Units Sold v Potential Sold Stock Out Revision Date Age Pfmn Size MTBF Sales Budget Customer Accessibility Promo Budget Customer Awareness Customer Satisfaction Hamper $33.00 688 576 No 29-July-2025 1.6 5 8.6 19,000 $1,000 34% $1,000 56% 35 Just $34.00 660 759 Yes 21-May-2025 1.7 5 9 20,000 $1,950 47% $1,250 64% 42 Graft $34.00 616 992 Yes 24-Sep-2025 1.5 8.6 21,000 $3,000 64% $1,600 80% 67 395 No 13-May-2025 1.9 4.6 10.2 20,250 $1,800 52% $1,200 65% 19 lota $34.25 467 Buddy $34.00 453 401 No 27-Aug-2024 3 4.6 10 19,000 $2,000 51% $1,500 69% 11 5.4 8.6 19,500 $900 30% $900 45% 35 Dune $33.00 406 352 No 9-Dec-2025 1.5 323 No 9-Dec-2025 1.5 5.4 8.6 19,900 $1,500 36% $1,100 55% 33 Agape $34.75 373 16 $32.50 368 310 No 7-Apr-2025 2 4.1 10.6 21,000 $1,200 37% $1,200 58% Egg 9-Mar-2025 1.9 4.2 19,250 $900 30% $800 44% 12 Fume $34.00 358 309 No $800 46% 5 Cure $34.00 189 168 No 19-May-2026 3.2 4.5 10.7 19,000 $1,100 37% 81% 2 No 31-Oct-2025 1.8 6.4 13.2 18,050 $2,300 30% $1,500 Daze $28.50 17 12 $2,000 97% 6.4 13.6 17,500 $2,000 37% Eat $28.50 10 10 Yes 6-June-2025 2 Page 92.0 Industry Conditions Report Segment circles and ideal spots for Round 0 are shown above (see page 3 in for more information about segment circles and ideal spots). Drift Rates Each year, the segments drift the length of the hypotenuse of the triangle formed by customers' desire for smaller and faster products. Table 1 - Segment Circle Drift Rates: Every year, customers demand increased performance (Pfmn) and decreased size. Note that the drift rates vary for each segment. Segment Pfmn Size Traditional +0.7 -0.7 Low End +0.5 -0.5 High End +0.9 -0.9 Performance +1.0 0.7 Size +0.7 -1.0 Segment Centers Table 2 - Segment Centers at the End of Each Round: As shown in the Perceptual Map Form above, size is on the vertical axis and performance (Pfmn) is on the horizontal axis. Traditional Low End High End Performance Size Round Pfmn Size Pfmn Size Pfmn Size Pfmn Size Pimn SizePerceptual Map for Traditional 20 Actual vs. Potential Market Share 14% 18 16 Aare 12% jaffe Baker 14 IAblea 10% 12 8% Size 10 6% 00 4% 4 2% N 0% Andrews Baldwin 6 8 10 12 1 14 16 18 20 Chester Digby Erie Ferris Garrett Harper Irving Jasper Performance Actual Potential Top Products Name Price Units Sold v Potential Sold Stock Out Revision Date Age Pfmn Size MTBF Sales Budget Customer Accessibility Promo Budget Customer Awareness Customer Satisfaction Gaffe $27.75 1,767 1,746 No 15-July-2025 2 6.4 14.6 18,500 $4,150 83% $2,000 98% 56 Eat $28.50 1,683 1,664 Yes 6-June-2025 2 6.4 13.6 17,500 $2,000 73% $2,000 97% 54 Juice $28.00 1,667 1,646 Yes 28-Apr-2025 2 6 14 17,000 $3,300 71% $1,900 88% 50 Ignite $28.75 1,619 1,602 No 2-Aug-2025 1.9 6.4 13.6 18,500 $3,300 79% $1,800 91% 57 Baker $29.00 1,501 1,647 No 28-Mar-2025 2.1 5.8 14.2 17,500 $3,000 79% $1,500 85% 47 Fast $29.00 1,385 1,367 No 19-Apr-2025 2.1 6 14 17,500 $2,200 59% $1,500 77% 41 66% $1,500 85% 48 Cake $28.50 1,354 1,339 No 8-Aug-2025 1.9 6.4 13.6 17,500 $2,000 $27.50 1,173 1,159 No 12-May-2025 2 6.4 13.6 14,000 $1,300 63% $1,300 72% 36 Able 45 Daze $28.50 1,163 1,150 No 31-Oct-2025 1.8 6.4 13.2 18,050 $2,300 61% $1,500 81% $1,100 64% 37 Heft $27.25 984 973 No 3-Sep-2025 1.9 6.4 13.6 17,500 $1,000 42% 66% 200 No 24-Dec-2024 3.8 4 63% $1,200 Acre 203 16 12,500 $2, 100 $23.25 73% $1,800 67% Epic $22.00 114 120 Yes 30-Jan-2025 0.9 4.1 16.3 12,000 $1,500 Page 5If 22% 16 20% Aft 14 Eat 18% 16% 12 14% Gaggle Size 10 12% 8 10% 8% 6% A 4% 2% N 0% Andrews Baldwin Chester Digby Erie O 6 12 14 16 Ferris 8 10 18 Garrett Harper 20 Irving Jasper Performance Actual Potential Top Products Name Price Units Sold Potential Sold Stock Out Revision Date Age Pfmn Size MTBF Sales Budget Customer Accessibility Promo Budget Customer Awareness Customer Satisfaction Gaggle $38.25 726 1,224 Yes 17-Aug-2025 1.4 9.8 10.1 24,950 $3,500 76% $2,000 92% 48 Echo $38.75 659 531 No 7-Aug-2025 1.5 9 10.9 23,300 $1,900 56% $2,000 91% 19 Hoary $39.00 652 534 No 7-Sep-2025 1.4 10.1 10.3 23,050 $950 34% $1,000 53% 22 Duck $39.00 629 520 No 20-Nov-2025 1.3 10 9.9 23,000 $1,500 43% $1,200 62% 28 $38.75 619 504 No 25-Sep-2025 1.5 9.5 10.9 23,750 $2,250 66% $1,400 74% 24 Indigo 565 538 No 25-May-2026 2.4 9 11 23,000 $3,000 63% $1,500 68% 11 Bid $39.00 15-May-2026 2.4 9 10.9 22,800 $1,600 53% $1,250 67% 10 Adam $38.00 560 468 No 19 $38.75 543 765 Yes 23-Apr-2025 1.5 9.4 10.7 23,000 $1,900 49% $1,500 74% Jack 6 No 17-Sep-2026 2.6 8.5 11.2 22,400 $1,800 55% $1,100 63% Cid $38.50 375 314 37% $950 52% Fist $39.00 319 267 No 27-Aug-2026 2.6 8.8 11.5 23,000 $1,100 $1,100 59% $1,300 53% Aft $34.00 59 50 No 3-Nov-2025 1.5 11.4 14.6 27,000 6.4 13.6 17,500 $2,000 56% $2,000 97% 16 12 6-June-2025 2 Eat $28.50 Yes Page 7 CP114346_1 Round: 2 Dec. 31, 2025 Performance Segment Analysis AccessibilityCAPSTONE 20 Industry ID: CP114346_1 | Round: 3 (2026) R & D Marketing Production Finance Reports . Alerts File - Exit # Production Schedule Juice Jump Jack Jordan Just Unit Sales Forecast: @ 1,400 Inventory on Hand: 0 Production After Adj: @ 1,312 Plant Utilization 76% Production Schedule 1325 0 3500 Modify Plant Juice Jump Jack Jordan Just 1750 Total (in 000's) Capacity 0 6000 SO 4.5 Automation SO 0 10 Plant Investments Juice Jump Jack Jordan Just Total (in 000's) SO SO SO SO SO SO Max Investments $37,544 Margins Juice Jump Jack Jordan Just 2nd Shift Production% 0% 0% 0% 0% 0% $8.37 $7.73 $10.31 $10.31 $10.31 Labor Cost/Unit $14.44 $14.92 $12.88 Material Cost/Unit $9.63 $5.44 $13.17 $24.75 $25.23 $23.19 Total Variable Cost $18.00 36.1% 31.8% Contribution Margin 35.7% 42.7% 24.7%Perceptual Map for Low End 20 Actual vs. Potential Market Share 18 Bead 18% Acre 16 16% 14 Heft 14% 12 12% 10% Size 10 8% 00 6% 4% A 2% N 0% Andrews Baldwin 8 10 12 14 16 Chester Digby 18 Erie 20 Ferris Garrett Harper living Jasper Performance Actual Potential Top Products Name Price Units Sold Potential Sold Stock Out Revision Date Age Pfmn Size MTBF Sales Budget Customer Accessibility Promo Budget Customer Awareness Customer Satisfaction Irate $21.25 2,828 2,751 Yes 8-Jan-2025 6.6 3 17 14,500 $2,200 57% $1,450 78% 27 Ebb $20.75 2,457 2,166 No 11-Apr-2024 4.2 3 16.9 12,900 $2,700 65% $2,300 99% 23 Gerbil $21.25 2,128 2,987 Yes 14-Jan-2025 6.6 3 17 14,500 $2,100 60% $1,900 91% 29 Hue $18.75 2,032 2,544 No 27-Oct-2025 3.4 3.8 16.2 14,000 $1,250 39% $1,050 59% 13 Jump $23,00 1,913 1,687 No 14-Jan-2025 6.6 3 17 12,050 $2,000 48% $1,900 81% 17 Cedar $20.75 1,730 1,529 No 22-July-2025 2.2 2.7 17.3 14,000 $1,500 44% $1,100 64% 12 13 Dell $20.00 1,656 1,463 No 14-May-2025 2.3 2.7 17.5 13,050 $1,400 36% $1,200 59% 12 Bead $23.00 1,637 1,451 No 25-May-2025 3.6 17.3 12,000 $3,000 71% $1,500 83% 57% 11 Feat $21.00 1,343 1,187 No 4-May-2025 2.4 2.8 17.2 15,000 $1,100 31% $1,000 $1,200 66% 4 51% Acre $23.25 434 383 No 24-Dec-2024 3.8 4 16 12,500 $2,100 $1,800 67% 65% Epic $22.00 402 Yes 30-Jan-2025 4.1 16.3 12,000 $1,500 381 0.9 39% $1,100 64% 28 6.4 13.6 17,500 Heft No 1.9 $1,000 $27.25 32 3-Sep-2025 Page o5% 00 4% 2% N 0% 0 Andrews Baldwin Chester Digby Erie Ferris Garrett Harper irving Jasper 6 8 10 12 14 16 18 20 Performance Actual Potential Top Products Name Price Units Sold v Potential Sold Stock Out Revision Date Age Pfmn Size MTBF Sales Budget Customer Accessibility Promo Budget Customer Awareness Customer Satisfaction Gaffe $27.75 1,767 1,746 No 15-July-2025 6.4 14.6 18,500 $4,150 83% $2,000 98% 56 EN Eat $28.50 1,683 1,664 Yes 6-June-2025 6.4 13.6 17,500 $2,000 73% $2,000 97% 54 Juice $28.00 1,667 1,646 Yes 28-Apr-2025 2 6 14 17,000 $3,300 71% $1,900 88% 50 Ignite $28.75 1,619 1,602 No 2-Aug-2025 1.9 6.4 13.6 18,500 $3,300 79% $1,800 91% 57 Baker $29.00 1,501 1,647 No 28-Mar-2025 2.1 5.8 14.2 17,500 $3,000 79% $1,500 85% 47 Fast $29.00 1,385 1,367 No 19-Apr-2025 2.1 6 14 17,500 $2,200 59% $1,500 77% 41 Cake $28.50 1,354 1,339 No 8-Aug-2025 1.9 6.4 13.6 17,500 $2,000 66% $1,500 85% 48 63% $1,300 72% 36 Able $27.50 1,173 1,159 No 12-May-2025 2 6.4 13.6 14,000 $1,300 1,150 No 31-Oct-2025 1.8 6.4 13.2 18,050 $2,300 61% $1,500 81% 45 Daze $28.50 1,163 973 No 3-Sep-2025 1.9 6.4 13.6 17,500 $1,000 42% $1,100 64% 37 Heft $27.25 984 4 16 12,500 $2,100 63% $1,200 66% Acre $23.25 203 200 No 24-Dec-2024 3.8 30-Jan-2025 0.9 4.1 16.3 12,000 $1,500 $1,800 67% Epic $22.00 114 Yes 73% 120 Page 5 CP114346_1 Round: 2 Dec. 31, 2025 Low End Segment Analysis Accessibility Low End Statistics 18,633 Andrews 2025 Total Market Size 18,633 2025 Total Units Sold 38.2% Baldwin Segment % of Total Industry 11.7% ChesterTraditional Segment Analysis CP114346_1 Round: 2 Dec. 31, 2025 Traditional Statistics Accessibility 2025 Total Market Size 14,682 2025 Total Units Sold Andrews 14,682 Segment % of Total Industry 29.4% Baldwin 2026 Demand Growth Rate 9.2% Chester Digby Traditional Customer Buying Criteria Erie Expectations Importance Ferris Age 2 Years 47% Price $19.00 - $29.00 23% Garrett Positioning Performance 6.4 Size 13.6 21% Harper MTBF 14,000 - 19,000 Hours 9% Irving Jasper 40% 60% 80%% 1009% 0% 20% Accessibility Actual vs. Potential Market Share Perceptual Map for Traditional 14% 20 12% 16 10% Baker IAblea 14 8% 12 6% Size 10 4% 2% Irving Jasperyaround=2&teamName=Jasper&teamKey=3381335#section_5 Performance Segment Analysis CP114346_1 Round: 2 Dec. Performance Statistics Accessibility 2025 Total Market Size 4,581 2025 Total Units Sold Andrews 4,581 Segment % of Total Industry 10.1% Baldwin 2026 Demand Growth Rate 19.8% Chester Digby Performance Customer Buying Criteria Erie Expectations Importance Ferris MTBF 22,000 - 27,000 Hours 43% Garrett Positioning Performance 11.4 Size 14.6 29% Price $24.00 - $34.00 19% Harper Age 1 Years 9% Irving Jasper 80%% 0% 20% 40% Accessibility Actual vs. Potential Market Share Perceptual Map for Performance 18% 20 16% 18 14% 16 Caffe 12% 14 10% 12 8% N 10 6% 00 496 2% Jasper A Harper Ferris Garrett living Digby Erie Andrews Baldwin Chester NFinance Cash from Financing (in 000's) Policy Lag Raise Capital Spend Capital 0 da 31 days Accounts Current Debt Receivable 0 days 140 days so Borrow: so $29,800 Due This Year $14,550 0 da 30 days Accounts Payable 0 days 140 days Interest Rate: 10.6% 2025 Emergency Loan SO Other $14,550 Cash Flow Starting Cash Position Long-Term Debt (Bonds) January 1, 2026 $23,129 SO SO Issue (Borrow): SO $20,700 Retire: SO $43,400 Cash from Operating $17,196 >Cash from Investing SO Interest Rate: 12% > Cash from Financing ($14,550) Common Stock SO SO Closing Cash Position Issue Stock: SO $16,700 Buy Back: SO $4,100 December 31, 2026 $25,775 Projected Stock Price: $51.32 $0.00 Liabilities and Owner's Equity $3.55 Issue Dividend: $0.00 $4.70 Projected Earnings per Share: Shares Outstanding: 2,106 Total Raised Capital: $0 Total Spent Capital: $0 Outstanding BondsFeat 0% 7.2% 0% 0% 0% 2.8% Feat 0% Fist 6.4% 0% 0% 0% 0% 5.6% 0% 2.5% 0% 0% 0.7% Fist 0% 0% Foam 4.7% 0% 0% 0% 0% 0% 0.6% 8.3% 0% 0.8% Foam 0% 0% 0% Fume 7.8% 0% 0% 0.7% 0% 0% 7.7% 0.7% Fume 0% 0% 0% 0% Total 6.7% 9.4% 0.6% 7.2% 5.6% 8.3% 7.8% 7.9% Total 9.3% 6.4% 4.7% 7.8% 6.8% 7.2% Gaffe 12% 0.2% 0% 0.1% 0% 3.7% Gaffe 11.9% 0.1% 0% 0.1% 0% 3.7% Gaggle 0% 0% 12.6% 0% 0% 1.5% Gaggle 0% 0% 21.3% 0% 0% 2.5% Gerbil 0% 11.4% 0% 0% 0% 4.4% Gerbil 0% 16% 0% 0% 0% 6.2% Goose 0% 0% 0% 14.3% 0% 1.4% Goose 0% 0% 0% 15.8% 0% 1.5% Graft 0% 0% 0% 0% 13.3% 1.3% Graft 0% 0% 0% 0% 21.4% 2.1% Total 12% 11.6% 12.6% 14.4% 13.3% 12.3% Total 11.9% 16.2% 21.3% 15.9% 21.5% 16% Hamper 0% 0% 0% 0% 14.9% 1.4% Hamper 0% 0% 0% 0% 12.5% 1.2% Heft 6.7% 0.2% 0% 0% 0.1% 2.1% Heft 6.6% 0.2% 0% 0% 0.1% 2.1% Hilt 0% 0% 0% 7.7% 0% 0.7% Hilt 0% 0% 0% 7.3% 0% 0.7% 0% 0% 11.4% 0% 0% 1.4% Hoary 0% 0% 9.3% 0% 0% 1.1% Hoary 0.2% 10.9% 0% 0% 0% 4.3% Hue 0.2% 13.7% 0% 0% 0% 5.3% Hue 11.1% 11.4% 7.7% 14.9% 9.9% Total 6.8% 13.8% 9.3% 7.3% 12.5% 10.4% Total 6.9% 3.3% 3.4% Ignite 10.9% 0% 0.1% 0% 0.1% Ignite 11% 0% 0.1% 0% 0.1% 1.3% Indigo 0% 0% 8.8% 0% 0% 1% Indigo 0% 0% 10.8% 0% 0% 0% 1.1% 0% 0% 0% 11.9% 0% 1.1% Invert 0% 0% 0% 11.1% Invert 0% 0% 0% 0% 8.5% 0.8% lota 0% 0% 10.1% 1% lota 0% 0% 5.7% 0% 0% 5.9% Irate 0% 14.8% 0% 0% 0% 0% 15.2% 0% irate 10.9% 14.8% 8.9% 11.1% 8.6% 12% 11% 11.9% 10.2% Total Total 15.2% 10.9% 12.6% 13.3% 0% 0% 1.6% 9.4% 0% 0% 1.1% Jack 0% 0% 0% 0% 0% 11.8% 0% 1.19 Jack 12.6% Jordan 0% 0% 1.2% 0% 0% 0.1% 3.49 Jordan 0% 0% 0.1% 0% 0% 0% 0.1% 3.5% Juice 11.2% 0% 0% 0% 3.5% 11.4% 0.1% 0% 9.1% 0% Juice 0% 4% Jump 10.3% 0% 0% 0% 0% 16.4% 1.6% Jump 0% 0% 0% 14.3% 1.4% Just 16.4% 11.2% 0% 0% 0% 0% 13.3% Just 14.3% 11.2% 9.1% 11.8% 11.1% Total Total 11.4% 10.3% 9.5% 12.6%R & D Marketing Production Finance Reports - Alerts 0 Proforma Balanced Scorecard Ratios Cash Flow Income Statement Balance Sheet Assets Liabilities & Owner's Equity Current Assets Liabilities Cash $25,775 22.4% Accounts Payable $6,777 5.9% Accounts Receivable $10,853 9.4% Current Borrowing SO 0.0% Inventories $8, 107 7.1% Emergency Loan SO 0.0% Total Current Assets $44,735 38.9% Maturing Long-Term Debt SO 0.0% Long-Term Debt $42,250 36.8% Fixed Assets $129,000 112.3% Total Liabilities $49,027 42.7% Plant & Equipment 18.2% Accumulated Depreciation ($58,853) -51.2% Common Stock $20,860 $44,995 39.2% Total Fixed Assets $70,147 61.1% Retained Earnings $65,855 57.3% TOTAL ASSETS $114,881 100.0% Total Equity TOTAL LIABILITIES AND OWNER'S EQUITY $114881 100.0% ChatsDecision Summary Product Name Juice Jump Jack Jordan Just Research & Development Performance 3 9.4 10.9 Size 14 17 10.7 15 Reliability 17,000 12,050 23,000 27,000 20,000 Marketing Pric $28.00 $23.00 $38.75 $33.50 $34.00 Promo Budget $1,900 $1,900 $1,500 $1,100 $1,250 Sales Budget $3,300 $2,000 $1,900 $1,600 $1,950 700 Unit Sales Forecast 1400 1900 450 550 Production 1,325 2,000 425 550 375 Production Order 150 Capacity Change 0 600 50 -50 5.0 3.0 3.0 3.0 Automation Next Round 4.5 Finance $2,500 Stock Issue SO Stock Retire $0.00 Dividend $7,600 Current Debt $7,500 Bond Issue SO Bond Retire 30 Accounts Payable 31 Accounts ReceivableResearch & Development Products Perceptual Map Juice Jump Jack Jordan Just New Product 20 18 Performance 16 0 20 14 Size 14 12 0 20 N 10 MTBF 17,000 8 6 10,000 27,000 Revision Date Age at Revision Material Cost / Unit 2 $9.63 0 2 4 6 8 10 12 14 16 18 20 R&D Costs Performance Juice Jump Jack Jordan Just Total SO SO SO SO SO SO Age Profile Customer Buying Criteria Traditional Low End High End Performance Size Years OHNWAVION DO Perceived Age in Expectations Importance Age 2 Years 47% Price $18.50 - $28.50 23% Ideal Position Pfmn 7.1, Size 12.9 21% Juice + Jump Jack Jordan Reliability 14,000 - 19,000 MTBF Hours 9% Just Material Cost 9.63 Juice 10.13 Chats 5.44Perceptual Map for Performance Actual vs. Potential Market Share 20 18% 18 16% 16 Goatam Caffe In FAR 14% 14 12% 12 10% 10 8% 8 6% 6 4% A 2% N 0% Andrews Baldwin Chester Digby Erie Ferris Garrett Harper Irving Jasper 8 10 12 14 16 18 20 Performance Actual Potential Top Products Name Price Units Sold v Potential Sold Stock Out Revision Date Age Pfmn Size MTBF Sales Budget Customer Accessibility Promo Budget Customer Awareness Customer Satisfaction 48 Goose $34.00 657 724 Yes 23-Sep-2025 1.6 11.4 14.6 27,000 $2,650 59% $1,350 71% 737 Yes 2-Sep-2025 1.6 11.4 14.6 27,000 $3,000 58% $1,500 73% 49 Bold $34.00 594 59% 36 Jordan $33.50 579 542 No 12-May-2025 1.8 10.9 15 27,000 $1,600 38% $1,100 No 8-Sep-2025 1.7 10.7 14.9 27,000 $2,000 52% $1,350 71% 42 Invert $33.75 544 510 33% $1,200 63% 25 Edge $33.50 488 457 No 5-Apr-2025 2.6 9.8 15.2 27,000 $1,200 27% $900 47% 20 Foam 380 356 No 24-Mar-2025 1.9 10.3 15.3 26,000 $1,000 $34.00 $1,400 $1,000 56% 16 40% Coat $34.00 354 332 No 12-Apr-2026 9.4 15.3 26,100 $900 47% 29 24% Hilt $34.00 354 332 No 15-Oct-2025 1.6 11.6 14.6 27,000 $700 34 3-Nov-2025 1.5 11.4 14.6 27,000 $1,300 36% $1,100 59% Aft $34.00 319 299 No $950 46% 25 Dot $34.00 306 287 No 11-Dec-2025 1.6 11.4 14.6 26,000 $950 27% 59% $2,000 98% $27.75 6.4 14.6 18,500 $4,150 Gaffe 5 No 15-July-2025 2 Page 8Low End Segment Analysis CP114346_1 Round: 2 Dec. 31, 2025 Low End Statistics Accessibility 2025 Total Market Size 18,633 2025 Total Units Sold Andrews 18,633 Segment % of Total Industry 38.2% Baldwin 2026 Demand Growth Rate 11.7% Chester Digby Low End Customer Buying Criteria Erie Expectations Importance Ferris Price $14.00 - $24.00 53% Age 7 Years 24% Garrett Positioning Performance 2.7 Size 17.3 16% Harper MTBF 12,000 - 17,000 Hours 7% Irving Jasper 0% 20% 40% 60% 80% 100% Accessibility Actual vs. Potential Market Share Perceptual Map for Low End 18% 20 16% 18 Bead Acre 14% 16 Heft 12% 14 10% 12 8% N 10 6% 4% 2% A Erie Ferris Garrett Harper Irving Jasper 0% Digby Andrews Baldwin ChesterAlerts 0 Proforma Balanced Scorecard Ratios Cash Flow Income Statement Balance Sheet Income Statement Revenue Juice Jump Jack Jordan Just Total Percent of Revenue Sales $36,730 $43,700 $16,304 $18,425 $12,623 $127,782 100.0% VARIABLE COSTS Direct Labor $10,983 $14,694 $4,336 $5,481 $3,826 $39,321 30.8% Direct Material $12,630 $10,380 $6,077 $8,328 $4,782 $42, 197 33.0% Inventory Carry so $233 so $740 SO $973 0.8% Total Variable Costs $23,613 $25,307 $10,413 $14,550 $8,608 $82,491 64.6% Contribution Margin $13, 116 $18,393 $5,891 $3,875 $4,015 $45,291 35.4% PERIOD COSTS Depreciation $2,800 $3,640 $660 $660 $840 $8,600 6.7% SG&A: SO SO SO so SO 0.0% R&D $1,900 $1,500 $1,100 $7,650 5.0% $1,900 $1,250 Promotion $10,750 8.4% Sales $3,300 $2,000 $1,900 $1,600 $1,950 0.8% $302 $359 $134 $151 $104 $1,050 Admin $4,194 $3,511 $4,144 $28,050 22.0% Total Period Costs $8,302 $7,899 ($129) $4,814 $10,494 $1,697 $364 $17,241 13.5% Net Margin Other (Fees, Write Offs) $0 0.0% EBIT $17,241 13.5% Interest $5,519 4.3% Taxes $4,103 3.2% Profit Sharing $152 0. 1% Net Profit $7,467 5.8%High End Segment Analysis CP114346_1 Round: 2 Dec. 31, 2025 High End Statistics Accessibility 2025 Total Market Size 5,747 2025 Total Units Sold Andrews 5,747 Segment % of Total Industry 12.3% Baldwin 2026 Demand Growth Rate 16.2% Chester Digby High End Customer Buying Criteria Erie Expectations Importance Ferris Positioning Performance 10.7 Size 9.3 13% 0 Years 29% Garrett Age 20,000 - 25,000 Hours 19% Harper MTBF $29.00 - $39.00 9% Price rving Jasper 80% 0% 20% 40% 60% 100% Accessibility Actual vs. Potential Market Share Perceptual Map for High End 24% 20 2 2% 20% 18 18% 16 Aft 16% Eat 14 14% 12 Adathjo 12% 10% N 10 8% 00 6% 4% Irving Jasper Ferris Garrett Harper A 0% Digby ErieIndustry Unit Sales Total Unit Demand Traditional Low End High End . Performance Size Actual Market Share in Units Potential Market Share in Units Name Traditional Low End High End Performance Size Total Name Traditional Low End High End Performance Size Total Industry Unit Sales 14,682 18,633 5,747 4,581 4,627 48,269 Units Demanded 14,682 18,633 5,747 4,581 4.627 48,269 % of Market 30.4% 38.6% 11.9% 9.5% 9.6% 100% % of Market 30.4% 38.6% 11.9% 9.5% 9.6% 100% Able 8% 0% 0% 0% 0.1% 2.4% ble 7.9% 0% 0% 0% 0.1% 2.4% Acre 1.4% 2.3% 0% 0% 0% 1.3% Acre 1.4% 2.1% 0% 0% 0% 1.2% Adam 0% 0% 9.8% 0% 0% 1.2% Adam 0% 0% 8.1% 0% 10% 1% Aft 0% 0% 1% 7% 0% 0.8% Aft 0% 0% 0.9% 6.5% 0% 0.7% 0% 0% 0% 0% B.1% 0.8% Agape 0% 0% 0% 0% 7% 0.7% Agape 2.3% 10.8% 7% 8.2% 6.5% Total 9.3% 2.1% 9% 6.5% 7.1% 6% Total 9.4% 0% 0% 0% 0% 3.4% Baker 10.2% 0% 0% 0% 0% 3.1% Baker 11.2% 0% 0% 3% Bead 0% 8.8% 0% 0% 0% 3.4% Bead 0% 7.8% 0% 0% 0% 9.4% 0% 0% 1.1% 0% 9.8% 0% 0% 1.2% Bid Bid 0% 13% 0% 1.2% Bold 0% 0% 0% 16.1% 0% 1.5% Bold 0% 0% 0% 0% 0% 0% 0% 8.7% 0.8% Buddy 0% 0% 0% 0% 9.80 0.9% Buddy 9.9% 9.8% 9.8% Total 11.2% 7.8% 9.4% 16.1% 8.7% 9.8% Tota 10.2% 8.8% 13% Cake 9.1% 0% 0.1% 0% 0% 2.8% 2.8% 9.2% 0% 0.1% 0% 0% 0% 0% 0% 3.2% Cake 0% 8.2% 9.3% 0% 0% 0% 3.6% Cedar 0% 0% 10.7% Cedar 0% 0% 0% 5.5% 5.5% 0% 0% 0.8% Cid 0% 7.2% 0% 0.7% 0% Cid 0% 7.7% 0% 0.7% Coat 0% 0% 0% 0% 0% 0% 3.6% 10.3% 0% 0% Coat 0% 0% 4.1% 0.4% Cure 0% 9.1% 5.6% 3.7% 0% 8.2% 7.3% 7.7% Cure 0% 2:4% 9.3% 6.6% 7.7% 4.1% 8.3% Total 0.1% 0% 0.3% Total 9.2% 0% 0% 0.4% 2.5% Daze 7.8% 0% 0% 3% 7.9% 0.1% ).1% Dell 0% 7.9% 0% Daze 0% 0% 3.4% 6.3% 0% 0.6 0% 0% 0% 8.9% Dell Dot 0% 0% 6.7% 0% 0.6% 9.1% 0% 0% 1.1% 0% 0% 0% 0% 0% 1.3% 0% 0% 0.7% Dot 0% Duck 0% 7.6% 0% 0% 11% 0% Dune 6.3% 7.9% 7.9% Duck 0% 8.8% 0.8% 0% 0% 7.8% 7.9% 9.1% 0.2% 3.5% 0% 0% Dune 6.79 9.1% 8.7% Total 0% 0.2% 0% 7.9% 8.9% 11% 11.3% 3.5% Eat 10% 0% 0% 4.5% Total 0% 0.2% 0% 11.6% 0% 1.1% 0% 0.3% 11.5% 0% 5.1% Ebb 0% 9.2% 0% Eat 10% 0% 1% 0% 13.2% 0% 0% 0% 1.4% Echo 0% 0% 0% 10% Ebb 5.7% 0.7% 0% 0% 11.5% 0% 1% Edge 0% Echo 10.6% 0% 0.2% 0% 1. 7% 0% 0% 0% 0% 0% 0.8% Egg 2.2% 0% 6.92 17.8% Edge 10% 0% 0% 8% 0.8% 0.2% 0% 1% Epic 13.8% 9.5% 2.8% 0% 0% 12.4% 10% 0.1% Egg 2% 0% 8.2% 12.9% Total 9.3% 0% 0% 0.8% Epic 15.2% 11.8% 10.7% 12.5% Fast Total 0% 0.1% 2.9% 9.4% 0% 0% Fast NGSSize Segment Analysis CP114346_1 Round: 2 Dec. 31, 2025 Size Statistics Accessibility 2025 Total Market Size 4,627 2025 Total Units Sold Andrews 4,627 Segment % of Total Industry 10% Baldwin 2026 Demand Growth Rate 18.3% Chester Digby Size Customer Buying Criteria Erie Expectations Importance Ferris Positioning Performance 5.4 Size 8.6 43% Age 1.5 Years 29% Garrett MTBF 16,000 - 21,000 Hours 19% Harper Price $24.00 - $34.00 9% Irving Jasper 0% 20% 40% 60% 809% 100% Accessibility Perceptual Map for Size Actual vs. Potential Market Share 24% 20 22% 18 2 0% 16 18% 16% 14 Fat 14% 12 EGure 12% Buddy N 10 10% HiAgape 8% 00 6% 4% A 2% Irving Jasper 0% Ferris Garrett Harper Andrews Baldwin Chester Digby Erie2.0 Industry Conditions Report Size 40.7 1.0 Segment Centers Table 2 - Segment Centers at the End of Each Round: As shown in the Perceptual Map Form above, size is on the vertical axis and performance (Pfmn) is on the horizontal axis. Traditional Low End High End Performance Size Round Pfmn Size Pfmn Size Pfmn Size Pfmn Size Pfmn Size 0 5.0 15.0 2.5 17.5 7.5 12.5 8.0 17.0 3.0 12.0 5.7 14.3 3.0 17.0 8.4 11.6 9.0 16.3 3.7 11.0 2 6.4 13.6 3.5 16.5 9.3 10.7 10.0 15.6 4.4 10.0 3 7.1 12.9 4.0 16.0 10.2 9.8 11.0 14.9 5.1 9.0 4 7.8 12.2 4.5 15.5 11.1 8.9 12.0 14.2 5.8 8.0 5 8.5 11.5 5.0 15.0 12.0 8.0 13.0 13.5 6.5 7.0 6 9.2 10.8 5.5 14.5 12.9 7.1 14.0 12.8 7.2 6.0 7 9.9 10.1 6.0 14.0 13.8 6.2 15.0 12.1 7.9 5.0 8 10.6 9.4 6.5 13.5 14.7 5.3 16.0 11.4 8.6 4.0 The information in Table 2 reflects the segment centers at the end of the round. Therefore, the Round 0 positions can be seen as the Round 1 starting positions, Round 2 positions can be seen as the Round 3 starting position, etc. Each month during the simulation year, the segment drifts 1/12th of the 6464Proforma Balanced Scorecard Ratios Cash Flow Income Statement Balance Sheet Ratios Return On Sales (ROS) or "Profitability" = Profit/Sales 5.8% Asset Turnover or "Turnover" = Sales/Assets 1.1 Return On Assets (ROA) = Profitability * Turnover 6.5% Leverage = Assets/Equity 1.7 Return on Equity (ROE) = Profit/Equity 11.3% Free Cash Flow = Cash Flow From Ops - Capital Expenditures $17,196 Working Capital = Current Assets - Current Liabilities $37,958 Days of Working Capital = Working Capital 108 Projected Stock Price $51 Market Capitalization ($M) = Stock Price * Shares Outstanding $108 $31 Book Value Per Share = Equity/Shares Outstanding 14.5 Price Earnings Ratio (P/E) = Stock Price /EPS 1.6 Market/Book Ratio = Stock Price / Book Value per Share 0% Dividend Yield = Dividend Per Share / Stock Price 0% Dividend Payout Ratio = Dividend Per Share / EPS Leverage ROE ROS Asset Turnover 1596 6 10 10% 10% 5% X X 2rateamkey=3381335#section_5 Market Share CP114346_1 Round: 2 Dec. 31, 2025 Units Sold vs. Demand 20k Market Share 20% 15k 15% 10k 10% 5k 5% 0% Traditional Low End High End Performance Size Andrews Baldwin Chester Digby Erie Ferris Garrett Harper Irving Jasper Industry Unit Sales O Total Unit Demand Traditional Low End High End Performance Size Actual Market Share in Units Potential Market Share in Units High End Performance Size Total Name Traditional Low End High End Performance Size Total Name Traditional Low End 14,682 18,633 5,747 4,587 4.627 48,269 Industry Unit Sales 14,682 18,633 5,747 4,581 4,627 48,269 Units Demanded 9.6% 100% 100% % of Market 30.4% 38.6% 11.9% 9.5% % of Market 30.4% 38.6% 11.9% 9.5% 9.6% 0.1% 2.4% 0% 0% 0.1% 2.4% Able 7.9% 0% 0% 0% Able 8% 0% 1.4% 2.1% 0% 0% 0% 1.2% 0% 0% 0% 1.3% Acre 1% Acre 1.4% 2.3% 0% 1.2% Adam 0% 0% 8.1% 0% 0% 0% 0% 0% 9.8% 0.9% 6.59 0% 0.7%% Adam 0% Aft 0% 0% 7% 0.8% 0.79% Aft 0% 0% 1% 0% 0% 0.8% 0% 0% 0% 7% 8.1% Agape Z.1% 6% Agape 0% 0% 0% 5.5% 9.3% 2.1% 6.5% Total 9% 9.4% 2.3% 10.8% 7% 8.2% 0% 0% 0% 3.4% Total 0% 3.1% Baker 11.2% 0% 0% 0% 0% 3% Baker 10.2% 0% 0% 0% 7.8% 0% 0% 0% 0% 3.4% Bead 0% 0% 7.1% 0% 0% 9.4% Bead 3.8% 0% 1.2% Bid 0% 0% 1.5% 9.8% 0% 16.1% 0% 0% 0% Bid 0% 0% 0% B.7% 0% 13% 1.2% Bold 0% 0% 0% 0% 0.8% Bold 0% 0% 9.8% 0.9% Buddy 8.7% 9.9% 0% 0% Total 11.2% 7.89 9.4% 16.19 0% 0% Buddy 9.8% 0% 0% 2.8% 9.8% 0.1% 10.2% 8.8% 9.8% 13% 0% 2.8% Cake 9.1% 0% 09% 3.2% Total 0% 0% 0.1% 0% 0% 9.2% Cedar 0% 8.2% D.7% Cake 3.6% 5.59 0% 0% 9.3% 0% 0% 0% 0% 0% Cedar 0% 0% 0.8% Cid 0% 0% 6.5%onE 20 Industry ID: CP114346_1 | Round: 3 (2026) R & D Marketing Production Finance Reports . Alerts 0 Proforma Balanced Scorecard Ratios Cash Flow Income Statement Balance Sheet Cash Flows from Operations Cash Flow from Operations Cash Flow from Operating 20k $18,291 Net Income(Loss) $7,467 $17,196 Depreciation $8,600 15k Other (Extraordinary Gains/Losses/Writeoff) SO Change In Accounts Payable ($162) Change in Inventory ($933) 10k Change In Accounts Receivable $2,224 Net Cash From Operations $17,196 5k Cash Flows from Investing Net Plant Improvements SO ($1,095) Cash Flow from Financing Dividends Paid so - 5 k so Net Cash Flow Net Income (Loss) Depreciation Accounts Payable Sales Of Common Stock Accounts Receivable so Inventories highcharts.com Purchase Of Common Stock so Increase long term debt so Retire Long Term Debt Cash Flow from Investing ($14,550) Net Change in Current Debt ($14,550) Net Cash From Financing $2,646 Net Change In Cash Position $23,129 Starting Cash Position $25,775 Closing Cash PositionSTONE 20 Industry ID: CP114346_1 | Round: 3 (2026) R & D Marketing Production Finance Reports . Alerts 0 File Proforma Balanced Scorecard Ratios Cash Flow Income Statement Balance Sheet Balanced Scorecard This is an estimated scorecard from current decisions. Round 3 Financial Customer Internal Business Process Learning & Growth Round Total Cumulative Total 20.4 / 25 18.8 / 25 9.7 / 25 2.3 / 14 51.2/ 89 156.6 / 260 Balanced Scorecard Projected Results Financial Points 1.74 Leverage 7.1 / 8 points 1.3 1.8 2.8 SS1.32 Stock Price 8.0 / 8 points $3 $37 $7.5M Profit 5.3 / 9 points $1M $12M Total 20.4 / 25 pointsuct Name Julce Jump Jack Jordan Just Research & Development Performance 6,7 3 8.8 10.4 4.7 Size 14.3 17 10.7 15.3 9.6 Reliability 15,500 13,000 23,000 25,500 19,000 Marketing Price $25.00 $18.50 $38.00 $33.00 $33.00 Promo Budget $1,250 $1,000 $1,100 $1,000 $1,000 $1,500 $900 $1,000 $950 $850 Sales Budget 1400 Unit Sales Forecast 1600 410 500 400 Production 1,550 1,475 475 600 500 Production Order 100 -400 0 -50 -50 Capacity Change 3.0 3.0 4.0 5.0 3.0 Automation Next Round Finance So SO Stock Issue $0.00 Stock Retire SO Dividend SO Current Debt SO Bond Issue 30 Bond Retire 29 Accounts Payable Accounts ReceivableCAPSTONE 20 Industry ID: CP1 14346_1 | Round: 3 (2026) R & D Marketing Production Finance Reports Alerts File - Exit Marketing Products Investments Juice Jump Jack Jordan Just Awareness Accessibility Price $28.00 Total $13.50 $50.00 100% Promo Budget $1,900 $7,650 SO $3,000 75% Sales Budget $3,300 $10,750 SO $4,500 50% 1,400 Your Forecast 5,000 25% 3,500 0% Summary Juice . New . Old Juice Jump Jack Jordan Just Total Gross Revenue $39,200 $43,700 $17,438 $18,425 $23,800 $142,563 Variable Costs $25,202 $25,026 $11,137 $13,875 $16,230 $91,470 Customer Buying Criteria Contribution Margin $13,998 $18,674 $6,301 $4,550 $7,570 $51,093 $8,302 $7,899 $4,194 $3,511 $4,144 $28,050 Traditional Low High Performance Size Fixed Costs End End $1,039 $23,043 Net Margin $5,697 $10,775 $2, 107 $3,426 Expectations Importance Age 2 Years 47% Price $18.50 - $28.50 23% Ideal Position Pfmn 7.1, Size 12.9 21% Reliability 14,000 - 19,000 MTBF Hours 9% Segment Demand Traditional (this year) : 16,032