Please help me to do the following question please. I got really confused.QAQ
Thank you.
I also posted the solution for question 1&2 if question 3 are needed.
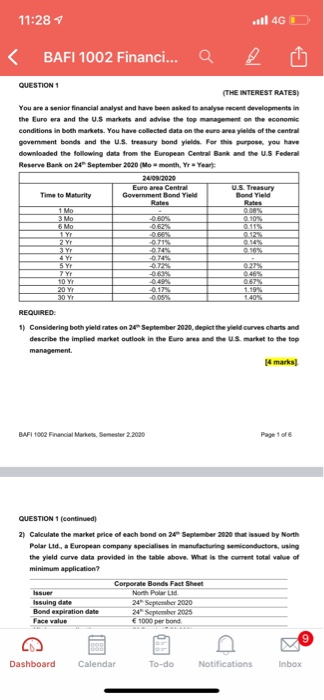
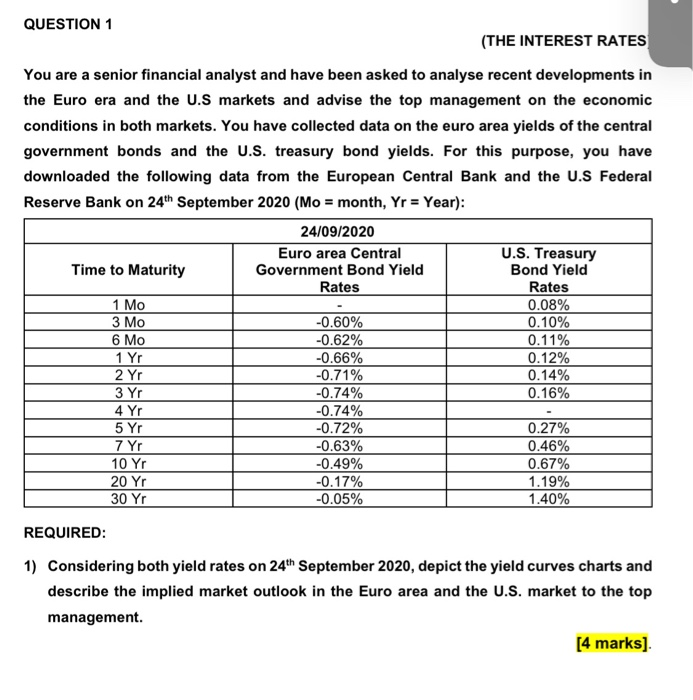
QUESTION 1
(THE INTEREST RATES)
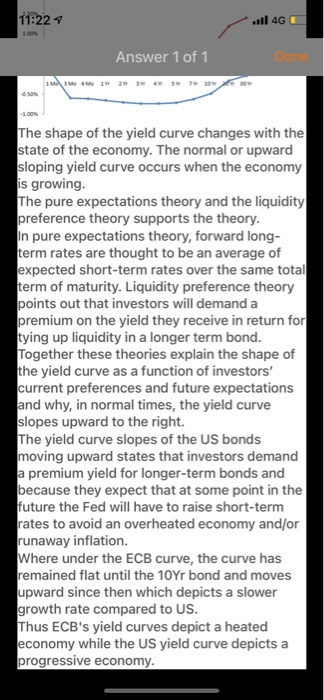
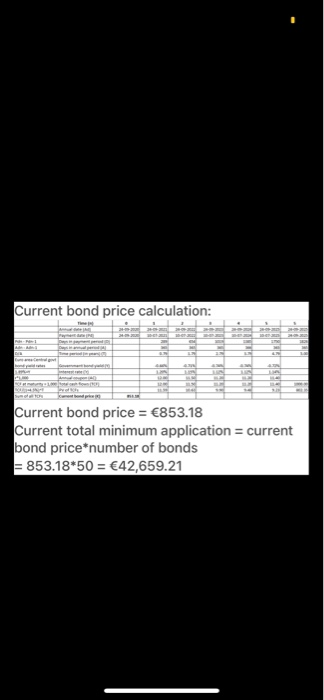
You are a senior financial analyst and have been asked to analyse recent developments in
the Euro era and the U.S markets and advise the top management on the economic
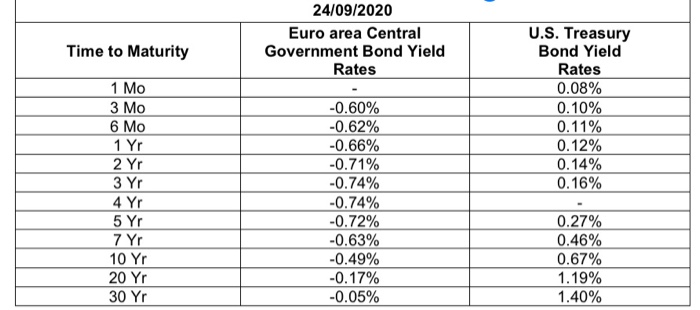
conditions in both markets. You have collected data on the euro area yields of the central
government bonds and the U.S. treasury bond yields. For this purpose, you have
downloaded the following data from the European Central Bank and the U.S Federal
Reserve Bank on 24th September 2020 (Mo = month, Yr = Year):
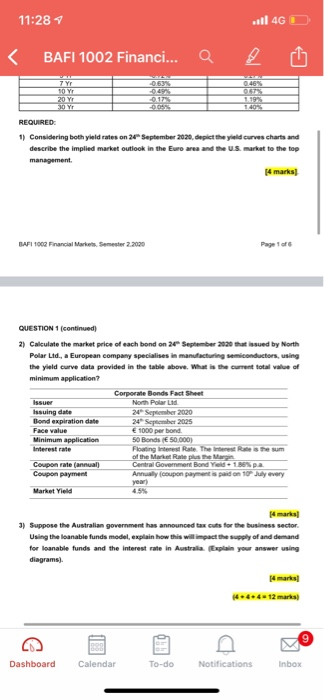
3) Suppose the Australian government has announced tax cuts for the business sector.
Using the loanable funds model, explain how this will impact the supply of and demand
for loanable funds and the interest rate in Australia. (Explain your answer using
diagrams).
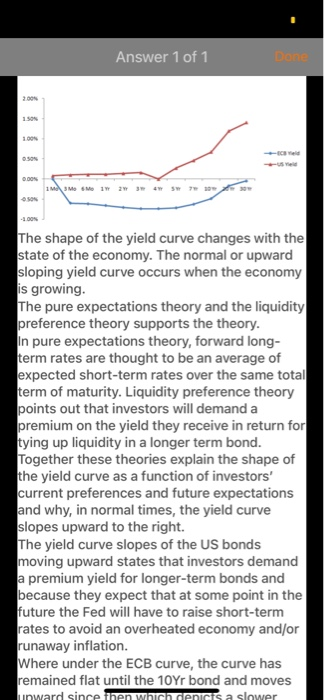
24/09/2020 Euro area Central Government Bond Yield Rates Time to Maturity 1 Mo 3 Mo 6 Mo 1 Yr 2 Yr 3 Yr 4 Yr 5 Yr 7 Yr 10 Yr 20 Yr 30 Yr U.S. Treasury Bond Yield Rates 0.08% 0.10% 0.11% 0.12% 0.14% 0.16% -0.60% -0.62% -0.66% -0.71% -0.74% -0.74% -0.72% -0.63% -0.49% -0.17% -0.05% 0.27% 0.46% 0.67% 1.19% 1.40% 11:287 ...11 4G BAFI 1002 Financi... QUESTION 1 (THE INTEREST RATES) You are a senior financial analyst and have been asked to analyse recent developments in the Euro era and the US markets and advise the top management on the economic conditions in both markets. You have collected data on the euro area yields of the central government bonds and the U.S. treasury bond yields. For this purpose. you have downloaded the following data from the European Central Bank and the US Federal Reserve Bank on September 2020 (Mo-monthYr Yeart 24/09/2020 Euro area Central US Treasury Time to Maturity Government Bond Yield Band Yield Rates Rates 1 Mo 0.08% 3 Mo -0.60% 0.10% 6 Mo 1 Yr 075 070 JY 4 Yr 972 74 ayr SY Syr 7 YI 0.46% 10 YI 20 Yr 1.19% 30 Y -0.05% REQUIRED 1) Considering both yield rates on 20 September 2020, depict the yield Curves charts and describe the implied market outlook in the Euro area and the US market to the top management [4 marks] BAFI 1062 Financial Markets, Semester 2.2020 Page of QUESTION 1 (continued 2) Calculate the market price of each bond on 20 September 2020 that issued by North Polar Ltd., a European company specialises in manufacturing semiconductors, using the yield curve data provided in the table above. What is the current total value of minimum application? Corporate Bonds Fact Sheet Issuer North Polar Led Issuing date 24 September 2020 Bond expiration date 20 September 2025 Face value 1000 per bond 9 Dashboard Calendar To-do Notifications Inbox 11:28 4 ...11 4G BAFI 1002 Financi... -0.63% 0.46% 7 YT SOY 20 YI JOY! 1193 REQUIRED 1) Considering both yield rates on 2 September 2020, depict the yield Curves charts and describe the implied market outlook in the Euro area and the U.S. market to the top management (4 marks BAFI 1002 Financial Markets, Semester 2.2020 Page 1 of QUESTION 1 (continued) 2) Calculate the market price of each bond on 26 September 2020 that issued by North Polar Ltd., a European company specialises in manufacturing semiconductors, using the yield curve data provided in the table above. What is the current total value of minimum application? Corporate Bonds Fact Sheet Issuer North Polar Lid Issuing date 20 September 2020 Bond expiration date 24 September 2025 Face value 1000 per bond Minimum application 50 Bonds 50.000) Interest rate Floating interest Rate The Rhesum of the Market Rate the Marga Coupon rate (annual) Central Government Bond Yeld 1.88% pa Coupon payment Annual (coupon payment is paid on 10 July every year) Market Yield 4.5% 3) Suppose the Australian government has announced tax cuts for the business sector Using the loanable funds model, explain how this will impact the supply of and demand for loanable funds and the interest rate in Australia. (Explain your answer using diagrams) 144.412 marks Dashboard Calendar To-do Notifications Inbox Answer 1 of 1 DON 1.50 SON DON 1 MM 1 2 3 4 5 -100% The shape of the yield curve changes with the state of the economy. The normal or upward sloping yield curve occurs when the economy is growing. The pure expectations theory and the liquidity preference theory supports the theory. In pure expectations theory, forward long- term rates are thought to be an average of expected short-term rates over the same total term of maturity. Liquidity preference theory points out that investors will demand a premium on the yield they receive in return for tying up liquidity in a longer term bond. Together these theories explain the shape of the yield curve as a function of investors' current preferences and future expectations and why, in normal times, the yield curve slopes upward to the right. The yield curve slopes of the US bonds moving upward states that investors demand a premium yield for longer-term bonds and because they expect that at some point in the future the Fed will have to raise short-term rates to avoid an overheated economy and/or runaway inflation. Where under the ECB curve, the curve has remained flat until the 10Yr bond and moves unward since then which depicts a slower 11:224 ..11 4G DON Answer 1 of 1 IMM www ws 10 The shape of the yield curve changes with the state of the economy. The normal or upward sloping yield curve occurs when the economy is growing. The pure expectations theory and the liquidity preference theory supports the theory. In pure expectations theory, forward long- term rates are thought to be an average of expected short-term rates over the same total term of maturity. Liquidity preference theory points out that investors will demand a premium on the yield they receive in return for tying up liquidity in a longer term bond. Together these theories explain the shape of the yield curve as a function of investors' current preferences and future expectations and why, in normal times, the yield curve slopes upward to the right. The yield curve slopes of the US bonds moving upward states that investors demand a premium yield for longer-term bonds and because they expect that at some point in the future the Fed will have to raise short-term rates to avoid an overheated economy and/or runaway inflation. Where under the ECB curve, the curve has remained flat until the 10Yr bond and moves upward since then which depicts a slower growth rate compared to US. Thus ECB's yield curves depict a heated economy while the US yield curve depicts a progressive economy. Current bond price calculation: Current bond price = 853.18 Current total minimum application = current bond price*number of bonds = 853.18*50 = 42,659.21 QUESTION 1 (THE INTEREST RATES You are a senior financial analyst and have been asked to analyse recent developments in the Euro era and the U.S markets and advise the top management on the economic conditions in both markets. You have collected data on the euro area yields of the central government bonds and the U.S. treasury bond yields. For this purpose, you have downloaded the following data from the European Central Bank and the U.S Federal Reserve Bank on 24th September 2020 (Mo = month, Yr = Year): 24/09/2020 Euro area Central U.S. Treasury Time to Maturity Government Bond Yield Bond Yield Rates Rates 1 Mo 0.08% 3 Mo -0.60% 0.10% 6 Mo -0.62% 0.11% 1 Yr -0.66% 0.12% 2 Yr -0.71% 0.14% 3 Yr -0.74% 0.16% 4 Yr -0.74% 5 Yr -0.72% 0.27% 7 Yr -0.63% 0.46% 10 Yr -0.49% 0.67% 20 Yr -0.17% 1.19% 30 Yr -0.05% 1.40% REQUIRED: 1) Considering both yield rates on 24th September 2020, depict the yield curves charts and describe the implied market outlook in the Euro area and the U.S. market to the top management. [4 marks] QUESTION 1 (continued) 2) Calculate the market price of each bond on 24th September 2020 that issued by North Polar Ltd., a European company specialises in manufacturing semiconductors, using the yield curve data provided in the table above. What is the current total value of minimum application? Corporate Bonds Fact Sheet Issuer North Polar Ltd. Issuing date 24th September 2020 Bond expiration date 24th September 2025 Face value 1000 per bond. Minimum application 50 Bonds ( 50,000) Interest rate Floating Interest Rate. The Interest Rate is the sum of the Market Rate plus the Margin. Coupon rate (annual) Central Government Bond Yield +1.86% p.a. Coupon payment Annually (coupon payment is paid on 10th July every year) Market Yield 4.5% [4 marks] 3) Suppose the Australian government has announced tax cuts for the business sector. Using the loanable funds model, explain how this will impact the supply of and demand for loanable funds and the interest rate in Australia. (Explain your answer using diagrams). [4 marks] (4 + 4 + 4 = 12 marks) Answer 1 of 1 DON 1.50 SON DON 1 MM 1 2 3 4 5 -100% The shape of the yield curve changes with the state of the economy. The normal or upward sloping yield curve occurs when the economy is growing. The pure expectations theory and the liquidity preference theory supports the theory. In pure expectations theory, forward long- term rates are thought to be an average of expected short-term rates over the same total term of maturity. Liquidity preference theory points out that investors will demand a premium on the yield they receive in return for tying up liquidity in a longer term bond. Together these theories explain the shape of the yield curve as a function of investors' current preferences and future expectations and why, in normal times, the yield curve slopes upward to the right. The yield curve slopes of the US bonds moving upward states that investors demand a premium yield for longer-term bonds and because they expect that at some point in the future the Fed will have to raise short-term rates to avoid an overheated economy and/or runaway inflation. Where under the ECB curve, the curve has remained flat until the 10Yr bond and moves unward since then which depicts a slower 11:224 ..11 4G DON Answer 1 of 1 IMM www ws 10 The shape of the yield curve changes with the state of the economy. The normal or upward sloping yield curve occurs when the economy is growing. The pure expectations theory and the liquidity preference theory supports the theory. In pure expectations theory, forward long- term rates are thought to be an average of expected short-term rates over the same total term of maturity. Liquidity preference theory points out that investors will demand a premium on the yield they receive in return for tying up liquidity in a longer term bond. Together these theories explain the shape of the yield curve as a function of investors' current preferences and future expectations and why, in normal times, the yield curve slopes upward to the right. The yield curve slopes of the US bonds moving upward states that investors demand a premium yield for longer-term bonds and because they expect that at some point in the future the Fed will have to raise short-term rates to avoid an overheated economy and/or runaway inflation. Where under the ECB curve, the curve has remained flat until the 10Yr bond and moves upward since then which depicts a slower growth rate compared to US. Thus ECB's yield curves depict a heated economy while the US yield curve depicts a progressive economy. Current bond price calculation: Current bond price = 853.18 Current total minimum application = current bond price*number of bonds = 853.18*50 = 42,659.21 24/09/2020 Euro area Central Government Bond Yield Rates Time to Maturity 1 Mo 3 Mo 6 Mo 1 Yr 2 Yr 3 Yr 4 Yr 5 Yr 7 Yr 10 Yr 20 Yr 30 Yr U.S. Treasury Bond Yield Rates 0.08% 0.10% 0.11% 0.12% 0.14% 0.16% -0.60% -0.62% -0.66% -0.71% -0.74% -0.74% -0.72% -0.63% -0.49% -0.17% -0.05% 0.27% 0.46% 0.67% 1.19% 1.40% 11:287 ...11 4G BAFI 1002 Financi... QUESTION 1 (THE INTEREST RATES) You are a senior financial analyst and have been asked to analyse recent developments in the Euro era and the US markets and advise the top management on the economic conditions in both markets. You have collected data on the euro area yields of the central government bonds and the U.S. treasury bond yields. For this purpose. you have downloaded the following data from the European Central Bank and the US Federal Reserve Bank on September 2020 (Mo-monthYr Yeart 24/09/2020 Euro area Central US Treasury Time to Maturity Government Bond Yield Band Yield Rates Rates 1 Mo 0.08% 3 Mo -0.60% 0.10% 6 Mo 1 Yr 075 070 JY 4 Yr 972 74 ayr SY Syr 7 YI 0.46% 10 YI 20 Yr 1.19% 30 Y -0.05% REQUIRED 1) Considering both yield rates on 20 September 2020, depict the yield Curves charts and describe the implied market outlook in the Euro area and the US market to the top management [4 marks] BAFI 1062 Financial Markets, Semester 2.2020 Page of QUESTION 1 (continued 2) Calculate the market price of each bond on 20 September 2020 that issued by North Polar Ltd., a European company specialises in manufacturing semiconductors, using the yield curve data provided in the table above. What is the current total value of minimum application? Corporate Bonds Fact Sheet Issuer North Polar Led Issuing date 24 September 2020 Bond expiration date 20 September 2025 Face value 1000 per bond 9 Dashboard Calendar To-do Notifications Inbox 11:28 4 ...11 4G BAFI 1002 Financi... -0.63% 0.46% 7 YT SOY 20 YI JOY! 1193 REQUIRED 1) Considering both yield rates on 2 September 2020, depict the yield Curves charts and describe the implied market outlook in the Euro area and the U.S. market to the top management (4 marks BAFI 1002 Financial Markets, Semester 2.2020 Page 1 of QUESTION 1 (continued) 2) Calculate the market price of each bond on 26 September 2020 that issued by North Polar Ltd., a European company specialises in manufacturing semiconductors, using the yield curve data provided in the table above. What is the current total value of minimum application? Corporate Bonds Fact Sheet Issuer North Polar Lid Issuing date 20 September 2020 Bond expiration date 24 September 2025 Face value 1000 per bond Minimum application 50 Bonds 50.000) Interest rate Floating interest Rate The Rhesum of the Market Rate the Marga Coupon rate (annual) Central Government Bond Yeld 1.88% pa Coupon payment Annual (coupon payment is paid on 10 July every year) Market Yield 4.5% 3) Suppose the Australian government has announced tax cuts for the business sector Using the loanable funds model, explain how this will impact the supply of and demand for loanable funds and the interest rate in Australia. (Explain your answer using diagrams) 144.412 marks Dashboard Calendar To-do Notifications Inbox Answer 1 of 1 DON 1.50 SON DON 1 MM 1 2 3 4 5 -100% The shape of the yield curve changes with the state of the economy. The normal or upward sloping yield curve occurs when the economy is growing. The pure expectations theory and the liquidity preference theory supports the theory. In pure expectations theory, forward long- term rates are thought to be an average of expected short-term rates over the same total term of maturity. Liquidity preference theory points out that investors will demand a premium on the yield they receive in return for tying up liquidity in a longer term bond. Together these theories explain the shape of the yield curve as a function of investors' current preferences and future expectations and why, in normal times, the yield curve slopes upward to the right. The yield curve slopes of the US bonds moving upward states that investors demand a premium yield for longer-term bonds and because they expect that at some point in the future the Fed will have to raise short-term rates to avoid an overheated economy and/or runaway inflation. Where under the ECB curve, the curve has remained flat until the 10Yr bond and moves unward since then which depicts a slower 11:224 ..11 4G DON Answer 1 of 1 IMM www ws 10 The shape of the yield curve changes with the state of the economy. The normal or upward sloping yield curve occurs when the economy is growing. The pure expectations theory and the liquidity preference theory supports the theory. In pure expectations theory, forward long- term rates are thought to be an average of expected short-term rates over the same total term of maturity. Liquidity preference theory points out that investors will demand a premium on the yield they receive in return for tying up liquidity in a longer term bond. Together these theories explain the shape of the yield curve as a function of investors' current preferences and future expectations and why, in normal times, the yield curve slopes upward to the right. The yield curve slopes of the US bonds moving upward states that investors demand a premium yield for longer-term bonds and because they expect that at some point in the future the Fed will have to raise short-term rates to avoid an overheated economy and/or runaway inflation. Where under the ECB curve, the curve has remained flat until the 10Yr bond and moves upward since then which depicts a slower growth rate compared to US. Thus ECB's yield curves depict a heated economy while the US yield curve depicts a progressive economy. Current bond price calculation: Current bond price = 853.18 Current total minimum application = current bond price*number of bonds = 853.18*50 = 42,659.21 QUESTION 1 (THE INTEREST RATES You are a senior financial analyst and have been asked to analyse recent developments in the Euro era and the U.S markets and advise the top management on the economic conditions in both markets. You have collected data on the euro area yields of the central government bonds and the U.S. treasury bond yields. For this purpose, you have downloaded the following data from the European Central Bank and the U.S Federal Reserve Bank on 24th September 2020 (Mo = month, Yr = Year): 24/09/2020 Euro area Central U.S. Treasury Time to Maturity Government Bond Yield Bond Yield Rates Rates 1 Mo 0.08% 3 Mo -0.60% 0.10% 6 Mo -0.62% 0.11% 1 Yr -0.66% 0.12% 2 Yr -0.71% 0.14% 3 Yr -0.74% 0.16% 4 Yr -0.74% 5 Yr -0.72% 0.27% 7 Yr -0.63% 0.46% 10 Yr -0.49% 0.67% 20 Yr -0.17% 1.19% 30 Yr -0.05% 1.40% REQUIRED: 1) Considering both yield rates on 24th September 2020, depict the yield curves charts and describe the implied market outlook in the Euro area and the U.S. market to the top management. [4 marks] QUESTION 1 (continued) 2) Calculate the market price of each bond on 24th September 2020 that issued by North Polar Ltd., a European company specialises in manufacturing semiconductors, using the yield curve data provided in the table above. What is the current total value of minimum application? Corporate Bonds Fact Sheet Issuer North Polar Ltd. Issuing date 24th September 2020 Bond expiration date 24th September 2025 Face value 1000 per bond. Minimum application 50 Bonds ( 50,000) Interest rate Floating Interest Rate. The Interest Rate is the sum of the Market Rate plus the Margin. Coupon rate (annual) Central Government Bond Yield +1.86% p.a. Coupon payment Annually (coupon payment is paid on 10th July every year) Market Yield 4.5% [4 marks] 3) Suppose the Australian government has announced tax cuts for the business sector. Using the loanable funds model, explain how this will impact the supply of and demand for loanable funds and the interest rate in Australia. (Explain your answer using diagrams). [4 marks] (4 + 4 + 4 = 12 marks) Answer 1 of 1 DON 1.50 SON DON 1 MM 1 2 3 4 5 -100% The shape of the yield curve changes with the state of the economy. The normal or upward sloping yield curve occurs when the economy is growing. The pure expectations theory and the liquidity preference theory supports the theory. In pure expectations theory, forward long- term rates are thought to be an average of expected short-term rates over the same total term of maturity. Liquidity preference theory points out that investors will demand a premium on the yield they receive in return for tying up liquidity in a longer term bond. Together these theories explain the shape of the yield curve as a function of investors' current preferences and future expectations and why, in normal times, the yield curve slopes upward to the right. The yield curve slopes of the US bonds moving upward states that investors demand a premium yield for longer-term bonds and because they expect that at some point in the future the Fed will have to raise short-term rates to avoid an overheated economy and/or runaway inflation. Where under the ECB curve, the curve has remained flat until the 10Yr bond and moves unward since then which depicts a slower 11:224 ..11 4G DON Answer 1 of 1 IMM www ws 10 The shape of the yield curve changes with the state of the economy. The normal or upward sloping yield curve occurs when the economy is growing. The pure expectations theory and the liquidity preference theory supports the theory. In pure expectations theory, forward long- term rates are thought to be an average of expected short-term rates over the same total term of maturity. Liquidity preference theory points out that investors will demand a premium on the yield they receive in return for tying up liquidity in a longer term bond. Together these theories explain the shape of the yield curve as a function of investors' current preferences and future expectations and why, in normal times, the yield curve slopes upward to the right. The yield curve slopes of the US bonds moving upward states that investors demand a premium yield for longer-term bonds and because they expect that at some point in the future the Fed will have to raise short-term rates to avoid an overheated economy and/or runaway inflation. Where under the ECB curve, the curve has remained flat until the 10Yr bond and moves upward since then which depicts a slower growth rate compared to US. Thus ECB's yield curves depict a heated economy while the US yield curve depicts a progressive economy. Current bond price calculation: Current bond price = 853.18 Current total minimum application = current bond price*number of bonds = 853.18*50 = 42,659.21