Answered step by step
Verified Expert Solution
Question
1 Approved Answer
A = bc A = absorbance b = path length (typically 1 cm for standard cuvettes) = molar absorptivity (aka extinction coefficient) c =


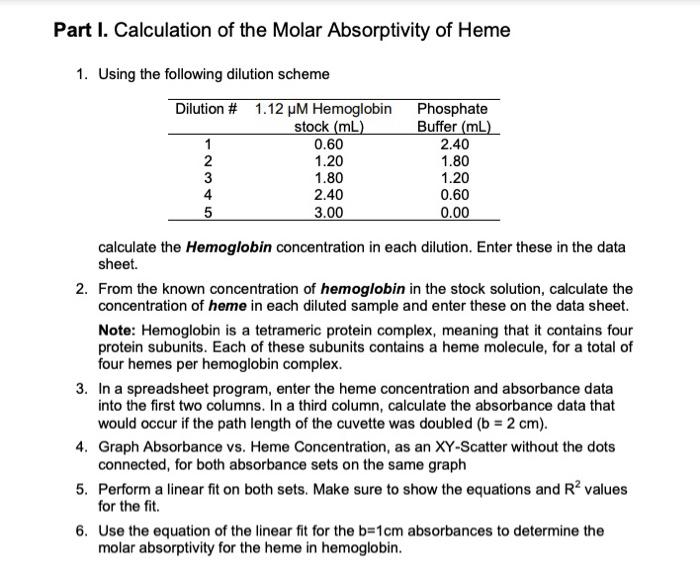
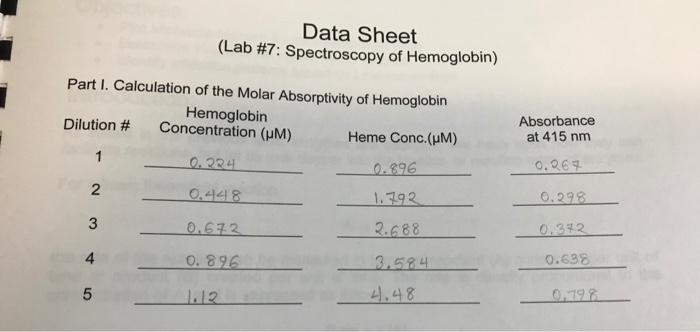
A = bc A = absorbance b = path length (typically 1 cm for standard cuvettes) = molar absorptivity (aka extinction coefficient) c = concentration of chromophore Part I. Calculation of the Molar Absorptivity of Heme 1. Using the following dilution scheme Dilution # 1.12 M Hemoglobin stock (mL) 1 12345 2 3 4 5 0.60 1.20 1.80 2.40 3.00 Phosphate Buffer (mL) 2.40 1.80 1.20 0.60 0.00 calculate the Hemoglobin concentration in each dilution. Enter these in the data sheet. 2. From the known concentration of hemoglobin in the stock solution, calculate the concentration of heme in each diluted sample and enter these on the data sheet. Note: Hemoglobin is a tetrameric protein complex, meaning that it contains four protein subunits. Each of these subunits contains a heme molecule, for a total of four hemes per hemoglobin complex. 3. In a spreadsheet program, enter the heme concentration and absorbance data into the first two columns. In a third column, calculate the absorbance data that would occur if the path length of the cuvette was doubled (b = 2 cm). 4. Graph Absorbance vs. Heme Concentration, as an XY-Scatter without the dots connected, for both absorbance sets on the same graph 5. Perform a linear fit on both sets. Make sure to show the equations and R values for the fit. 6. Use the equation of the linear fit for the b=1cm absorbances to determine the molar absorptivity for the heme in hemoglobin. Part I. Calculation of the Molar Absorptivity of Hemoglobin Hemoglobin Concentration (m) Heme Conc. (HM) 0.224 0.896 0.448 1.792 0.672 2.688 0.896 3.584 4.48 Dilution # 2 3 Data Sheet (Lab #7: Spectroscopy of Hemoglobin) 4 5 1.12 Absorbance at 415 nm 0.267 0.298 0.342 0.638 0.798
Step by Step Solution
★★★★★
3.45 Rating (161 Votes )
There are 3 Steps involved in it
Step: 1
Answers 1 Calculation of the hemoglobin concentration in each dilut...
Get Instant Access to Expert-Tailored Solutions
See step-by-step solutions with expert insights and AI powered tools for academic success
Step: 2

Step: 3

Ace Your Homework with AI
Get the answers you need in no time with our AI-driven, step-by-step assistance
Get Started


