Question
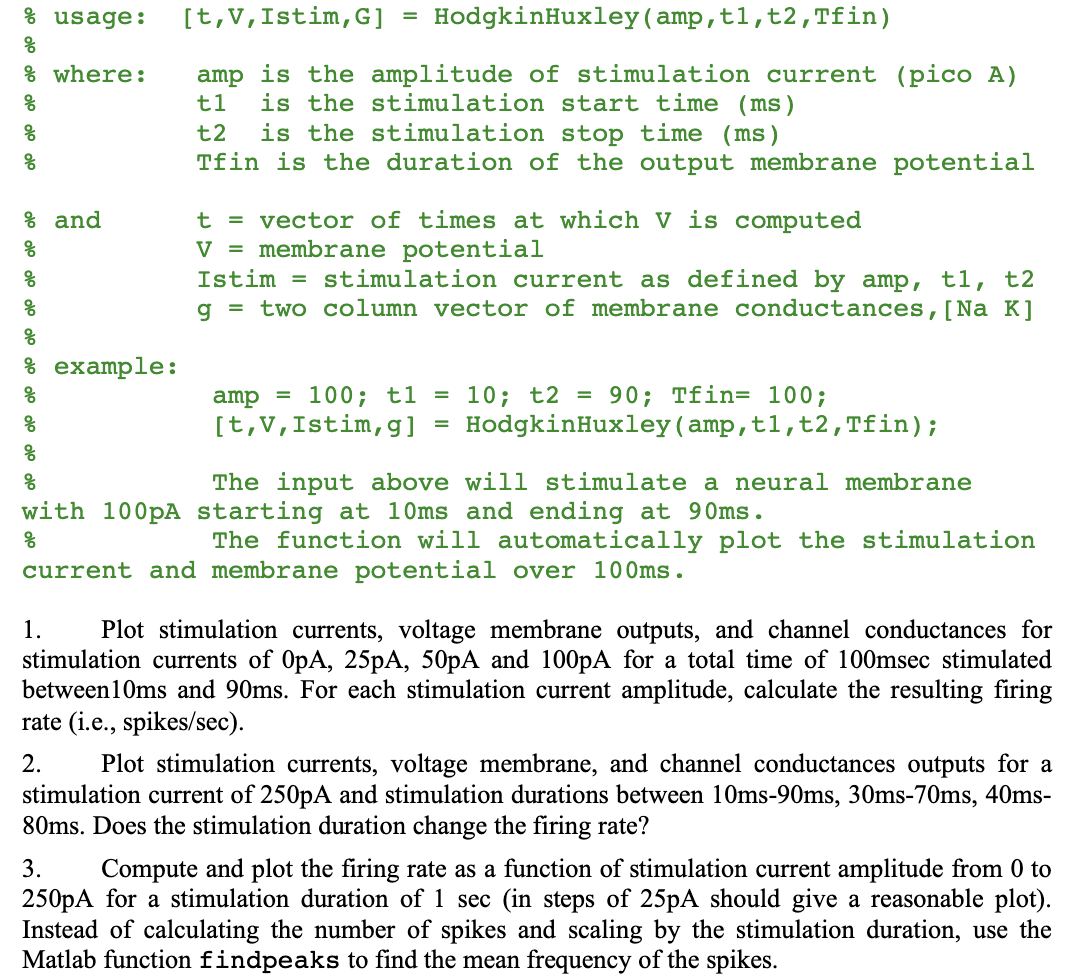
Please help me with my code in matlab it isnt working clc/clear; function [t,V,Istim,g] = HodgkinHuxley(amp,t1,t2,Tfin) % usage: [t,V,Istim] = HodgkinHuxley(amp,t1,t2,Tfin) % % where: amp
Please help me with my code in matlab it isnt working
clc/clear;
function [t,V,Istim,g] = HodgkinHuxley(amp,t1,t2,Tfin)
% usage: [t,V,Istim] = HodgkinHuxley(amp,t1,t2,Tfin)
%
% where: amp is the amplitude of stimulation current (pico A)
% t1 is the stimulation start time (ms)
% t2 is the stimulation stop time (ms)
% Tfin is the duration of the output membrane potential
%
% and t = vector of times at which v is computed
% V = associated potentials
% Istim = stimulation current as defined by amp, t1 and t2
%
% example:
% amp = 100; t1 = 10; t2 = 90; Tfin= 100;
% [t,V,Istim] = HodgkinHuxley(amp,t1,t2,Tfin);
%
% The input above will stimulate a neural membrane with 100pA
% starting at 10ms and ending at 90ms.
% The function will automatically plot the stimulation current,
% membrane potential, ion channel conductances over 100ms.
warning('off');
dt = 0.01;
amp = amp*1e-6;
A = 4*pi*(1e-6); % surface area (cm)^2
Cm = 1; % membrane capacitance (microFarad/cm^2)
E = struct('K', -77, 'Na', 56, 'Cl', -68); % reversal potentials, mV
G = struct('K', 36, 'Na', 120, 'Cl', 0.3); % channel conductances, mS/cm^2
Vr = -71;%fsolve(@(V) Iss(V,E,G),-71); % find rest potential
Nt = ceil(Tfin/dt); % initialize
t = zeros(Nt,1); V = t;
t(1) = 0;
V(1) = Vr;
n = an(Vr)/(an(Vr)+bn(Vr));
m = am(Vr)/(am(Vr)+bm(Vr));
h = ah(Vr)/(ah(Vr)+bh(Vr));
td = 1/dt;
Istim = zeros(Nt,1);
g = zeros(Nt,2);
for j = 2:Nt % march
t(j) = (j-1)*dt;
Istim(j) = amp*(t(j)-dt/2>t1)*(t(j)-dt/2 a = an(V(j-1)); b = bn(V(j-1)); c = (a+b)/2; n = ( (td-c)*n + a ) / (td + c); cK = G.K*n^4; % Conductance of potassium channel g(j,2) = cK; a = am(V(j-1)); b = bm(V(j-1)); c = (a+b)/2; m = ( (td-c)*m + a ) / (td + c); a = ah(V(j-1)); b = bh(V(j-1)); c = (a+b)/2; h = ( (td-c)*h + a ) / (td + c); cNa = G.Na*m^3*h; % Conductance of sodium channel g(j,1) = cNa; top = 2*Cm*V(j-1)*td + cK*E.K + cNa*E.Na + G.Cl*E.Cl + Istim(j)/A; bot = 2*Cm*td + cK + cNa + G.Cl; Vmid = top/bot; V(j) = 2*Vmid - V(j-1); end figure; subplot(3,1,1) plot(t,Istim/1e-6,'LineWidth',3); axis([0 Tfin 0 300]) ylabel('I_{stim} (pA)','fontsize',14) xlabel('Time (ms)','fontsize',14) subplot(3,1,2) plot(t,V,'LineWidth',3); axis([0 Tfin -100 50]) ylabel('V_m (mV)','fontsize',14) xlabel('Time (ms)','fontsize',14) subplot(3,1,3) plot(t,g,'LineWidth',3); axis([0 Tfin 0 30]) ylabel('g (mS/cm^2)','fontsize',14) xlabel('Time (ms)','fontsize',14) hleg = legend('g_{Na}','g_K'); set(hleg,'FontSize',14) function val = Iss(V,E,G) val = G.Na*(am(V)/(am(V)+bm(V)))^3*(ah(V)/(ah(V)+bh(V)))*(V-E.Na) + ... G.K*(an(V)/(an(V)+bn(V)))^4*(V-E.K) + G.Cl*(V-E.Cl); function val = an(V) val = .01*(10-(V+71))./(exp(1-(V+71)/10)-1); function val = bn(V) val = .125*exp(-(V+71)/80); function val = am(V) val = .1*(25-(V+71))./(exp(2.5-(V+71)/10)-1); function val = bm(V) val = 4*exp(-(V+71)/18); function val = ah(V) val = 0.07*exp(-(V+71)/20); function val = bh(V) val = 1./(exp(3-(V+71)/10)+1); end % Task 1 stimulation_currents = [0 25 50 100]; time = 0:0.001:0.1; % time in seconds voltage_membrane = zeros(length(stimulation_currents), length(time)); channel_conductances = zeros(length(stimulation_currents), length(time)); firing_rate = zeros(1, length(stimulation_currents)); for i = 1:length(stimulation_currents) % simulate the stimulation current, voltage membrane, and channel conductance for each current amplitude stimulation_current = stimulation_currents(i) * (time >= 0.01 & time voltage_membrane(i, :) = simulate_voltage_membrane(stimulation_current, time); channel_conductances(i, :)= simulate_channel_conductance(voltage_membrane(i, :), time); % find the spikes using the findpeaks function [~, locs] = findpeaks(voltage_membrane(i, :)); firing_rate(i) = length(locs) / (0.1 - 0.01); end % Plot the stimulation currents, voltage membrane, and channel conductance figure; subplot(3, 1, 1); plot(time, stimulation_current); xlabel('Time (s)'); ylabel('Stimulation Current (pA)'); subplot(3, 1, 2); plot(time, voltage_membrane); xlabel('Time (s)'); ylabel('Voltage Membrane (mV)'); subplot(3, 1, 3); plot(time, channel_conductances); xlabel('Time (s)'); ylabel('Channel Conductance (S)'); % Task 2 stimulation_currents = 250; stimulation_durations = [0.01 0.03 0.04]; time = 0:0.001:1; % time in seconds voltage_membrane = zeros(length(stimulation_durations), length(time)); channel_conductances = zeros(length(stimulation_durations), length(time)); firing_rate = zeros(1, length(stimulation_durations)); for i = 1:length(stimulation_durations) % simulate the stimulation current, voltage membrane, and channel conductance for each stimulation duration stimulation_duration = stimulation_durations(i); stimulation_current = stimulation_currents * (time >= (1 - stimulation_duration) / 2 & time voltage_membrane(i, :) = simulate_voltage_membrane(stimulation_current, time); channel_conductances(i, :) = simulate_channel_conductance(voltage_membrane(i, :), time); % find the spikes using the findpeaks function [~, locs] = findpeaks(voltage_membrane(i, :)); firing_rate(i) = length(locs) / (stimulation_duration); end % Plot the stimulation currents, voltage membrane, and channel conductance figure; subplot(3, 1, 1); plot(time, stimulation_current); xlabel('Time (s)'); ylabel('Stimulation Current (pA)'); subplot(3, 1, 2); plot(time, voltage_membrane); xlabel('Time (s)'); ylabel('Voltage Membrane (mV)'); subplot(3, 1, 3); plot(time, channel_conductances); xlabel('Time (s)'); ylabel('Channel Conductance (S)'); % Define the stimulation current amplitude range current_range = 0:25:250; % Define the stimulation duration duration = 1; % sec % Preallocate the firing rate array firing_rate = zeros(size(current_range)); % Loop through the current range for i = 1:length(current_range) % Stimulate with current amplitude stimulation_current = current_range(i); % Simulate voltage response voltage = simulateVoltage(stimulation_current, duration); % Find the peaks in the voltage response [peaks,locs] = findpeaks(voltage); % Compute the firing rate as the mean frequency of the peaks firing_rate(i) = length(peaks)/duration; end % Plot the firing rate vs current amplitude plot(current_range, firing_rate); xlabel('Stimulation Current Amplitude (pA)'); ylabel('Firing Rate (Hz)'); the code is answering these questions: 
Step by Step Solution
There are 3 Steps involved in it
Step: 1

Get Instant Access to Expert-Tailored Solutions
See step-by-step solutions with expert insights and AI powered tools for academic success
Step: 2

Step: 3

Ace Your Homework with AI
Get the answers you need in no time with our AI-driven, step-by-step assistance
Get Started


