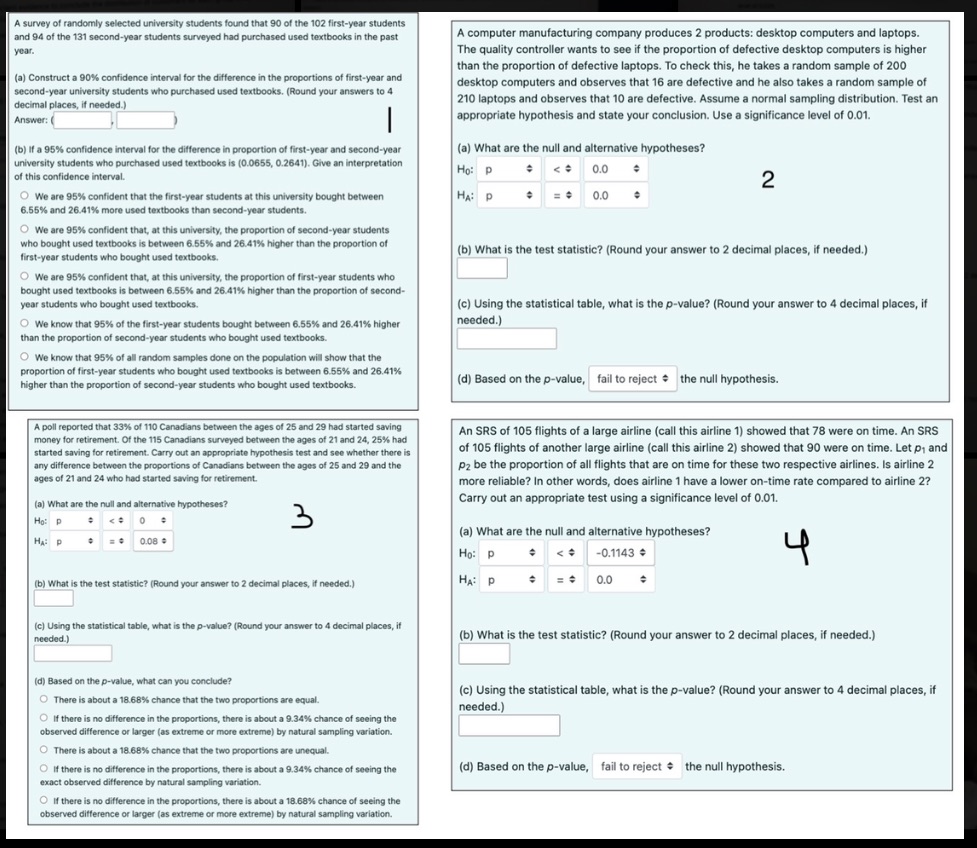
Please help me with my stats assignment!For #2 the options for A)H0 and Ha: , 1- 2,p,p1-p2, And dThen the options are ?, =, Then the options are 0.0, or 0.0324Then for #2 d) The options are reject, or fail to rejectFor #3 the options for A)H0 and Ha: , 1- 2,p,p1-p2, And dThen the options are ?, =, Then the options are 0.0, or 0.08For #4 the options for A)H0 and Ha: , 1- 2,p,p1-p2, And dThen the options are ?, =, Then the options are 0.0, or -0.1143Then for #4 d) The options are reject, or fail to reject
A survey of randomly selected university students found that 90 of the 102 first-year students and 94 of the 131 second-year students surveyed had purchased used textbooks in the past A computer manufacturing company produces 2 products: desktop computers and laptops. year. The quality controller wants to see if the proportion of defective desktop computers is higher than the proportion of defective laptops. To check this, he takes a random sample of 200 (a) Construct a 90% confidence interval for the difference in the proportions of first-year and desktop computers and observes that 16 are defective and he also takes a random sample of second-year university students who purchased used textbooks. (Round your answers to 4 decimal places, if needed.) 210 laptops and observes that 10 are defective. Assume a normal sampling distribution. Test an Answer:( appropriate hypothesis and state your conclusion. Use a significance level of 0.01. (b) if a 95% confidence interval for the difference in proportion of first-year and second-year (a) What are the null and alternative hypotheses? university students who purchased used textbooks is (0.0655, 0.2641). Give an interpretation Ho: P 0.0 of this confidence interval. 2 O We are 95%% confident that the first-year students at this university bought between HA: P 0.0 6.55% and 26.41% more used textbooks than second-year students. O We are 95% confident that, at this university, the proportion of second-year students who bought used textbooks is between 6.55%% and 26.41% higher than the proportion of first-year students who bought used textbooks. (b) What is the test statistic? (Round your answer to 2 decimal places, if needed.) O We are 95% confident that, at this university, the proportion of first-year students who bought used textbooks is between 6.55%% and 26.41%% higher than the proportion of second- year (c) Using the statistical table, what is the p-value? (Round your answer to 4 decimal places, if We know that 95% of the first-year students bought between 6.55% and 26.41% higher needed.) than the proportion of second-year students who bought used textbooks. We know that 95%% of all random samples done on the population will show that the proportion of first-year students who bought used textbooks is between 6.55% and 26.41%% higher than the proportion of sec or students who bought used textbooks. (d) Based on the p-value, fail to reject * the null hypothesis. A poll reported that 33%% of 110 Canadians between the ages of 25 and 29 had started saving money for retirement. Of the 115 Can An SRS of 105 flights of a large airline (call this airline 1) showed that 78 were on time. An SRS ages of 21 and 24, 25%% had started saving for retirement. Carry out hypothesis test and see whether there is of 105 flights of another large airline (call this airline 2) showed that 90 were on time. Let p, and any difference between the proportions of Canadians between the ages of 25 and 29 and the p2 be the proportion of all flights that are on time for these two respective airlines. Is airline 2 ages of 21 and 24 who had started saving for retirement. more reliable? In other words, does airline 1 have a lower on-time rate compared to airline 2? (a) What are the null and alternative hypotheses? Carry out an appropriate test using a significance level of 0.01. Ho: P 3 (a) What are the null and alternative hypotheses? HA: P = * 0.08 Ho: P -0.1143 # (b) What is the test statistic? (Round your answer to 2 decimal places, if needed.) HA: P =+ 0.0 (c) Using the statistical table, what is the p-value? (Round your answer to 4 decimal places, if needed.) (b) What is the test statistic? (Round your answer to 2 decimal places, if needed.) (d) Based on the p-value, what can you conclude? (c) Using the statistical table, what is the p-value? (Round your answer to 4 decimal places, if O There is about a 18.68% chance that the two proportions are equal. needed.] O If there is no difference in the proportions, there is about a 9.34% chance of seeing the observed difference or larger (as extreme or more extreme) by natural sampling variation. There is about a 18.68% chance that the two proportions are unequal. O If there is no difference in the proportions, there is about a 9.34% chance of seeing the (d) Based on the p-value, fail to reject * the null hypothesis. exact observe If there is no difference in the prog ortions, there is about a 18.68% chance of seeing the observed difference or larger (as extreme or more extreme) by natural sampling variation