please help me with part e and draw the graph too. and numbers 1 and 2z
this is all i have
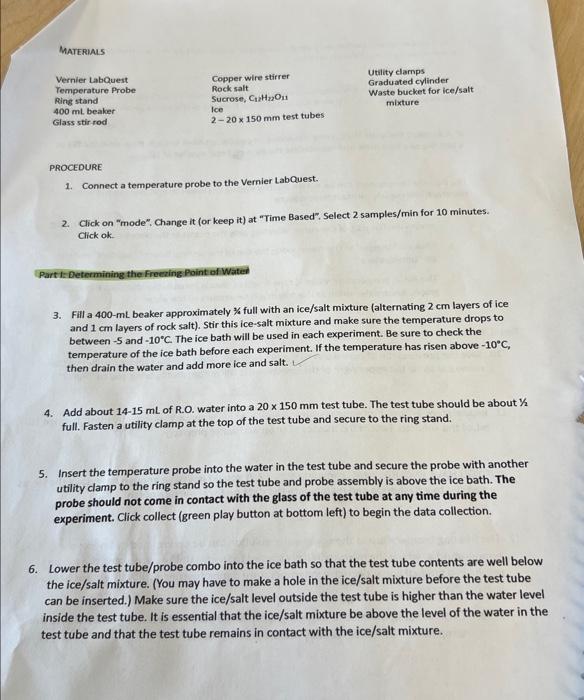
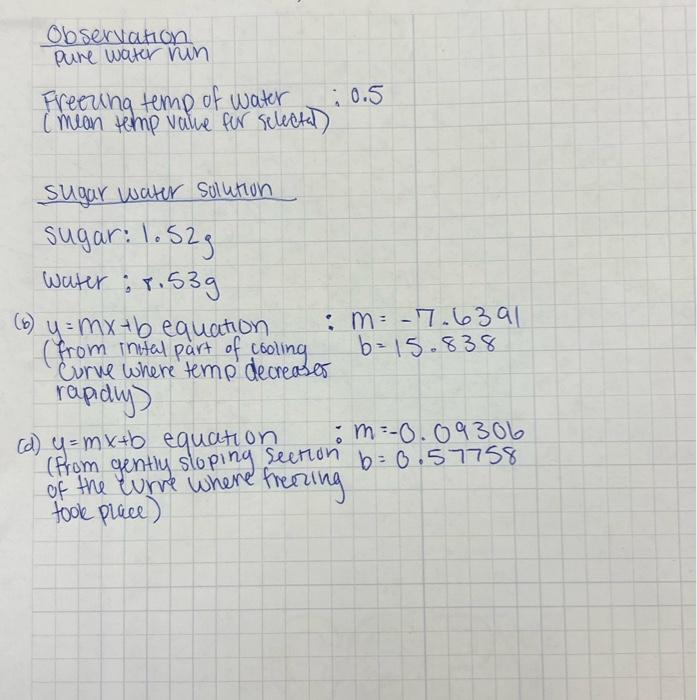
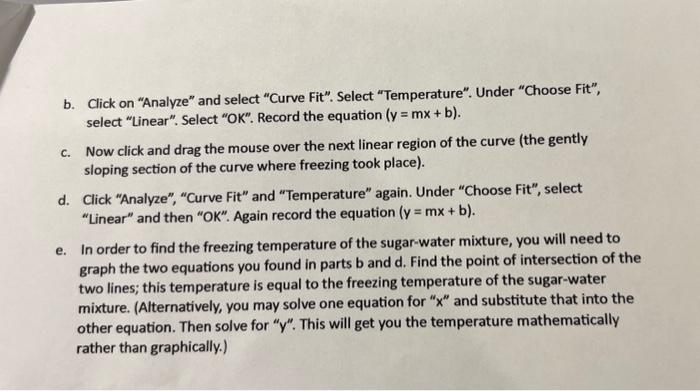
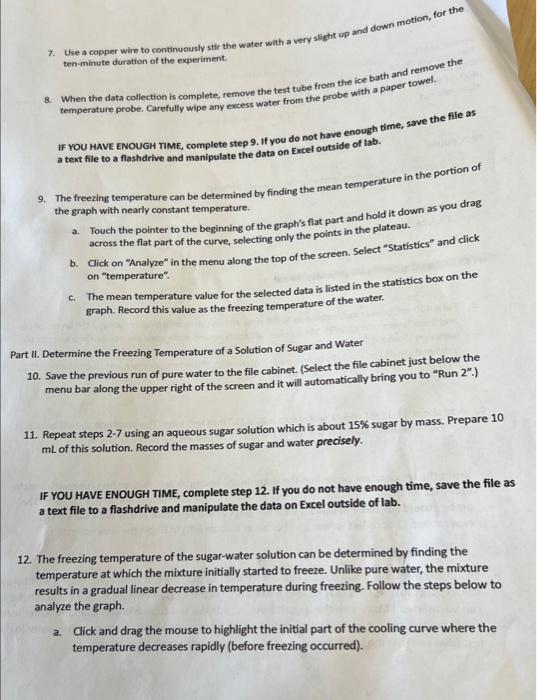
observation pure water num Freezing temp of water :0.5 (mean temp value for selecta)) sugar water solution sugar: 1.52g water: 8.53g (6) y=mx+b equation : m=7.6391 (from inttal part of cooling b=15.838 curve where temp decreases rapidiy) (d) y=mx+b equation : m=0.09306 (from gently sloping section b=0.57758 of the curve where freering took place) b. Click on "Analyze" and select "Curve Fit". Select "Temperature". Under "Choose Fit", select "Linear". Select "OK". Record the equation (y=mx+b). c. Now click and drag the mouse over the next linear region of the curve (the gently sloping section of the curve where freezing took place). d. Click "Analyze", "Curve Fit" and "Temperature" again. Under "Choose Fit", select "Linear" and then "OK". Again record the equation (y=mx+b). e. In order to find the freezing temperature of the sugar-water mixture, you will need to graph the two equations you found in parts b and d. Find the point of intersection of the two lines; this temperature is equal to the freezing temperature of the sugar-water mixture. (Alternatively, you may solve one equation for " x " and substitute that into the other equation. Then solve for " y ". This will get you the temperature mathematically rather than graphically.) 13. Print appropriately labeled graphs showing both trials. Data Analysis 1. Using the collected data, calculate the experimental molar mass of sucrose. 2. Calculate the percent error of the experimental molecular weight. PROCEDURE 1. Connect a temperature probe to the Vernier LabQuest. 2. Click on "mode". Change it (or keep it) at "Time Based". Select 2 samples/min for 10 minutes. Click ok. Part Is Determining the Freeting Point of Wated 3. Fill a 400-mL beaker approximately % full with an ice/salt mixture (alternating 2cm layers of ice and 1cm layers of rock salt). Stir this ice-salt mixture and make sure the temperature drops to between 5 and 10C. The ice bath will be used in each experiment. Be sure to check the temperature of the ice bath before each experiment. If the temperature has risen above 10C, then drain the water and add more ice and salt. 4. Add about 14-15 mL of R.O. water into a 20150mm test tube. The test tube should be about 1/2 full. Fasten a utility clamp at the top of the test tube and secure to the ring stand. 5. Insert the temperature probe into the water in the test tube and secure the probe with another utility clamp to the ring stand so the test tube and probe assembly is above the ice bath. The probe should not come in contact with the glass of the test tube at any time during the experiment. Click collect (green play button at bottom left) to begin the data collection. 6. Lower the test tube/probe combo into the ice bath so that the test tube contents are well below the ice/salt mixture. (You may have to make a hole in the ice/salt mixture before the test tube can be inserted.) Make sure the ice/salt level outside the test tube is higher than the water level inside the test tube. It is essential that the ice/salt mixture be above the level of the water in the test tube and that the test tube remains in contact with the ice/salt mixture. 7. Use a copper wire to continuously stir the water with a very slight up and dowirs ten-minute duration of the experiment. 8. When the data collection is complete, remove the test tube from the ice bath and remove the temperature probe. Carefully wipe any excess water from the probe with a paper towel. If YOU HAVE ENOUGH TIME, complete step 9. If you do not have enough time, save the file as a text file to a flashdrive and manipulate the data on Excel outside of lab. 9. The freezing temperature can be determined by finding the mean temperature in the portion of the graph with nearly constant temperature. a. Touch the pointer to the beginning of the graph's fiat part and hold it down as you drag across the flat part of the curve, selecting only the points in the plateau. b. Click on "Analyze" in the menu along the top of the screen. Select "Statistics" and click on "temperature". c. The mean temperature value for the selected data is listed in the statistics box on the graph. Record this value as the freezing temperature of the water. Part 11. Determine the Freezing Temperature of a Solution of Sugar and Water 10. Save the previous run of pure water to the file cabinet. (Select the file cabinet just below the menu bar along the upper right of the screen and it will automatically bring you to "Run 2".) 11. Repeat steps 27 using an aqueous sugar solution which is about 15% sugar by mass. Prepare 10 mL of this solution. Record the masses of sugar and water precisely. IF YOU HAVE ENOUGH TIME, complete step 12. If you do not have enough time, save the file as a text file to a flashdrive and manipulate the data on Excel outside of lab. 12. The freezing temperature of the sugar-water solution can be determined by finding the temperature at which the mixture initially started to freeze. Unlike pure water, the mixture results in a gradual linear decrease in temperature during freezing. Follow the steps below to analyze the graph. a. Cick and drag the mouse to highlight the initial part of the cooling curve where the temperature decreases rapidly (before freezing occurred). observation pure water num Freezing temp of water :0.5 (mean temp value for selecta)) sugar water solution sugar: 1.52g water: 8.53g (6) y=mx+b equation : m=7.6391 (from inttal part of cooling b=15.838 curve where temp decreases rapidiy) (d) y=mx+b equation : m=0.09306 (from gently sloping section b=0.57758 of the curve where freering took place) b. Click on "Analyze" and select "Curve Fit". Select "Temperature". Under "Choose Fit", select "Linear". Select "OK". Record the equation (y=mx+b). c. Now click and drag the mouse over the next linear region of the curve (the gently sloping section of the curve where freezing took place). d. Click "Analyze", "Curve Fit" and "Temperature" again. Under "Choose Fit", select "Linear" and then "OK". Again record the equation (y=mx+b). e. In order to find the freezing temperature of the sugar-water mixture, you will need to graph the two equations you found in parts b and d. Find the point of intersection of the two lines; this temperature is equal to the freezing temperature of the sugar-water mixture. (Alternatively, you may solve one equation for " x " and substitute that into the other equation. Then solve for " y ". This will get you the temperature mathematically rather than graphically.) 13. Print appropriately labeled graphs showing both trials. Data Analysis 1. Using the collected data, calculate the experimental molar mass of sucrose. 2. Calculate the percent error of the experimental molecular weight. PROCEDURE 1. Connect a temperature probe to the Vernier LabQuest. 2. Click on "mode". Change it (or keep it) at "Time Based". Select 2 samples/min for 10 minutes. Click ok. Part Is Determining the Freeting Point of Wated 3. Fill a 400-mL beaker approximately % full with an ice/salt mixture (alternating 2cm layers of ice and 1cm layers of rock salt). Stir this ice-salt mixture and make sure the temperature drops to between 5 and 10C. The ice bath will be used in each experiment. Be sure to check the temperature of the ice bath before each experiment. If the temperature has risen above 10C, then drain the water and add more ice and salt. 4. Add about 14-15 mL of R.O. water into a 20150mm test tube. The test tube should be about 1/2 full. Fasten a utility clamp at the top of the test tube and secure to the ring stand. 5. Insert the temperature probe into the water in the test tube and secure the probe with another utility clamp to the ring stand so the test tube and probe assembly is above the ice bath. The probe should not come in contact with the glass of the test tube at any time during the experiment. Click collect (green play button at bottom left) to begin the data collection. 6. Lower the test tube/probe combo into the ice bath so that the test tube contents are well below the ice/salt mixture. (You may have to make a hole in the ice/salt mixture before the test tube can be inserted.) Make sure the ice/salt level outside the test tube is higher than the water level inside the test tube. It is essential that the ice/salt mixture be above the level of the water in the test tube and that the test tube remains in contact with the ice/salt mixture. 7. Use a copper wire to continuously stir the water with a very slight up and dowirs ten-minute duration of the experiment. 8. When the data collection is complete, remove the test tube from the ice bath and remove the temperature probe. Carefully wipe any excess water from the probe with a paper towel. If YOU HAVE ENOUGH TIME, complete step 9. If you do not have enough time, save the file as a text file to a flashdrive and manipulate the data on Excel outside of lab. 9. The freezing temperature can be determined by finding the mean temperature in the portion of the graph with nearly constant temperature. a. Touch the pointer to the beginning of the graph's fiat part and hold it down as you drag across the flat part of the curve, selecting only the points in the plateau. b. Click on "Analyze" in the menu along the top of the screen. Select "Statistics" and click on "temperature". c. The mean temperature value for the selected data is listed in the statistics box on the graph. Record this value as the freezing temperature of the water. Part 11. Determine the Freezing Temperature of a Solution of Sugar and Water 10. Save the previous run of pure water to the file cabinet. (Select the file cabinet just below the menu bar along the upper right of the screen and it will automatically bring you to "Run 2".) 11. Repeat steps 27 using an aqueous sugar solution which is about 15% sugar by mass. Prepare 10 mL of this solution. Record the masses of sugar and water precisely. IF YOU HAVE ENOUGH TIME, complete step 12. If you do not have enough time, save the file as a text file to a flashdrive and manipulate the data on Excel outside of lab. 12. The freezing temperature of the sugar-water solution can be determined by finding the temperature at which the mixture initially started to freeze. Unlike pure water, the mixture results in a gradual linear decrease in temperature during freezing. Follow the steps below to analyze the graph. a. Cick and drag the mouse to highlight the initial part of the cooling curve where the temperature decreases rapidly (before freezing occurred)
