Please help me with these
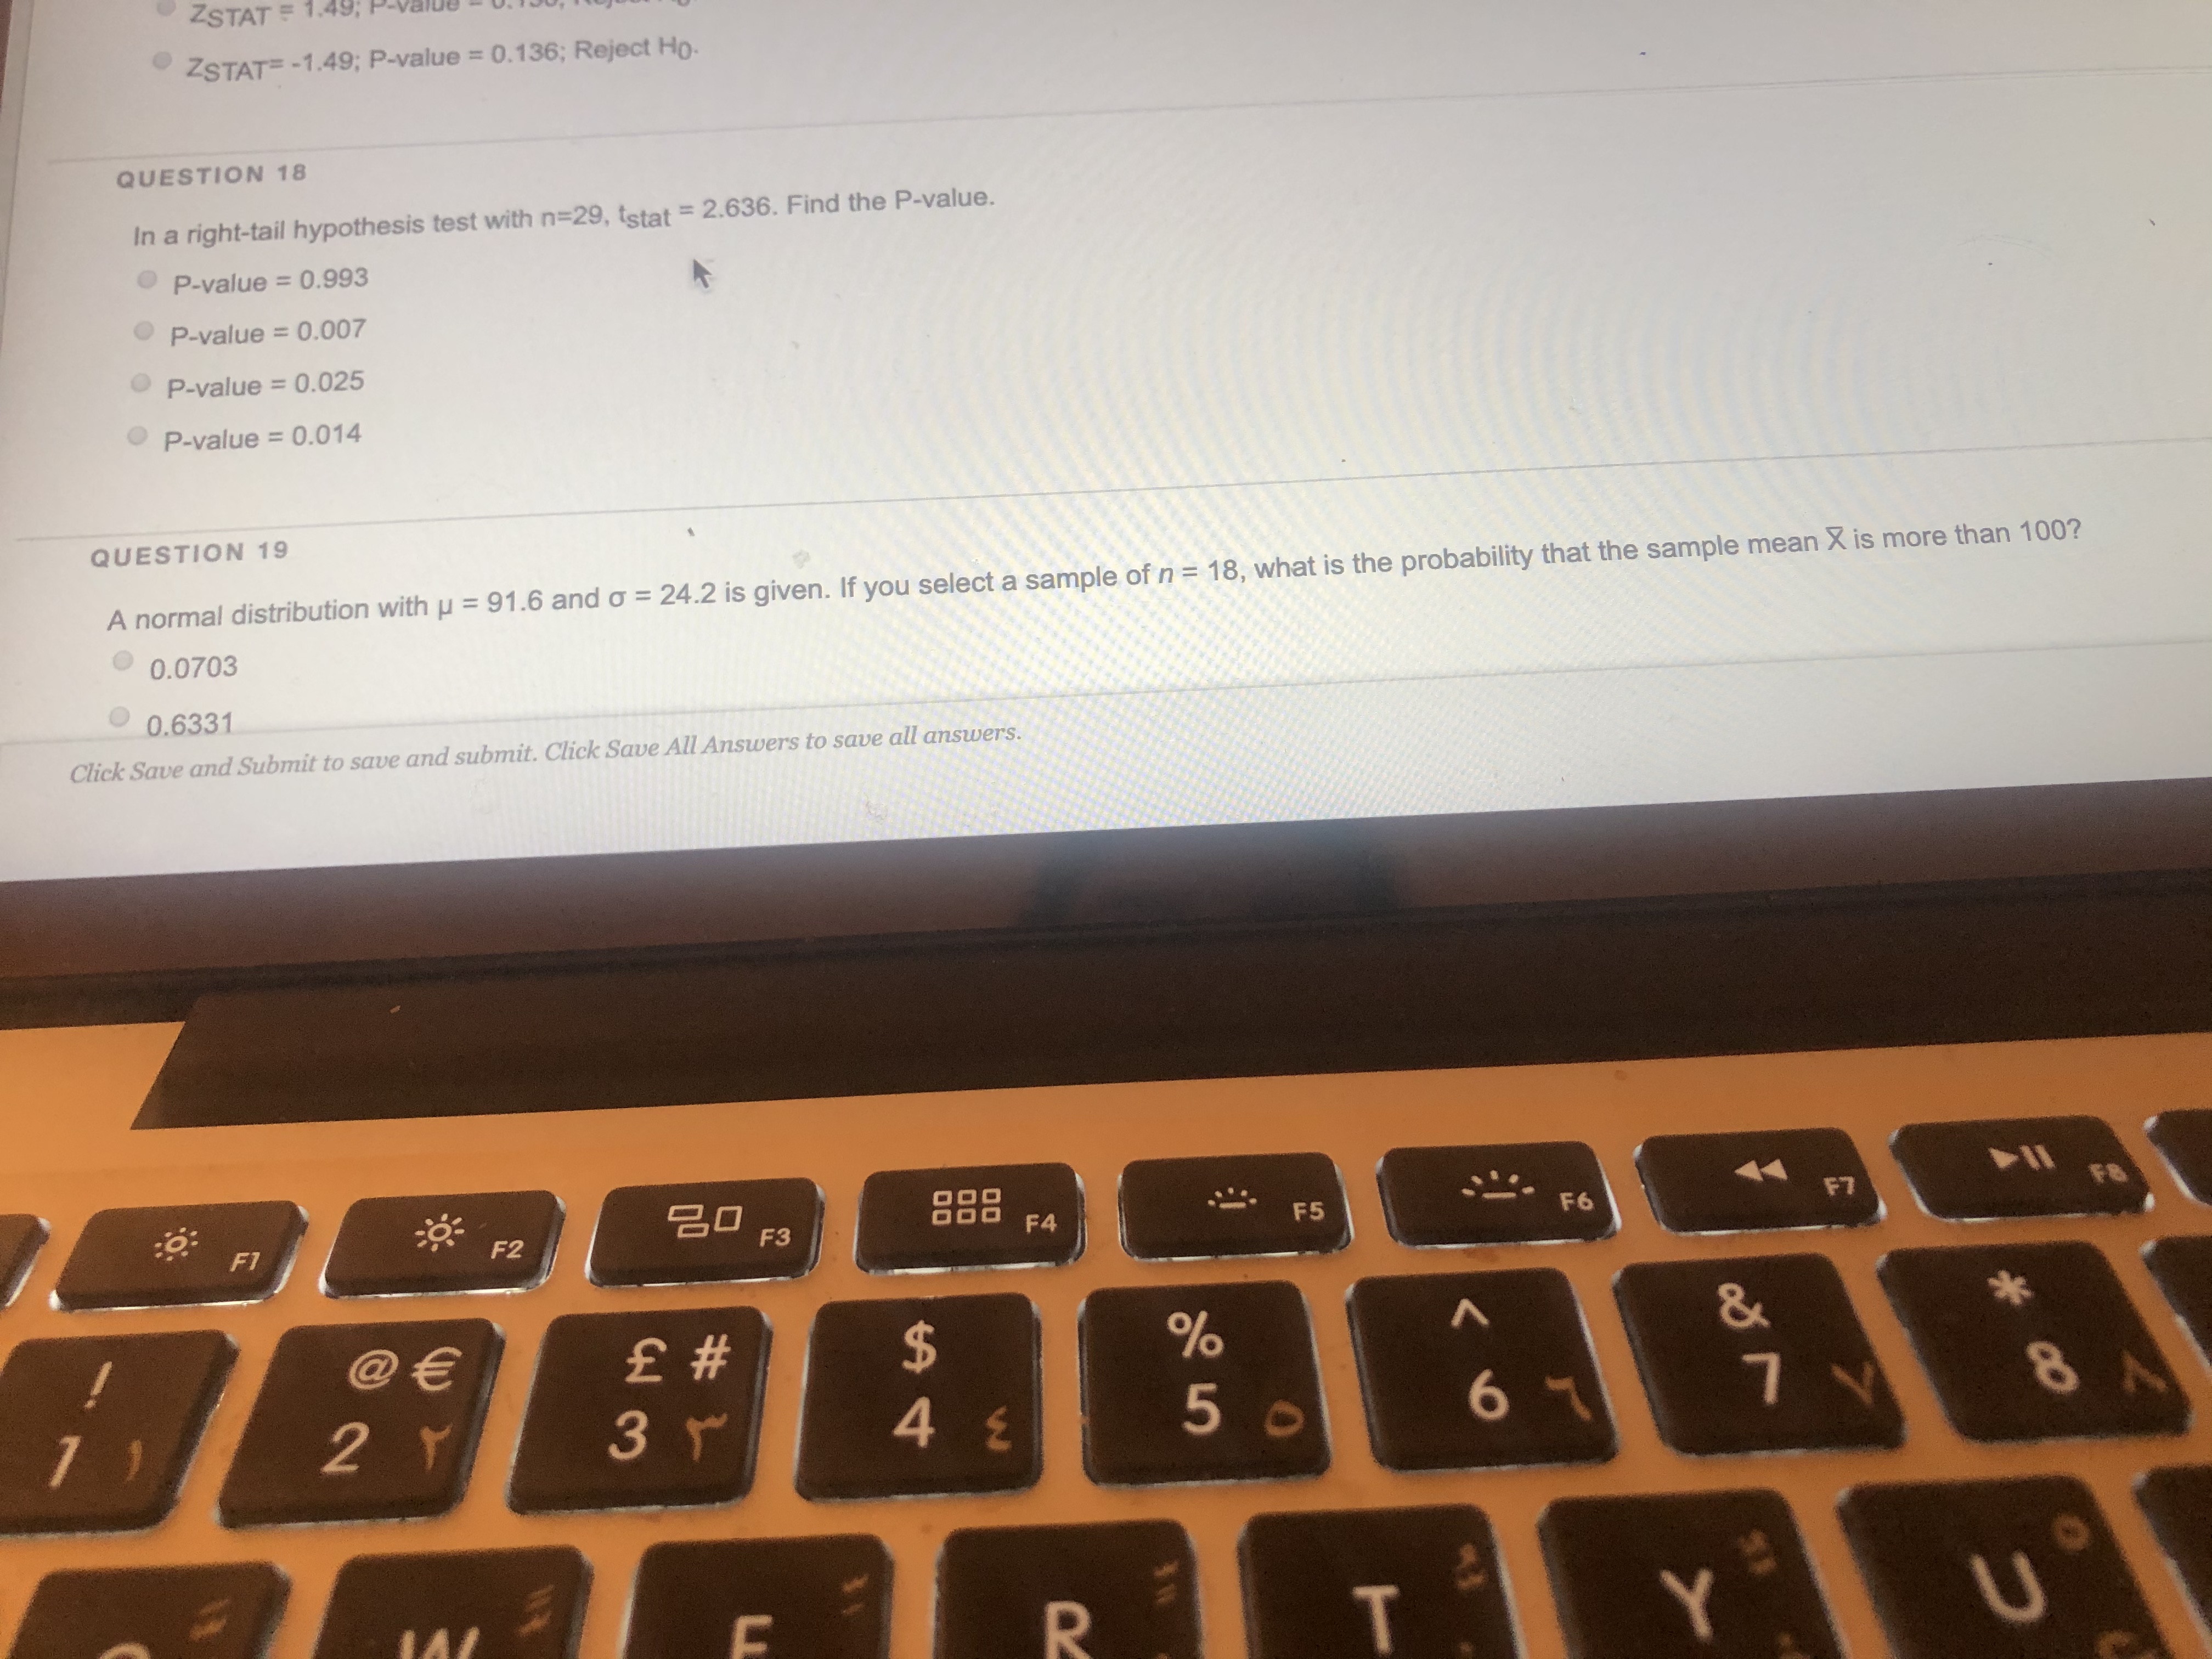
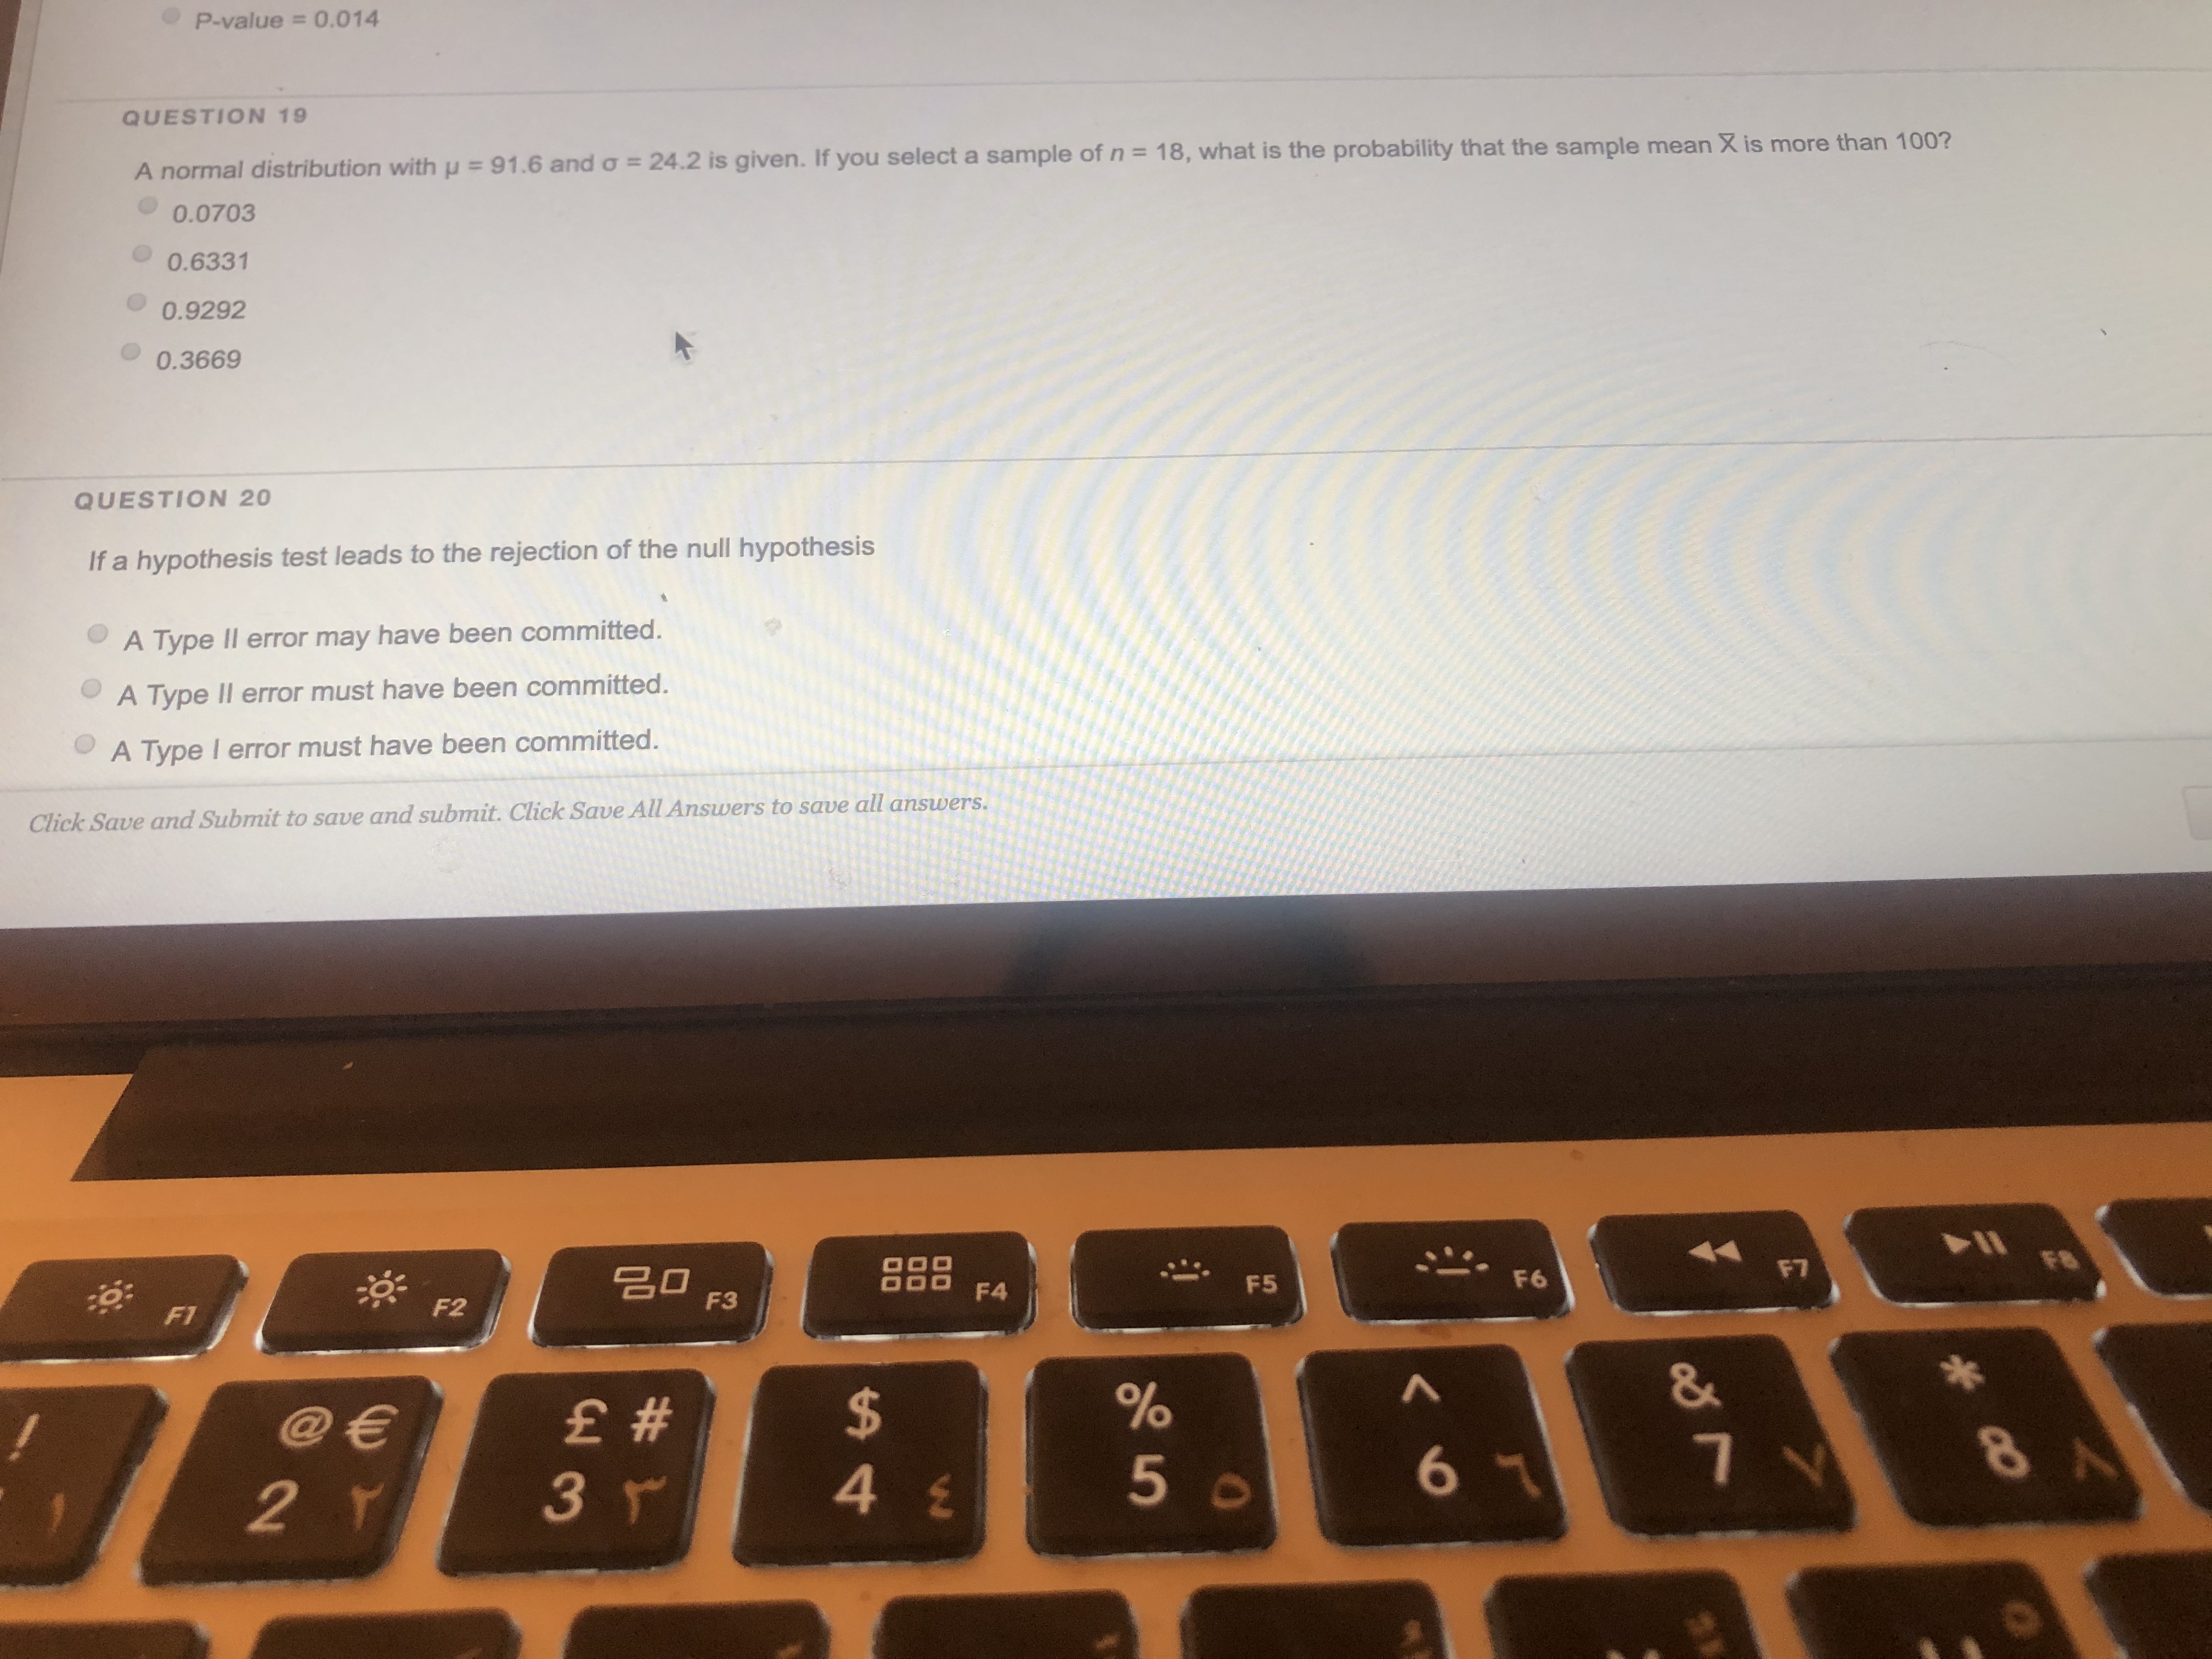
wider when the sample mean is 100 than when the sam wider for 90% confidence than for 95% confidence. wider for 99% confidence than for 95% confidence narrower for a sample size of 40 than for a sample size of 90 QUESTION 22 There is a strong linear correlation between the advertisement and sales. The marketing department expert at All Brand Shoes store in Dubai has calculated the equation of linear regression between the advertising expenditures, X (Dh1000s) and the revenue (Dh1000s) as following: Y = 98.781 + 1.548X The value 1.548 of the slope in the equation can be interpreted as . As advertising is increased by 1,000 Dhs, sales are expected to increase by 1,548 Dhs. The variation of the amounts of the sales and the advertising expenditure is 1.548%. As advertising is increased by 98.781 Dhs, sales are expected to increase by 1,548 Dhs. When nothing is spent on advertising, the sales are expected to hit 1,548 Dhs. QUESTION 23 For a sample data from a normally distributed population we have the following information: X = 60, n = 20, s = 26.1, a = 0.01 Use the P-value value approach to perform the test: HO: H = 75.5 H1: H # 75.5 tstat = -2.66; P-value = 0.015; Reject Ho. Click Save and Submit to save and submit. Click Save All Answers to save all answers. F2 GU F3 888 F4 FS F6 14 e E # $ % &0.9292 0.3669 QUESTION 20 If a hypothesis test leads to the rejection of the null hypothesis . A Type II error may have been committed. A Type II error must have been committed. A Type I error must have been committed. . A Type I error may have been committed. QUESTION 21 The width of a confidence interval estimate for a mean will be O wider when the sample mean is 100 than when the sample mean is 20. wider for 90% confidence than for 95% confidence. Click Save and Submit to save and submit. Click Save All Answers to save all answers. esc F1 F2 20 F3 000 F4 @e E # $ r 4 EA Type II error may have A Type II error must have been committed. . A Type I error must have been committed. . A Type I error may have been committed. QUESTION 21 The width of a confidence interval estimate for a mean will be O wider when the sample mean is 100 than when the sample mean is 20. O wider for 90% confidence than for 95% confidence. wider for 99% confidence than for 95% confidence. narrower for a sample size of 40 than for a sample size of 90. QUESTION 22 There is a strong linear correlation between the advertisement and sales. The marketing departme linear regression between the advertising expenditures, X (Dh1000s) and the revenue (Dh1000s) Y = 98.781 + 1.548X The value 1.548 of the slope in the equation can be interpreted as As advertising is increased by 1,000 Dhs, sales are expected to increase by 1,548 Dhs. . The variation of the amounts of the sales and the advertising expenditure is 1.548%. As advertising is increased by 98.781 Dhs. sales are expected to increase by 1.548 Dhs. Click Save and Submit to save and submit. Click Save All Answers to save all answers. esc F1 F2 20 F3 F4 @E E # % 2 Y 3 r A E 5The value 1.548 of the slope in the equation can be interpreted as As advertising is increased by 1,000 Dhs, sales are expected to increase by 1,548 Dhs. The variation of the amounts of the sales and the advertising expenditure is 1.548%. As advertising is increased by 98.781 Dhs, sales are expected to increase by 1,548 Dhs. .' When nothing is spent on advertising, the sales are expected to hit 1,548 Dhs. QUESTION 23 For a sample data from a normally distributed population we have the following information: X = 60, n = 20, s = 26.1, a = 0.01 Use the P-value value approach to perform the test: K HO: H = 75.5 H1: H # 75.5 tstat = -2.66; P-value = 0.015; Reject Ho. Zstat = -2.66; P-value = 0.0039; Do not reject Ho. Zstat = -2.66; P-value = 0.0078; Reject Ho. tstat = -2.66; P-value = 0.015; Do not reject Ho. QUESTION 24 Find the critical value Za/2 for finding a 84% confidence interval. Click Save and Submit to save and submit. Click Save All Answers to save all answers. FI F2 20 F3 F4 F5 F6 F7 @e E # $ % &ZSTAT = 1.49; P ZSTAT= -1.49; P-value = 0.136; Reject Ho. QUESTION 18 In a right-tail hypothesis test with n=29, tstat = 2.636. Find the P-value. P-value = 0.993 . P-value = 0.007 O P-value = 0.025 . P-value = 0.014 QUESTION 19 A normal distribution with u = 91.6 and o = 24.2 is given. If you select a sample of n = 18, what is the probability that the sample mean X is more than 100? 0 0.0703 0 0.6331 Click Save and Submit to save and submit. Click Save All Answers to save all answers. F2 20 F& F1 F3 888 F4 F5 F6 F7 # $ % 2 Y Co 4 E 5 0 6 T Y URemaining Time: 1 hour, 57 minutes, 02 seconds. estion Completion Status: The variation of the amounts of the sales and the advertising expenditure is 1.548%. As advertising is increased by 98.781 Dhs, sales are expected to increase by 1,548 Dhs. When nothing is spent on advertising, the sales are expected to hit 1,548 Dhs. QUESTION 23 For a sample data from a normally distributed population we have the following information: X = 60, n = 20, s = 26.1, a = 0.01 Use the P-value value approach to perform the test: HO: H = 75.5 H1: H # 75.5 tstat = -2.66; P-value = 0.015; Reject Ho. . Zstat = =2.66; P-value = 0.0039; Do not reject Ho Zstat = -2.66; P-value = 0.0078; Reject Ho. . tstat = -2.66; P-value = 0.015; Do not reject Ho. QUESTION 24 Find the critical value Za/2 for finding a 84% confidence interval. O -2.41 1.405 O 2.41 0 0.99 Click Save and Submit to save and submit. Click Save All Answers to save all answers. esc F1 F2 20 F3 F4 FS @E E # % A 2 Y 3 5 4 5OP-value = 0.014 QUESTION 19 A normal distribution with u = 91.6 and o = 24.2 is given. If you select a sample of n = 18, what is the probability that the sample mean X is more than 100? 0.0703 0.6331 0.9292 0.3669 QUESTION 20 If a hypothesis test leads to the rejection of the null hypothesis A Type II error may have been committed. A Type II error must have been committed. A Type I error must have been committed. Click Save and Submit to save and submit. Click Save All Answers to save all answers. 888 44 F7 F4 F5 F6 F1 F2 F3 K @ E E # $ % 2 3 Y 4 E 5 0 6