please help me with this homework question's requirments it is really confusing me
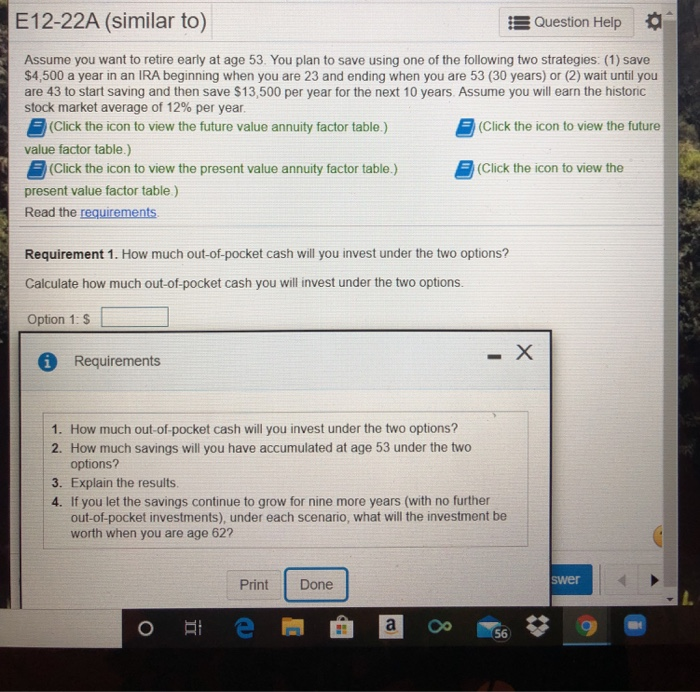
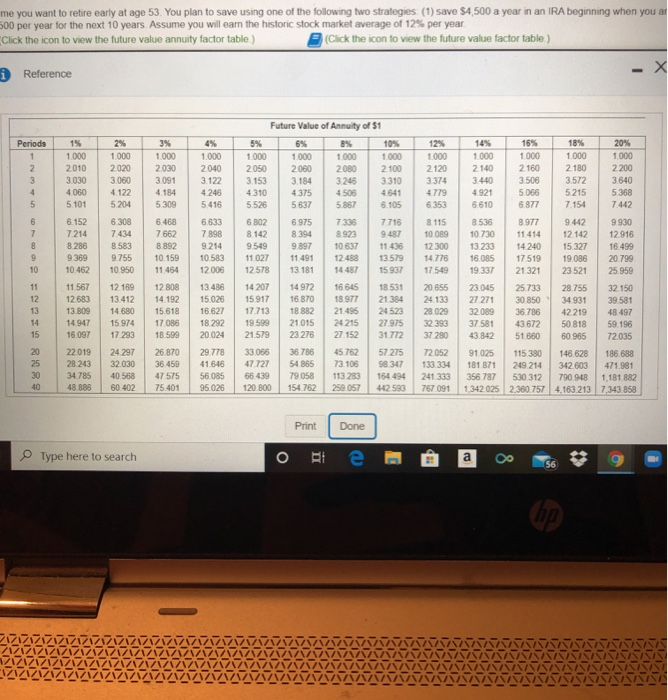
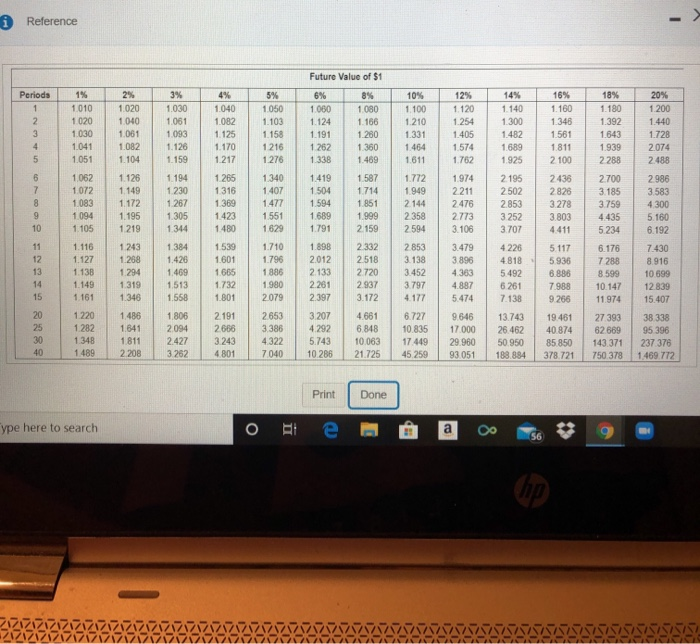
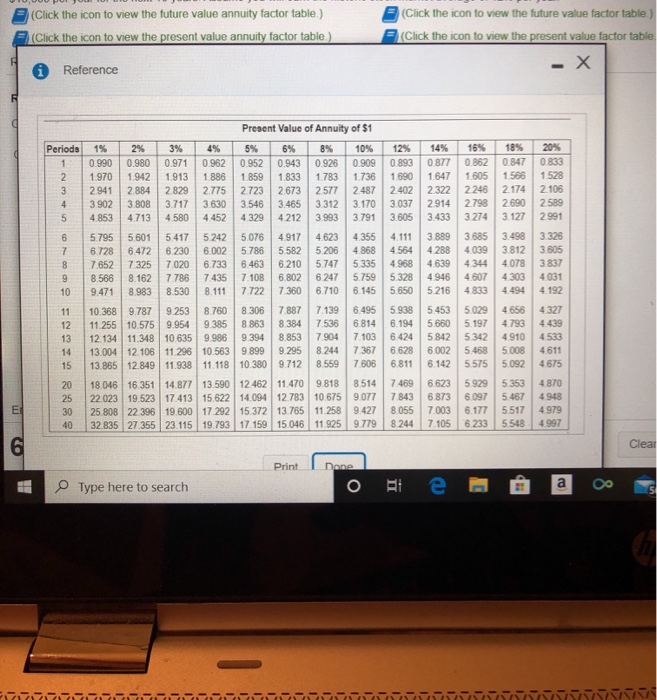
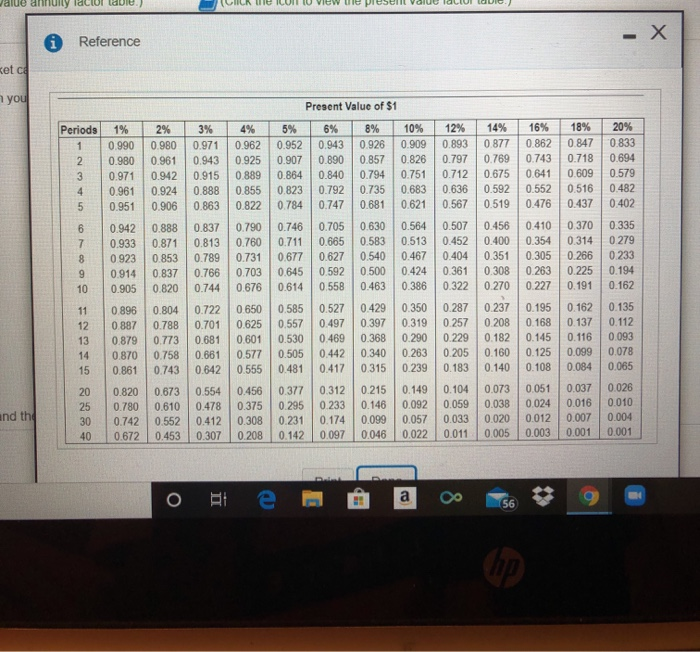
E12-22A (similar to) Question Help Assume you want to retire early at age 53. You plan to save using one of the following two strategies: (1) save $4,500 a year in an IRA beginning when you are 23 and ending when you are 53 (30 years) or (2) wait until you are 43 to start saving and then save $13,500 per year for the next 10 years. Assume you will earn the historic stock market average of 12% per year. (Click the icon to view the future value annuity factor table.) (Click the icon to view the future value factor table.) (Click the icon to view the present value annuity factor table.) (Click the icon to view the present value factor table) Read the requirements Requirement 1. How much out-of-pocket cash will you invest under the two options? Calculate how much out-of-pocket cash you will invest under the two options. Option 1: $ Requirements 1. How much out-of-pocket cash will you invest under the two options? 2. How much savings will you have accumulated at age 53 under the two options? 3. Explain the results. 4. If you let the savings continue to grow for nine more years (with no further out-of-pocket investments), under each scenario, what will the investment be worth when you are age 62? Print Done swer El O e 56 me you want to retire early at age 53. You plan to save using one of the following two strategies (1) save $4,500 a year in an IRA beginning when you ar 500 per year for the next 10 years. Assume you will earn the historic stock market average of 12% per year Click the icon to view the future value annuity factor table) (Click the icon to view the future value factor table) i Reference -X Periods 2 3 4 5 1% 1.000 2010 3.030 4.060 5 101 2% 1.000 2020 3.060 4.122 5204 3% 1.000 2.030 3.091 4.184 5309 6.468 7662 8.892 10.159 11.454 1.000 2040 3.122 4246 5.416 12% 1.000 2120 3.374 4779 6.353 6 8 9 6.152 7214 8.286 9369 10.462 6.308 7434 8583 9.755 10.950 Future Value of Annuity of $1 5% 8% 10% 1000 1.000 1 000 1.000 2050 2060 2080 2100 3.153 3.184 3246 3.310 4.310 4375 4508 4641 5.526 5.637 5.867 6.105 6 802 6.975 7335 7716 8142 8394 8.923 9549 9.897 10 637 11.436 11.027 11.491 12488 13.579 12578 13 181 14487 15 937 14 207 14 972 16 645 18531 15 917 16870 18 977 21.384 17.713 18882 21496 24523 19 599 21 015 24 215 27.975 21579 23 276 27.152 31.772 33066 36786 45.762 57 275 47.727 54 865 73.106 98 347 66 439 79 058 113 283 164 494 120 800 154.762 25.057 442 593 8 115 10 089 12 300 14778 17 549 10 14% 16% 18% 20% 1.000 1000 1.000 1.000 2140 2160 2. 180 2200 3.440 3.506 3.572 3.640 4.921 5.066 5215 5.368 6.610 6.877 7.154 7.442 8.536 8 977 9.442 9930 10730 11414 12 142 12 916 13.233 14 240 15.327 16.499 16.085 17519 19.086 20.799 19.337 21.321 23.521 25.959 23.045 25.733 28.755 32.150 27 271 30 850 34 931 39.581 32089 36.786 42 219 48.497 37581 43672 50 818 59 196 43.842 51 660 60.965 72035 91025 115.380 146.628 186.688 181 871 249 214 342.603 471.981 356 787 530 312 790 948 1,181 882 1.342.025 2,360.757 4.163.213 7.343.858 11 12 13 14 15 11 567 12683 13.809 14 947 16.097 6.633 7898 9214 10.583 12006 13 486 15.026 16.627 18 292 20.024 29.778 41.646 56085 95.026 12 169 13.412 14.680 15 974 17.293 24 297 32.030 40.568 60.402 12 808 14.192 15 618 17.086 18599 20 655 24.133 28.029 32 393 37 280 20 25 30 40 22.019 28 243 34.785 48,888 26.870 36.459 47 575 75.401 72.052 133.334 241 333 767091 Print Done Type here to search OBI e FBD a 8 g 56 i Reference Future Value of $1 Periods 1 2 3 4 5 1% 1,010 1.020 1.030 1.041 1.051 2% 1.020 1.040 1.061 1.082 1.104 3% 1.030 1.061 1.093 1.126 1.159 4% 1.040 1.082 1.125 1.170 1.217 5% 1.050 1.103 1.158 1216 1276 6% 1.000 1.124 1.191 1262 1338 8% 1.080 1.166 1.280 1.360 1.469 10% 1.100 1.210 1.331 1.464 1.611 12% 1. 120 1.254 1.405 1.574 1.762 1.974 2211 2476 2.773 3.106 14% 1.140 1.300 1.482 1.689 1.925 16% 1.160 1.348 1.561 1.811 2 100 18% 1.180 1.392 1.643 1.939 2 288 20% 1.200 1.440 1728 2.074 2.488 6 7 1062 1072 1,083 1,094 1.105 8 9 10 1.126 1.149 1.172 1.195 1219 1194 1 230 1.267 1.305 1 344 1 265 1316 1.369 1.423 1.480 1.340 1.407 1.477 1.551 1629 1.419 1 504 1.594 1.772 1.949 2.144 2358 2594 2 195 2502 2.853 3.252 3.707 2436 2826 3.278 3.803 4411 2.700 3.185 3.759 4.435 5.234 1.689 1587 1714 1.851 1.999 2159 2332 2.518 2720 2.937 3.172 11 12 13 14 15 1.116 1.127 1.138 1.149 1.161 1 243 1.288 1 294 1.319 1.346 1.384 1.426 1.469 1.513 1.558 1539 1.601 1.665 1.732 1.801 1.791 1.898 2012 2 133 2.261 2.397 1.710 1.796 1886 1980 2079 2853 3.138 3.452 3.797 4.177 6.727 10.835 17 449 45.259 3.479 3.896 4.363 4.887 5.474 4226 4.818 5.492 6.261 7.138 13.743 26.462 50.950 188,884 5 117 5936 8.888 7.988 9266 6.176 7 288 8.599 10.147 11.974 27 393 62.669 143.371 750 378 2.986 3.583 4300 5.160 6 192 7.430 8.916 10 599 12.839 15.407 38 338 95 396 237376 1.469.772 20 25 30 40 1.220 1 282 1.348 1.489 1.486 1.641 1.811 2208 1.806 2094 2427 3262 2.191 2686 3.243 4.801 2653 3.386 4322 7040 3.207 4.292 5.743 10.286 4.661 6.848 10.063 21.725 9.646 17.000 29.960 93051 19.461 40.874 85.850 378.721 Print Done ype here to search o i e a 8 56 (Click the icon to view the future value annuity factor table.) (Click the icon to view the present value annuity factor table.) (Click the icon to view the future value factor table.) (Click the icon to view the present value factor table - X Reference F d Periods 5% 1 2 12% 0.893 1.690 2.402 3.037 3.605 14% 0877 1.647 2322 2914 3.433 18% 0.847 1.566 2.174 2690 3.127 20% 0833 1.528 2.106 2589 2 991 4 16% 0.862 1.605 2 246 2.798 3 274 3.685 4.039 4 344 4.607 4.833 5 Present Value of Annuity of $1 1% 2% 3% 4% 6% 8% 10% 0.990 0.980 0.971 0.962 0.952 0.943 0.926 0.909 1.970 1.942 1913 1.886 1.859 1.833 1.783 1.736 2941 2 884 2.829 2.775 2.723 2.673 2577 2.487 3.902 3.808 3.717 3.630 3.546 3.465 3.312 3.170 4 853 4.713 4.580 4452 4329 4212 3993 3.791 5.795 5.601 5.417 5.242 5.076 4.917 4.623 4.355 6.728 6.472 6.230 6.002 5786 5582 5.206 4.868 7,652 7325 7.020 6.733 6.463 6.210 5.747 5.335 8.566 8.162 7.786 7435 7.108 6.802 6.247 5.759 9.471 8.983 8.530 8.111 7.722 7360 6.710 6.145 10.368 9.787 9.253 8.760 8 306 7.887 7.139 6.495 11.255 10.575 9.954 9.385 8863 8.384 7.536 6.814 12.134 11.348 10.635 9.988 9 394 8.853 7.904 7.103 13.004 12 106 11.296 10.563 9.899 9.295 8.244 7.367 13.865 12.849 11.938 11.118 10.380 9.712 8.559 7.606 18.046 16.351 14.877 13.590 12.462 11.470 9818 8.514 22.023 19.523 17.413 15.622 14.094 12.783 10.675 9.077 25 808 22 396 19.600 17.292 15 372 13.765 11.258 9.427 32.835 27.355 23.115 19.793 17.159 15.046 11.925 9.779 6 7 8 9 10 4.111 4564 4968 5328 5.650 3 889 4 288 4639 4.946 5 216 3.498 3.812 4078 4 303 4.494 3.325 3.605 3837 4.031 4.192 11 12 13 14 15 5938 6.194 6.424 6.628 6.811 5.453 5.029 5.660 5.197 5842 5.342 6.002 5.468 6.142 5.575 4656 4.793 4910 5.008 4327 4.439 4533 4611 4.675 5092 20 25 30 40 7.469 7.843 8.055 8.244 6.623 6.873 7.003 7.105 5.929 6.097 6.177 6 233 5.353 5.467 5.517 5.548 E 4.870 4.948 4979 4 997 6 Clear Print Done O a Type here to search e value nully lacto - X Reference ket ce you Present Value of $1 Periods 6% 8% 1 2 3 4 1% 0.990 0.980 0.971 0.961 0.951 2% 0.980 0.961 0.942 0.924 0.906 3% 0.971 0.943 0.915 0.888 0.863 4% 0.962 0.925 0.889 0.855 0.822 5% 0.952 0.907 0.864 0.823 0.784 0.943 0.890 0.840 0.792 0.747 0.926 0.857 0.794 0.735 0.681 10% 0.909 0.826 0.751 0.683 0.621 12% 0.893 0.797 0.712 0.636 0.567 14% 0.877 0.769 0.675 0.592 0.519 16% 0.862 0.743 0 641 0.552 0.476 18% 0.847 0.718 0.609 0.516 0.437 20% 0.833 0.694 0.579 0.482 0.402 5 6 7 8 9 10 0.888 0.871 0.853 0.837 0.820 0.837 0.813 0.789 0.766 0.744 0.790 0.760 0.731 0.703 0.676 0.746 0.711 0.677 0.645 0.614 0.705 0.665 0.627 0.592 0.558 0.630 0.583 0.540 0.500 0.463 0.564 0.513 0.467 0.424 0.386 0.507 0.452 0.404 0.361 0.322 0.456 0.400 0.351 0.308 0.270 0.410 0.354 0.305 0.263 0.227 0.370 0.314 0.266 0.225 0.191 0.335 0.279 0.233 0.194 0.162 0.942 0.933 0.923 0.914 0.905 0.896 0.887 0.879 0.870 0.861 11 12 13 14 15 0.804 0.788 0.773 0.758 0.743 0.722 0.701 0.681 0.661 0.642 0.650 0.625 0.601 0.577 0.555 0.585 0.557 0.530 0.505 0.481 0.527 0.497 0.469 0.442 0.417 0.429 0.397 0.368 0.340 0.315 0.350 0.319 0.290 0.263 0.239 0.287 0.257 0.229 0.205 0.183 0.237 0.208 0.182 0.160 0.140 0.195 0.168 0.145 0.125 0.108 0.162 0.137 0.116 0.099 0.084 0.135 0.112 0.093 0.078 0.065 and the 20 25 30 40 0.820 0.780 0.742 0.672 0.673 0.610 0.552 0.453 0.554 0.478 0.412 0.307 0.456 0.375 0.308 0.208 0.377 0.295 0.231 0.142 0.312 0.233 0.174 0.097 0.215 0.146 0.099 0.046 0.149 0.092 0.057 0.022 0.104 0.059 0.033 0.011 0.073 0.038 0.020 0.005 0.051 0.024 0.012 0.003 0.037 0.016 0.007 0.001 0.026 0.010 0.004 0.001 o e a 56