Answered step by step
Verified Expert Solution
Link Copied!

Question

1 Approved Answer

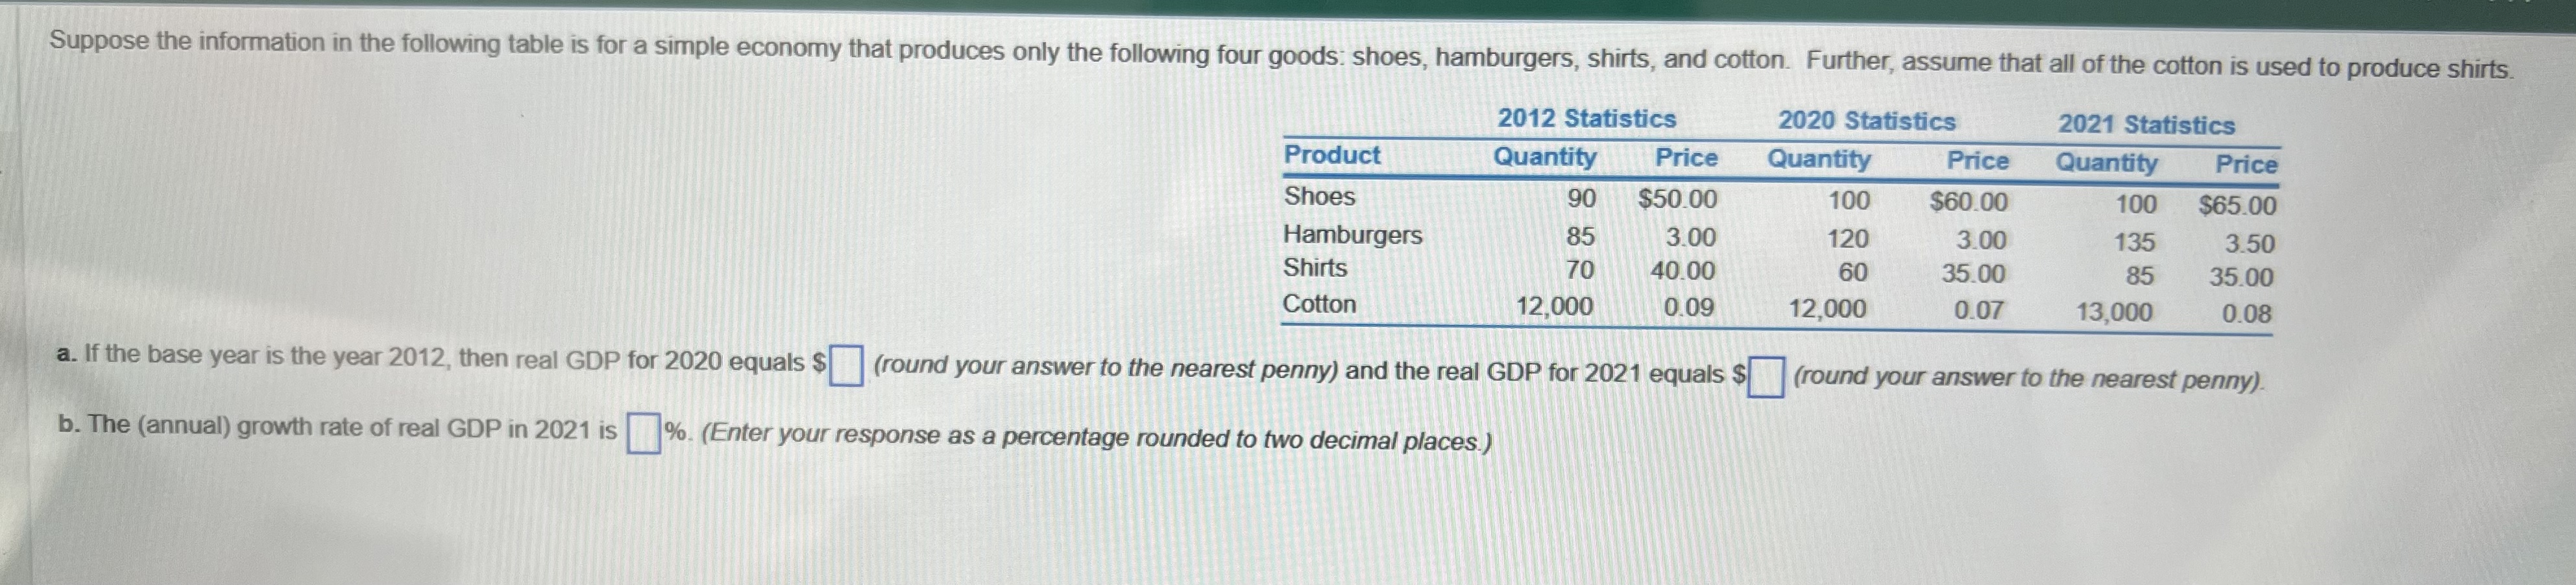
Please help me with this question as soon as possible. Thank you so much! Question 1: Suppose the information in the following table is for

image text in transcribed

Please help me with this question as soon as possible. Thank you so much!

Question 1:

image text in transcribed
Suppose the information in the following table is for a simple economy that produces only the following four goods: shoes, hamburgers, shirts, and cotton. Further, assume that all of the cotton is used to produce shirts. 2012 Statistics 2020 Statistics 2021 Statistics Product Quantity Price Quantity Price Quantity Price Shoes 90 $50.00 100 $60.00 100 $65.00 Hamburgers 85 3.00 120 3.00 135 3.50 Shirts 70 40.00 60 35.00 85 35.00 Cotton 12,000 0.09 12,000 0.07 13,000 0.08 a. If the base year is the year 2012, then real GDP for 2020 equals $ (round your answer to the nearest penny) and the real GDP for 2021 equals $ (round your answer to the nearest penny). b. The (annual) growth rate of real GDP in 2021 is |%. (Enter your response as a percentage rounded to two decimal places.)

Step by Step Solution

There are 3 Steps involved in it

Step: 1

blur-text-image

Get Instant Access to Expert-Tailored Solutions

See step-by-step solutions with expert insights and AI powered tools for academic success

Step: 2

blur-text-image

Step: 3

blur-text-image

Ace Your Homework with AI

Get the answers you need in no time with our AI-driven, step-by-step assistance

Get Started

Recommended Textbook for

International Macroeconomics

Authors: Robert C. Feenstra, Alan M. Taylor

Fourth Edition

1319061729, 978-1319061722

More Books

Students also viewed these Economics questions