Please help me with this question:
 using the template below:
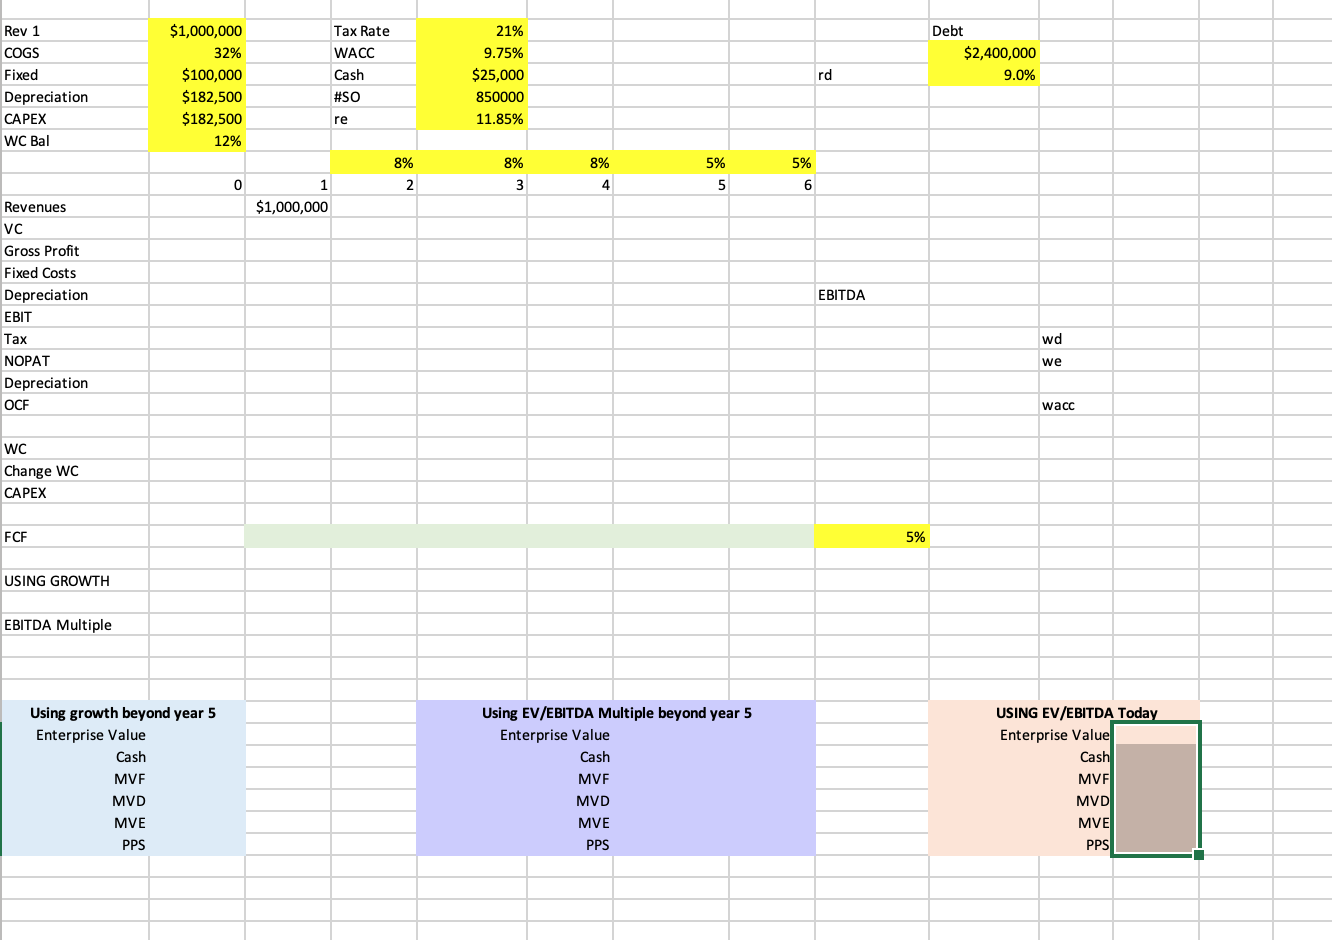
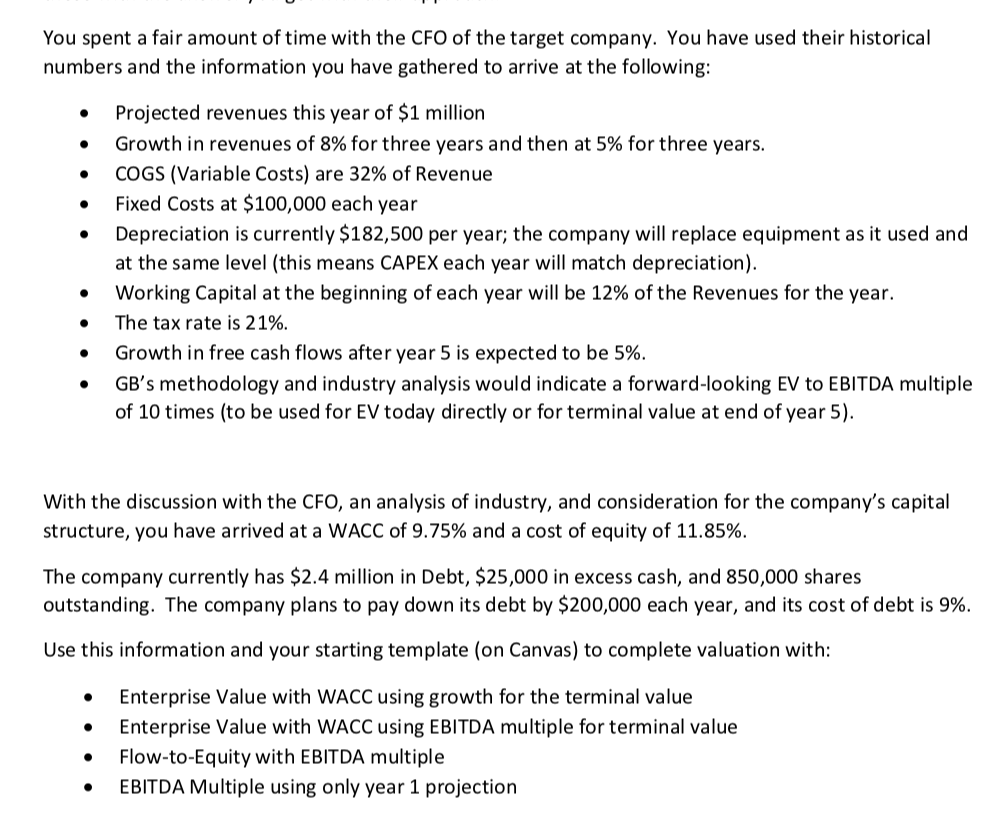
You spent a fair amount of time with the CFO of the target company. You have used their historical numbers and the information you have gathered to arrive at the following: Projected revenues this year of $1 million Growth in revenues of 8% for three years and then at 5% for three years. COGS (Variable Costs) are 32% of Revenue Fixed Costs at $100,000 each year Depreciation is currently $182,500 per year; the company will replace equipment as it used and at the same level (this means CAPEX each year will match depreciation). Working Capital at the beginning of each year will be 12% of the Revenues for the year. The tax rate is 21%. Growth in free cash flows after year 5 is expected to be 5%. GB's methodology and industry analysis would indicate a forward-looking EV to EBITDA multiple of 10 times (to be used for EV today directly or for terminal value at end of year 5). With the discussion with the CFO, an analysis of industry, and consideration for the company's capital structure, you have arrived at a WACC of 9.75% and a cost of equity of 11.85%. The company currently has $2.4 million in Debt, $25,000 in excess cash, and 850,000 shares outstanding. The company plans to pay down its debt by $200,000 each year, and its cost of debt is 9%. Use this information and your starting template (on Canvas) to complete valuation with: Enterprise Value with WACC using growth for the terminal value Enterprise Value with WACC using EBITDA multiple for terminal value Flow-to-Equity with EBITDA multiple EBITDA Multiple using only year 1 projection Rev 1 COGS Fixed Depreciation CAPEX WC Bal $1,000,000 32% $100,000 $182,500 $182,500 12% Tax Rate WACC Cash #SO Debt $2,400,000 9.0% 21% 9.75% $25,000 850000 11.85% 8% 8% 5% 5% 8% 2 0 3 6 $1,000,000 EBITDA Revenues vc Gross Profit Fixed Costs Depreciation EBIT Tax NOPAT Depreciation OCF wd we wacc WC Change WC CAPEX FCF 5% USING GROWTH EBITDA Multiple Using growth beyond year 5 Enterprise Value Cash MVE MVD MVE PPS Using EV/EBITDA Multiple beyond year 5 Enterprise Value Cash MVE MVD USING EV/EBITDA Today Enterprise Value Cash MVE MVD MVE PPS MVE PPS You spent a fair amount of time with the CFO of the target company. You have used their historical numbers and the information you have gathered to arrive at the following: Projected revenues this year of $1 million Growth in revenues of 8% for three years and then at 5% for three years. COGS (Variable Costs) are 32% of Revenue Fixed Costs at $100,000 each year Depreciation is currently $182,500 per year; the company will replace equipment as it used and at the same level (this means CAPEX each year will match depreciation). Working Capital at the beginning of each year will be 12% of the Revenues for the year. The tax rate is 21%. Growth in free cash flows after year 5 is expected to be 5%. GB's methodology and industry analysis would indicate a forward-looking EV to EBITDA multiple of 10 times (to be used for EV today directly or for terminal value at end of year 5). With the discussion with the CFO, an analysis of industry, and consideration for the company's capital structure, you have arrived at a WACC of 9.75% and a cost of equity of 11.85%. The company currently has $2.4 million in Debt, $25,000 in excess cash, and 850,000 shares outstanding. The company plans to pay down its debt by $200,000 each year, and its cost of debt is 9%. Use this information and your starting template (on Canvas) to complete valuation with: Enterprise Value with WACC using growth for the terminal value Enterprise Value with WACC using EBITDA multiple for terminal value Flow-to-Equity with EBITDA multiple EBITDA Multiple using only year 1 projection Rev 1 COGS Fixed Depreciation CAPEX WC Bal $1,000,000 32% $100,000 $182,500 $182,500 12% Tax Rate WACC Cash #SO Debt $2,400,000 9.0% 21% 9.75% $25,000 850000 11.85% 8% 8% 5% 5% 8% 2 0 3 6 $1,000,000 EBITDA Revenues vc Gross Profit Fixed Costs Depreciation EBIT Tax NOPAT Depreciation OCF wd we wacc WC Change WC CAPEX FCF 5% USING GROWTH EBITDA Multiple Using growth beyond year 5 Enterprise Value Cash MVE MVD MVE PPS Using EV/EBITDA Multiple beyond year 5 Enterprise Value Cash MVE MVD USING EV/EBITDA Today Enterprise Value Cash MVE MVD MVE PPS MVE PPS