Please help me with using MATLAB
You have been employed by a mining company to determine the best destination to mine different types of metals and minerals. The company normally must pay a company to determine the best destination, however this year they have hired you to instead write a program which can do the same job which they can use it in the years to come. Every project they are given several spreadsheets (.csv files) of a designated land area. Each spreadsheet represents different metal or mineral deposits over the designated area, with each cell represents a 100x100 metre^2 surface area, with the values representing the quantity of that material in tonnes. Each year, the area changes therefore the program must be flexible to accommodate the different area sizes. The aim of the project it to find the most profitable mining destination in the designated area. There are 4 different materials this company mines for, with each material having a value per tonne. These materials include Iron, Silver, Copper and Diamonds. The materials differ on value but also the depth it takes to mine. Iron requires a mining depth of 20m, silver requires 30m, copper requires 80m and 150m for diamond. Each mining depth takes time and resources which comes at a cost. To mine 20 metres is $150,000, 30 metres is $225,000, 80 metres $500,000 and 150 metres is $1,000,000. This information can be seen below in an array, in addition to the value of each materials per ton. Please note that the mining depth cost do not accumulate, if the company chooses to mine down to 80 metres, it can gather all materials down to that depth at $500,000.
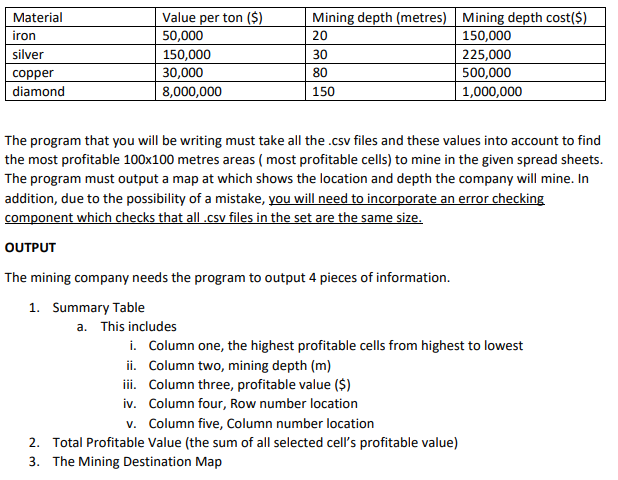
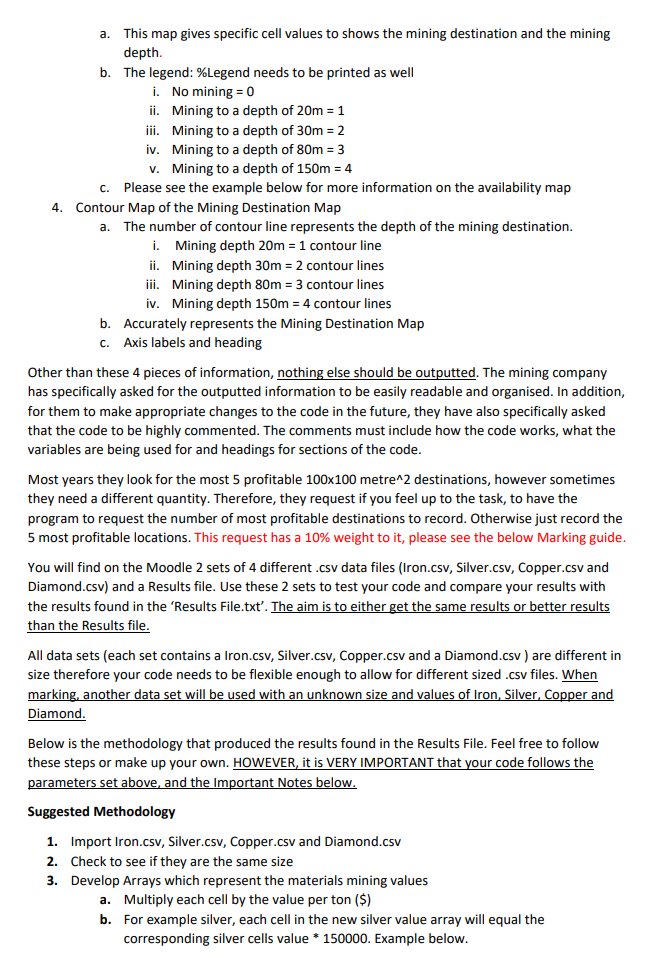
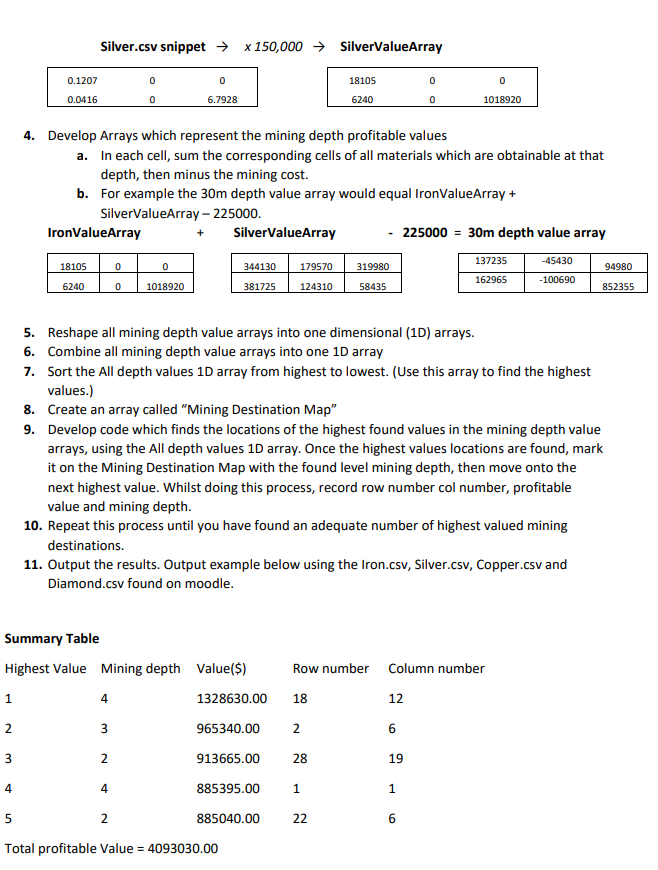
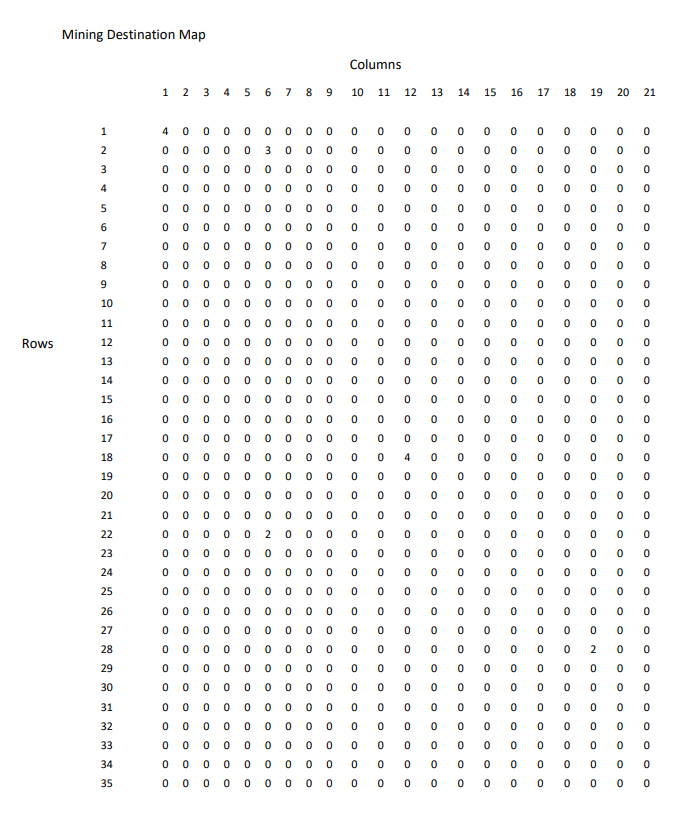
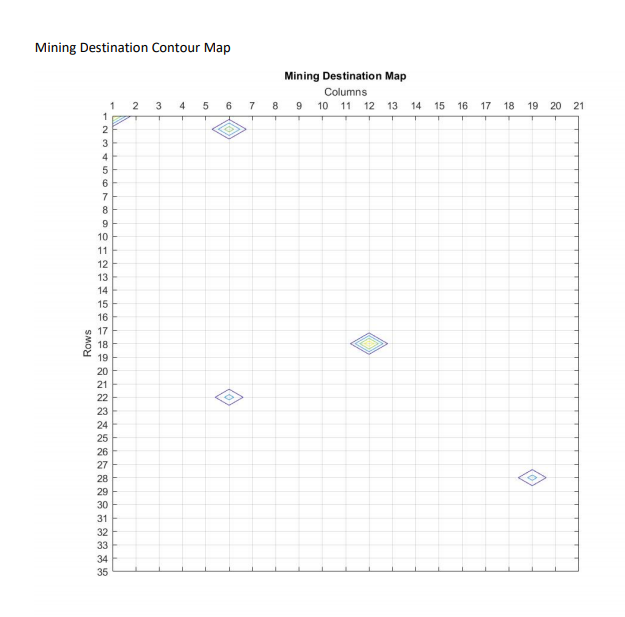
20 Material iron silver copper diamond Value per ton ($) 50,000 150,000 30,000 8,000,000 Mining depth (metres) Mining depth cost($) 150,000 225,000 80 500,000 150 1,000,000 30 The program that you will be writing must take all the .csv files and these values into account to find the most profitable 100x100 metres areas ( most profitable cells) to mine in the given spread sheets. The program must output a map at which shows the location and depth the company will mine. In addition, due to the possibility of a mistake, you will need to incorporate an error checking component which checks that all .csv files in the set are the same size. OUTPUT The mining company needs the program to output 4 pieces of information. 1. Summary Table a. This includes i. Column one, the highest profitable cells from highest to lowest ii. Column two, mining depth (m) iii. Column three, profitable value ($) iv. Column four, Row number location V. Column five, Column number location 2. Total Profitable Value (the sum of all selected cell's profitable value) 3. The Mining Destination Map a. This map gives specific cell values to shows the mining destination and the mining depth. b. The legend: %Legend needs to be printed as well i. No mining = 0 ii. Mining to a depth of 20m = 1 iii. Mining to a depth of 30m = 2 iv. Mining to a depth of 80m = 3 V. Mining to a depth of 150m = 4 C. Please see the example below for more information on the availability map 4. Contour Map of the Mining Destination Map a. The number of contour line represents the depth of the mining destination. i. Mining depth 20m = 1 contour line ii. Mining depth 30m = 2 contour lines iii. Mining depth 80m = 3 contour lines iv. Mining depth 150m = 4 contour lines b. Accurately represents the Mining Destination Map C. Axis labels and heading Other than these 4 pieces of information, nothing else should be outputted. The mining company has specifically asked for the outputted information to be easily readable and organised. In addition, for them to make appropriate changes to the code in the future, they have also specifically asked that the code to be highly commented. The comments must include how the code works, what the variables are being used for and headings for sections of the code. Most years they look for the most 5 profitable 100x100 metre^2 destinations, however sometimes they need a different quantity. Therefore, they request if you feel up to the task, to have the program to request the number of most profitable destinations to record. Otherwise just record the 5 most profitable locations. This request has a 10% weight to it, please see the below Marking guide. You will find on the Moodle 2 sets of 4 different .csv data files (Iron.csv, Silver.csv, Copper.csv and Diamond.csv) and a Results file. Use these 2 sets to test your code and compare your results with the results found in the 'Results File.txt'. The aim is to either get the same results or better results than the Results file. All data sets (each set contains a Iron.csv, Silver.csv, Copper.csv and a Diamond.csv ) are different in size therefore your code needs to be flexible enough to allow for different sized .csv files. When marking, another data set will be used with an unknown size and values of Iron, Silver, Copper and Diamond. Below is the methodology that produced the results found in the Results File. Feel free to follow these steps or make up your own. HOWEVER, it is VERY IMPORTANT that your code follows the parameters set above, and the Important Notes below. Suggested Methodology 1. Import Iron.csv, Silver.csv, Copper.csv and Diamond.csv 2. Check to see if they are the same size 3. Develop Arrays which represent the materials mining values a. Multiply each cell by the value per ton ($) b. For example silver, each cell in the new silver value array will equal the corresponding silver cells value * 150000. Example below. Silver.csv snippet x 150,000 + SilverValueArray 0.1207 0.0416 0 0 18105 6240 6.7928 0 1018920 4. Develop Arrays which represent the mining depth profitable values a. In each cell, sum the corresponding cells of all materials which are obtainable at that depth, then minus the mining cost. b. For example the 30m depth value array would equal IronValueArray + SilverValueArray - 225000. IronValueArray + SilverValueArray - 225000 = 30m depth value array 18105010 62400 1018920 344130179570319980 381725124310 58435 137235 162965 -45430 -100690 94980 852355 5. Reshape all mining depth value arrays into one dimensional (10) arrays. 6. Combine all mining depth value arrays into one 1D array 7. Sort the All depth values 10 array from highest to lowest. (Use this array to find the highest values.) 8. Create an array called "Mining Destination Map" 9. Develop code which finds the locations of the highest found values in the mining depth value arrays, using the All depth values 1D array. Once the highest values locations are found, mark it on the Mining Destination Map with the found level mining depth, then move onto the next highest value. Whilst doing this process, record row number col number, profitable value and mining depth. 10. Repeat this process until you have found an adequate number of highest valued mining destinations. 11. Output the results. Output example below using the Iron.csv, Silver.csv, Copper.csv and Diamond.csv found on moodle. Row number Column number Summary Table Highest Value Mining depth Value($) 1328630.00 965340.00 913665.00 885395.00 885040.00 Total profitable Value = 4093030.00 18 2 28 1 22 o o o 34 o o o o o o o o o o o o o o o o o o o o o o o o o o o o o o o o o o o o o o o o o o o o o o o o o o o o o o o o o o o o o o o o o o o o o o o o o o o o t 0 o o o o o o o o o o z o o o o o o o o o o o o o o o o o o o o o o o o o o o o o o o o o o o o o o o o o o o o o o o o o o o o o o o o o o o o o o o o o o o o o o o o o o o o o o o o o o o o o o o o o o o o o o o o o o o o o o o o o o o o o o o o o o o o o o o o o o o o o o o o o o o o o o o o o o o o o o o o o o o o o o o o o o o o o o o o o o o o o o o o o o o o o o o o o o o o o o o o o o o o o o o o o o o o o o o o o o o o o o o o o o o o o o o o o o o o o o o o o o o o o o o o o o o o o o o o o o o o o o o o o o o o o o o o o o o o o o o o o o o o o o o o o z o o o o o o o o o o o o o o o o o o o o o o o o o o o o o o o o o o o o o o o o o o o o o o o o o o o o o o o o o o o o o o o o o o o o o o o o o o o o o o o o o o o o o o o o o o o o o o o o o o o o o o o o o o o SMOY o o o o o o o o o o o o o o o o o o o o o o o o o o o o o o o o o o o o o o o o o o o o o o o o o o o o o o o o o o o o o o o o o o o o o o o o o o o o o o o o o o o o o o o o o o o o o o o o o o o o o o o o o o o o o o o o o o o o o o o o o o o o o o o o o o o o o o o o o o o o o o o o o o o o o o o o o o o o o o o o o o o o o o o o o o o o o o o o o o o o o o o o o o o o o o o o o o o o o o o o o o o o o o o o o o 4 o 21 18 19 20 14 15 16 17 9 8 7 6 5 4 2 3 1 12 13 11 10 Columns Mining Destination Map Mining Destination Contour Map Mining Destination Map Columns 9 10 11 12 13 1 2 3 4 5 6 7 8 14 15 16 17 18 19 20 21 Rows 20 Material iron silver copper diamond Value per ton ($) 50,000 150,000 30,000 8,000,000 Mining depth (metres) Mining depth cost($) 150,000 225,000 80 500,000 150 1,000,000 30 The program that you will be writing must take all the .csv files and these values into account to find the most profitable 100x100 metres areas ( most profitable cells) to mine in the given spread sheets. The program must output a map at which shows the location and depth the company will mine. In addition, due to the possibility of a mistake, you will need to incorporate an error checking component which checks that all .csv files in the set are the same size. OUTPUT The mining company needs the program to output 4 pieces of information. 1. Summary Table a. This includes i. Column one, the highest profitable cells from highest to lowest ii. Column two, mining depth (m) iii. Column three, profitable value ($) iv. Column four, Row number location V. Column five, Column number location 2. Total Profitable Value (the sum of all selected cell's profitable value) 3. The Mining Destination Map a. This map gives specific cell values to shows the mining destination and the mining depth. b. The legend: %Legend needs to be printed as well i. No mining = 0 ii. Mining to a depth of 20m = 1 iii. Mining to a depth of 30m = 2 iv. Mining to a depth of 80m = 3 V. Mining to a depth of 150m = 4 C. Please see the example below for more information on the availability map 4. Contour Map of the Mining Destination Map a. The number of contour line represents the depth of the mining destination. i. Mining depth 20m = 1 contour line ii. Mining depth 30m = 2 contour lines iii. Mining depth 80m = 3 contour lines iv. Mining depth 150m = 4 contour lines b. Accurately represents the Mining Destination Map C. Axis labels and heading Other than these 4 pieces of information, nothing else should be outputted. The mining company has specifically asked for the outputted information to be easily readable and organised. In addition, for them to make appropriate changes to the code in the future, they have also specifically asked that the code to be highly commented. The comments must include how the code works, what the variables are being used for and headings for sections of the code. Most years they look for the most 5 profitable 100x100 metre^2 destinations, however sometimes they need a different quantity. Therefore, they request if you feel up to the task, to have the program to request the number of most profitable destinations to record. Otherwise just record the 5 most profitable locations. This request has a 10% weight to it, please see the below Marking guide. You will find on the Moodle 2 sets of 4 different .csv data files (Iron.csv, Silver.csv, Copper.csv and Diamond.csv) and a Results file. Use these 2 sets to test your code and compare your results with the results found in the 'Results File.txt'. The aim is to either get the same results or better results than the Results file. All data sets (each set contains a Iron.csv, Silver.csv, Copper.csv and a Diamond.csv ) are different in size therefore your code needs to be flexible enough to allow for different sized .csv files. When marking, another data set will be used with an unknown size and values of Iron, Silver, Copper and Diamond. Below is the methodology that produced the results found in the Results File. Feel free to follow these steps or make up your own. HOWEVER, it is VERY IMPORTANT that your code follows the parameters set above, and the Important Notes below. Suggested Methodology 1. Import Iron.csv, Silver.csv, Copper.csv and Diamond.csv 2. Check to see if they are the same size 3. Develop Arrays which represent the materials mining values a. Multiply each cell by the value per ton ($) b. For example silver, each cell in the new silver value array will equal the corresponding silver cells value * 150000. Example below. Silver.csv snippet x 150,000 + SilverValueArray 0.1207 0.0416 0 0 18105 6240 6.7928 0 1018920 4. Develop Arrays which represent the mining depth profitable values a. In each cell, sum the corresponding cells of all materials which are obtainable at that depth, then minus the mining cost. b. For example the 30m depth value array would equal IronValueArray + SilverValueArray - 225000. IronValueArray + SilverValueArray - 225000 = 30m depth value array 18105010 62400 1018920 344130179570319980 381725124310 58435 137235 162965 -45430 -100690 94980 852355 5. Reshape all mining depth value arrays into one dimensional (10) arrays. 6. Combine all mining depth value arrays into one 1D array 7. Sort the All depth values 10 array from highest to lowest. (Use this array to find the highest values.) 8. Create an array called "Mining Destination Map" 9. Develop code which finds the locations of the highest found values in the mining depth value arrays, using the All depth values 1D array. Once the highest values locations are found, mark it on the Mining Destination Map with the found level mining depth, then move onto the next highest value. Whilst doing this process, record row number col number, profitable value and mining depth. 10. Repeat this process until you have found an adequate number of highest valued mining destinations. 11. Output the results. Output example below using the Iron.csv, Silver.csv, Copper.csv and Diamond.csv found on moodle. Row number Column number Summary Table Highest Value Mining depth Value($) 1328630.00 965340.00 913665.00 885395.00 885040.00 Total profitable Value = 4093030.00 18 2 28 1 22 o o o 34 o o o o o o o o o o o o o o o o o o o o o o o o o o o o o o o o o o o o o o o o o o o o o o o o o o o o o o o o o o o o o o o o o o o o o o o o o o o o t 0 o o o o o o o o o o z o o o o o o o o o o o o o o o o o o o o o o o o o o o o o o o o o o o o o o o o o o o o o o o o o o o o o o o o o o o o o o o o o o o o o o o o o o o o o o o o o o o o o o o o o o o o o o o o o o o o o o o o o o o o o o o o o o o o o o o o o o o o o o o o o o o o o o o o o o o o o o o o o o o o o o o o o o o o o o o o o o o o o o o o o o o o o o o o o o o o o o o o o o o o o o o o o o o o o o o o o o o o o o o o o o o o o o o o o o o o o o o o o o o o o o o o o o o o o o o o o o o o o o o o o o o o o o o o o o o o o o o o o o o o o o o o o z o o o o o o o o o o o o o o o o o o o o o o o o o o o o o o o o o o o o o o o o o o o o o o o o o o o o o o o o o o o o o o o o o o o o o o o o o o o o o o o o o o o o o o o o o o o o o o o o o o o o o o o o o o o SMOY o o o o o o o o o o o o o o o o o o o o o o o o o o o o o o o o o o o o o o o o o o o o o o o o o o o o o o o o o o o o o o o o o o o o o o o o o o o o o o o o o o o o o o o o o o o o o o o o o o o o o o o o o o o o o o o o o o o o o o o o o o o o o o o o o o o o o o o o o o o o o o o o o o o o o o o o o o o o o o o o o o o o o o o o o o o o o o o o o o o o o o o o o o o o o o o o o o o o o o o o o o o o o o o o o o 4 o 21 18 19 20 14 15 16 17 9 8 7 6 5 4 2 3 1 12 13 11 10 Columns Mining Destination Map Mining Destination Contour Map Mining Destination Map Columns 9 10 11 12 13 1 2 3 4 5 6 7 8 14 15 16 17 18 19 20 21 Rows