Please help! On a timeline
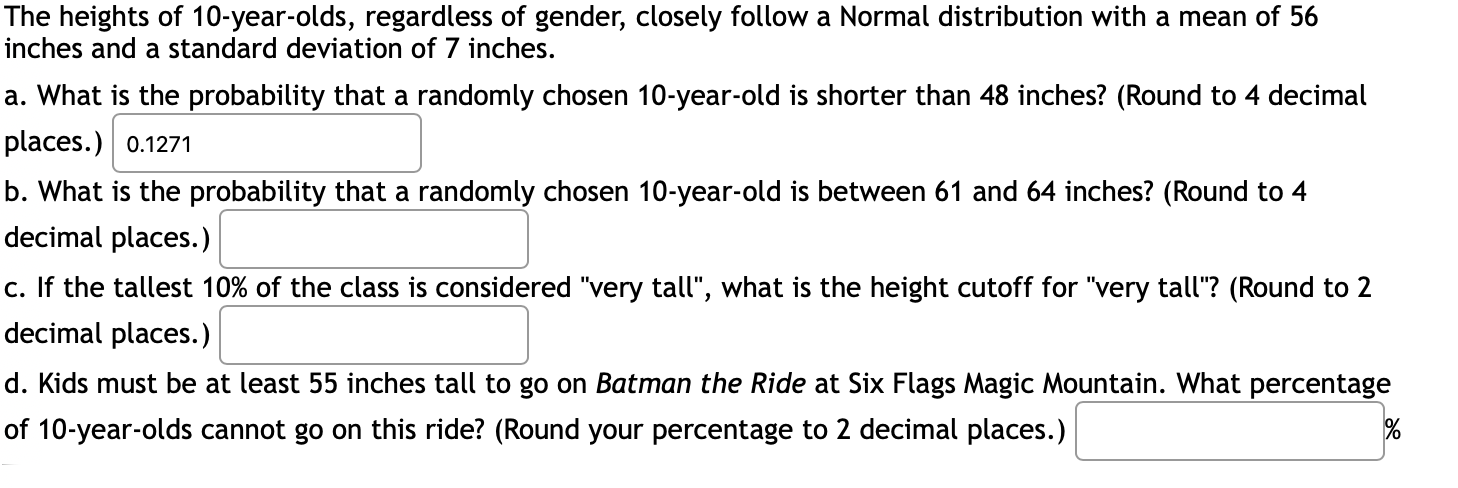
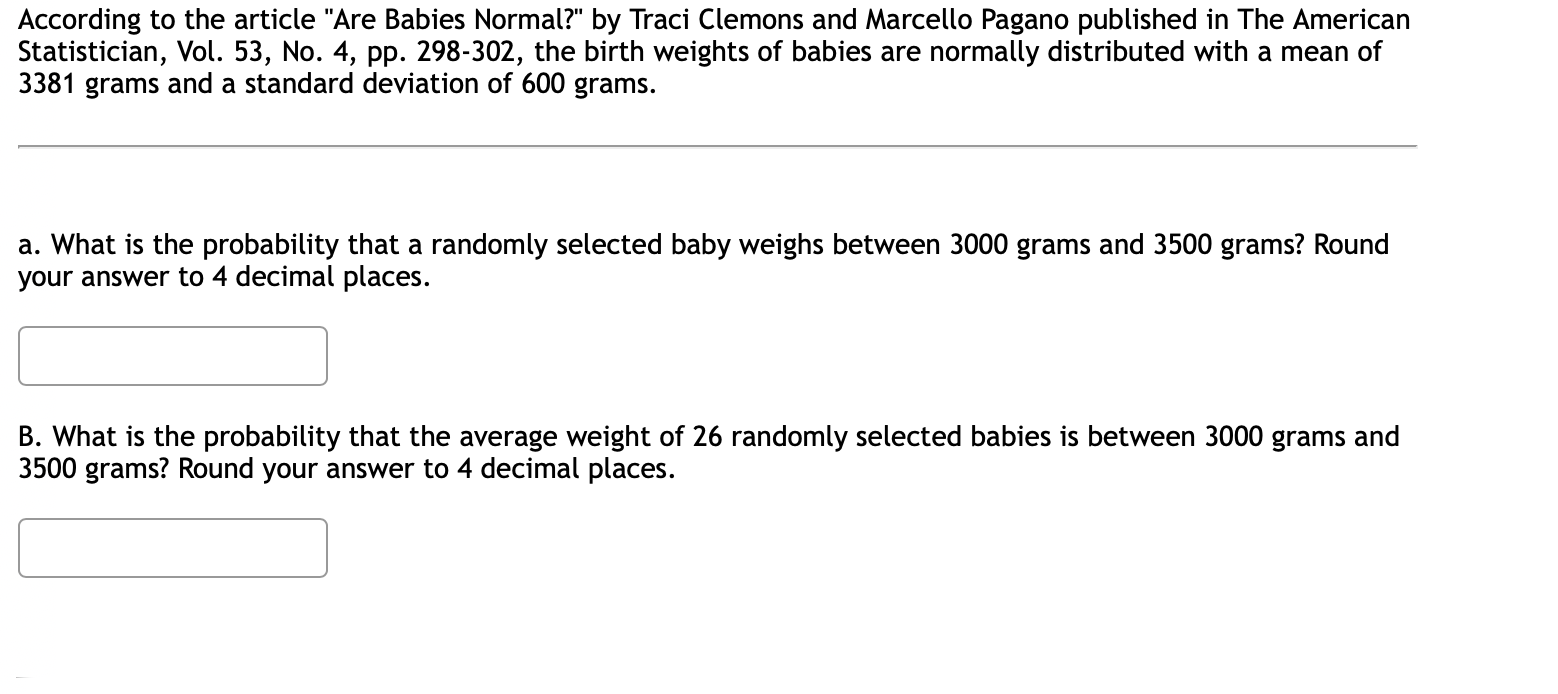
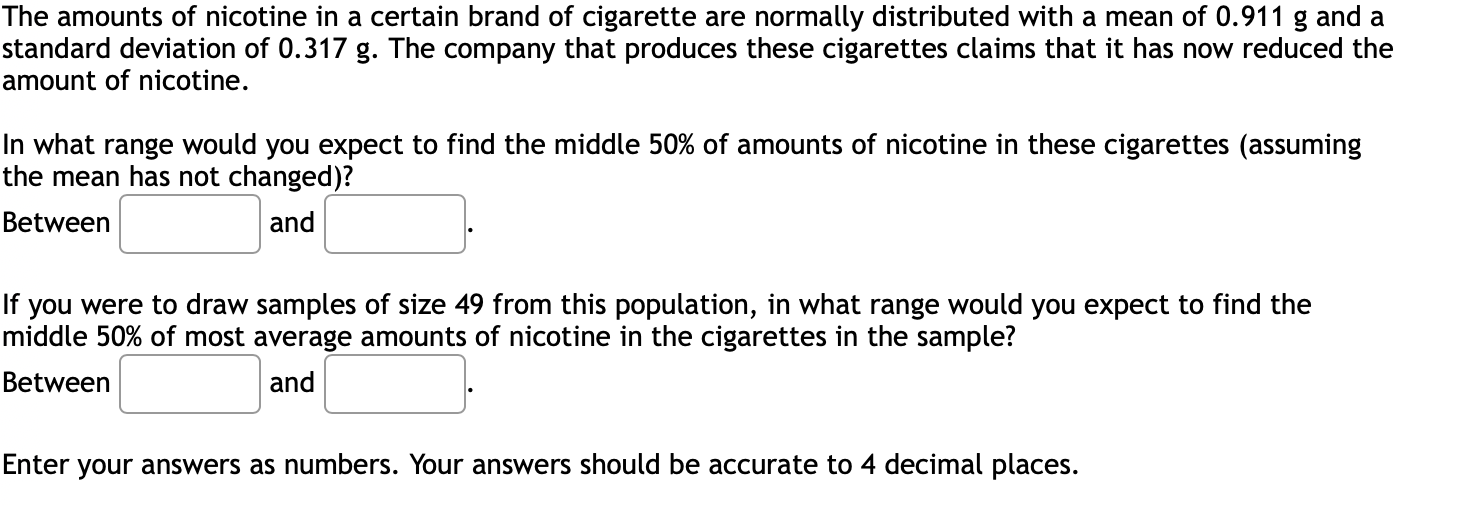
The heights of 10-year-olds, regardless of gender, closely follow a Normal distribution with a mean of 56 inches and a standard deviation of 7 inches. a. What is the probability that a randomly chosen 10-year-old is shorter than 48 inches? (Round to 4 decimal b. What is the probability that a randomly chosen 10-year-old is between 61 and 64 inches? (Round to 4 c. If the tallest 10% of the class is considered "very tall", what is the height cutoff for "very tall"? (Round to 2 d. Kids must be at least 55 inches tall to go on Batman the Ride at Six Flags Magic Mountain. What percentage of 10-year-olds cannot go on this ride? (Round your percentage to 2 decimal places.) :96 According to the article \"Are Babies Normal?" by Traci Clemons and Marcello Pagano published in The American Statistician, Vol. 53, No. 4, pp. 298-302, the birth weights of babies are normally distributed with a mean of 3381 grams and a standard deviation of 600 grams. a. What is the probability that a randomly selected baby weighs between 3000 grams and 3500 grams? Round your answer to 4 decimal places. :] B. What is the probability that the average weight of 26 randomly selected babies is between 3000 grams and 3500 grams? Round your answer to 4 decimal places. :] According to a 2009 Reader's Digest article, people throw away approximately 13% of what they buy at the grocery store. Assume this is the true proportion and you plan to randomly survey 161 grocery shoppers to investigate their behavior. What is the probability that the sample proportion exceeds 0.16? Answer = C] (Enter your answer as a number accurate to 4 decimal places.) Based on historical data at Oxnard college, they believe that 42% of freshmen do not visit their advisors regularly. For this year, you would like to obtain a new sample to estimate the proportion of freshmen who do not visit their advisors regularly. You would like to be 95% confident that your estimate is within 2% of the true population proportion. How large of a sample size is required? FD This week, a very large running race (5K) occured in Denver. The times were normally distributed, with a mean of 20.31 minutes and a standard deviation of 3.72 minutes. a. What percent of runners took 14.73 minutes or less to complete the race? I:] b. What time in minutes is the cutoff for the fastest 98.93 96? I: c. What percent of runners took more than 20.124 minutes to complete the race? [: A Food Marketing Institute found that 25% of households spend more than $125 a week on groceries. Assume the population proportion is 0.25 and a simple random sample of 438 households is selected from the population. What is the probability that the sample proportion of households spending more than $125 a week is less than 0.26? Answer = [:] (Enter your answer as a number accurate to 4 decimal places.) The amounts of nicotine in a certain brand of cigarette are normally distributed with a mean of 0.911 g and a standard deviation of 0.317 g. The company that produces these cigarettes claims that it has now reduced the amount of nicotine. In what range would you expect to find the middle 50% of amounts of nicotine in these cigarettes (assuming the mean has not changed)? If you were to draw samples of size 49 from this population, in what range would you expect to find the middle 50% of most average amounts of nicotine in the cigarettes in the sample? Enter your answers as numbers. Your answers should be accurate to 4 decimal places


