please help
please show calculation so that I can understand properly.
Thank you so much.
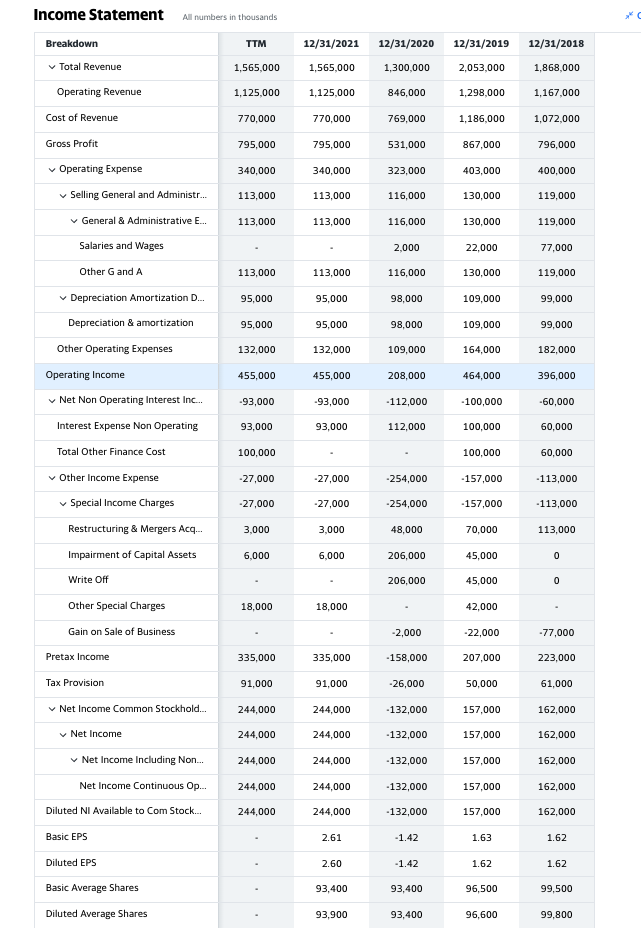
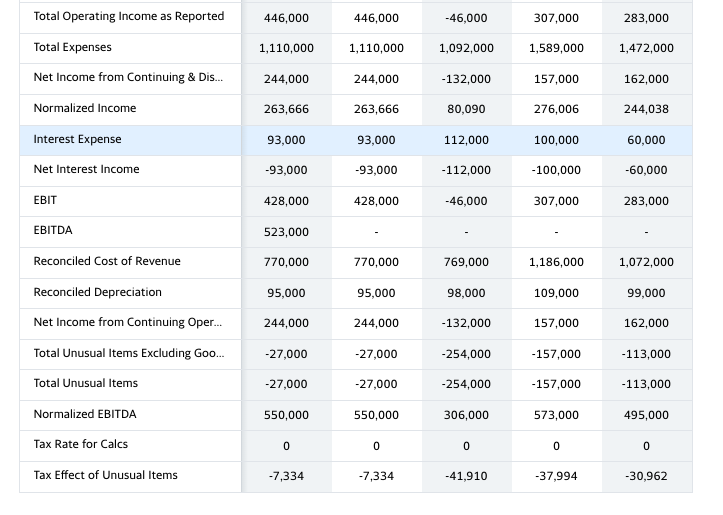
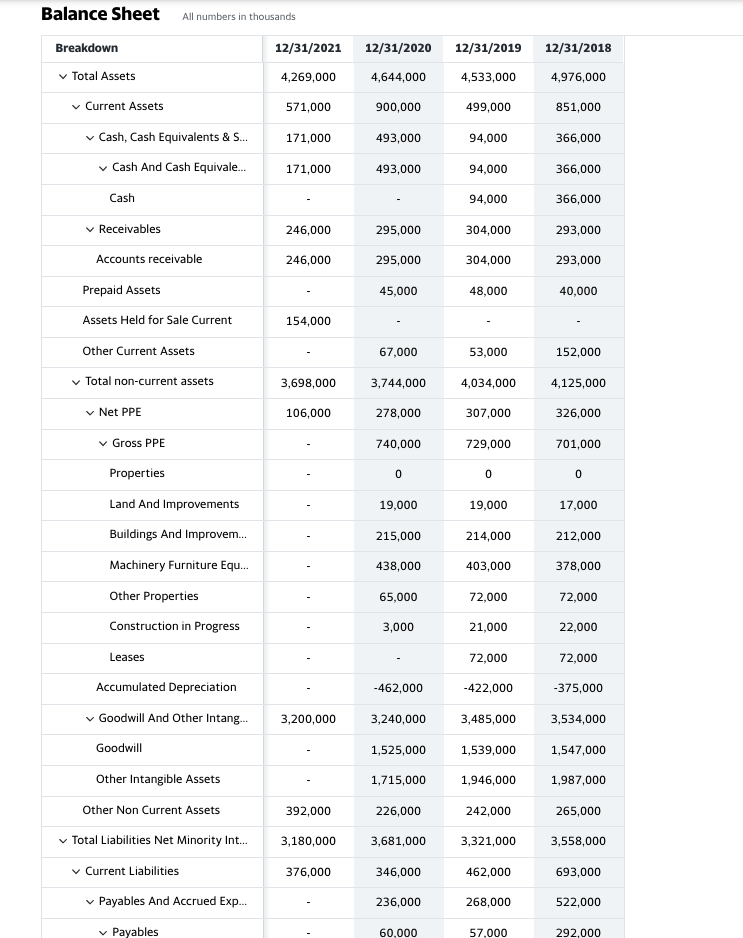
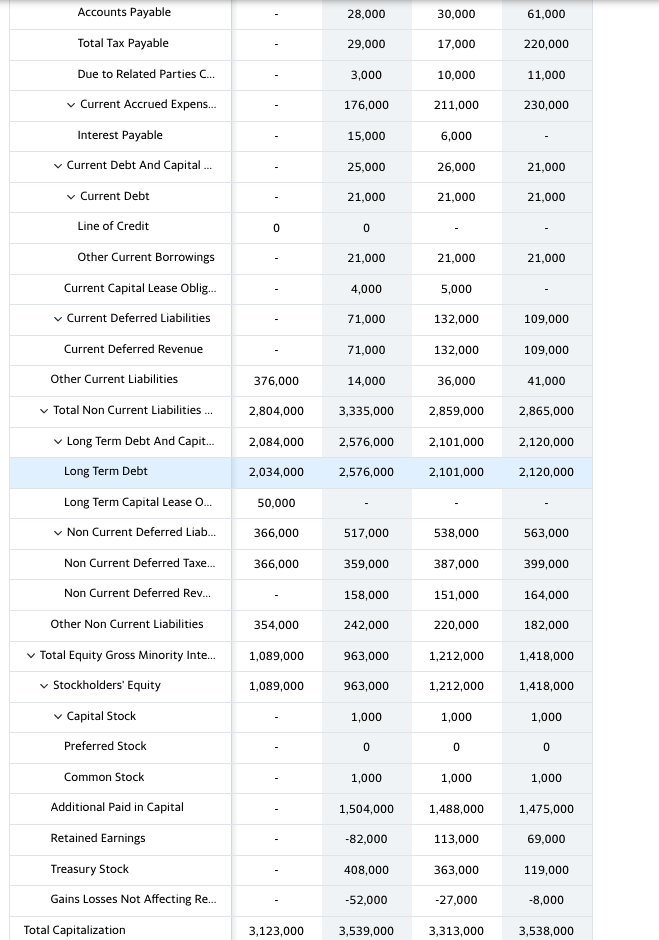
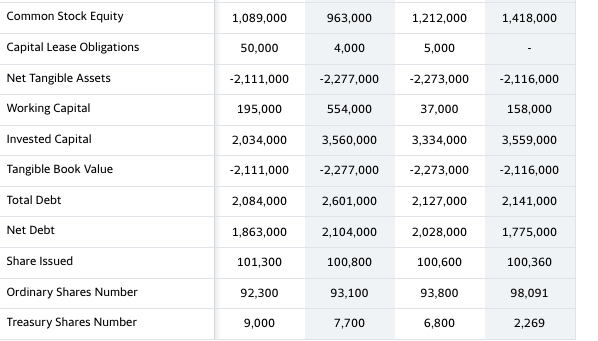
You are required to use the balance sheet and income statement assigned to compute the following ratios forTWOconsecutive years 2018- 2019.
Income Statement All numbers in thousands Breakdown ITM 12/31/2021 12/31/2020 12/31/2019 12/31/2018 w Total Revenue 1,565,000 1,565,000 1,300,000 2,053,000 1,868,000 Operating Revenue 1,125,000 1,125,000 846,000 1,298,000 1,167,000 Cost of Revenue 770,000 770,000 769,000 1,186,000 1,072,000 Gross Profit 795,000 795,000 531,000 867,000 796,000 Operating Expense 340,000 340,000 323,000 403,000 400,000 Selling General and Administr 113,000 113,000 116,000 130,000 119,000 General & Administrative E... 113,000 113,000 116,000 130,000 119,000 Salaries and Wages 2.000 22,000 77,000 Other G and A 113,000 113,000 116,000 130,000 119,000 Depreciation Amortization D... 95,000 95,000 98,000 109,000 99,000 Depreciation & amortization 95,000 95,000 98,000 109,000 99,000 Other Operating Expenses 132,000 132,000 109,000 164,000 182,000 Operating Income 455,000 455,000 208,000 464,000 396,000 Net Non Operating Interest Inc... -93,000 -93,000 -112,000 -100,000 -60,000 Interest Expense Non Operating 93,000 93,000 112,000 100,000 60,000 Total Other Finance Cost 100,000 100,000 60,000 w Other Income Expense -27,000 -27,000 -254,000 -157,000 -113,000 Special Income Charges 27,000 -27,000 -254,000 -157,000 -113,000 Restructuring & Mergers Acq... 3,000 3,000 48,000 70,000 113,000 Impairment of Capital Assets 6,000 6,000 206,000 45,000 Write Off 206,000 45,000 Other Special Charges 18,000 18,000 42,000 Gain on Sale of Business -2,000 -22,000 -77,000 Pretax Income 335,000 335,000 -158,000 207,000 223,000 Tax Provision 91,000 91,000 -26,000 50,000 61,000 Net Income Common Stockhold... 244,000 244,000 -132,000 157,000 162,000 Net Income 244,000 244,000 -132,000 157,000 162,000 Net Income Including Non... 244,000 244,000 132,000 157,000 162,000 Net Income Continuous Op... 244,000 244,000 -132,000 157,000 162,000 Diluted NI Available to Com Stock... 244,000 244,000 -132,000 157,000 162,000 Basic EPS 2.61 -1.42 1.63 1.62 Diluted EPS 2.60 -1.42 1.62 1.62 Basic Average Shares 93,400 93,400 96,500 99,500 Diluted Average Shares 93,900 93,400 96,600 99,800Total Operating Income as Reported 446,000 446,000 -46,000 307,000 283,000 Total Expenses 1,110,000 1,110,000 1,092,000 1,589,000 1,472,000 Net Income from Continuing & Dis... 244,000 244,000 -132,000 157,000 162,000 Normalized Income 263,666 263,666 80,090 276,006 244,038 Interest Expense 93,000 93,000 112,000 100,000 60,000 Net Interest Income -93,000 -93,000 -112,000 -100,000 -60,000 EBIT 428,000 428,000 -46,000 307,000 283,000 EBITDA 523,000 Reconciled Cost of Revenue 770,000 770,000 769,000 1,186,000 1,072,000 Reconciled Depreciation 95,000 95,000 98,000 109,000 99,000 Net Income from Continuing Oper... 244,000 244,000 -132,000 157,000 162,000 Total Unusual Items Excluding Goo... -27,000 -27,000 -254,000 -157,000 -113,000 Total Unusual Items -27,000 -27,000 -254,000 -157,000 -113,000 Normalized EBITDA 550,000 550,000 306,000 573,000 495,000 Tax Rate for Calcs 0 0 0 0 0 Tax Effect of Unusual Items -7,334 -7,334 -41,910 -37,994 -30,962Balance Sheet All numbers in thousands Breakdown 12/31/2021 12/31/2020 12/31/2019 12/31/2018 Total Assets 4,269,000 4,644,000 4,533,000 4,976,000 v Current Assets 571,000 900,000 499,000 851,000 Cash, Cash Equivalents & S... 171,000 493,000 94,000 366,000 Cash And Cash Equivale 171,000 493,000 94,000 366,000 Cash 94,000 366,000 Receivables 246,000 295,000 304,000 293,000 Accounts receivable 246,000 295,000 304,000 293,000 Prepaid Assets 45,000 48,000 40,000 Assets Held for Sale Current 154,000 Other Current Assets 67,000 53,000 152,000 Total non-current assets 3,698,000 3,744,000 4,034,000 4,125,000 v Net PPE 106,000 278,000 307,000 326,000 Gross PPE 740,000 729,000 701,000 Properties Land And Improvements 19,000 19,000 17,000 Buildings And Improvem... 215,000 214,000 212,000 Machinery Furniture Equ... 438,000 403,000 378,000 Other Properties 65,000 72,000 72,000 Construction in Progress 3,000 21,000 22,000 Leases 72,000 72,000 Accumulated Depreciation -462,000 -422,000 -375,000 Goodwill And Other Intang.. 3,200,000 3,240,000 3,485,000 3,534,000 Goodwill 1,525,000 1,539,000 1,547,000 Other Intangible Assets 1,715,000 1,946,000 1,987,000 Other Non Current Assets 392,000 226,000 242,000 265,000 Total Liabilities Net Minority Int... 3,180,000 3,681,000 3,321,000 3,558,000 Current Liabilities 376,000 346,000 462,000 693,000 Payables And Accrued Exp... 236,000 268,000 522,000 Payables 60.000 57.000 292.000Accounts Payable 28,000 30,000 61,000 Total Tax Payable 29,000 17,000 220,000 Due to Related Parties C... 3,000 10,000 11,000 Current Accrued Expens... 176,000 211,000 230,000 Interest Payable 15,000 6,000 v Current Debt And Capital .. 25,000 26,000 21,000 v Current Debt 21,000 21,000 21,000 Line of Credit O 0 Other Current Borrowings 21,000 21,000 21,000 Current Capital Lease Oblig... 4,000 5,000 Current Deferred Liabilities 71,000 132,000 109,000 Current Deferred Revenue 71,000 132,000 109,000 Other Current Liabilities 376,000 14,000 36,000 41,000 Total Non Current Liabilities ... 2,804,000 3,335,000 2,859,000 2,865,000 Long Term Debt And Capit... 2,084,000 2,576,000 2,101,000 2,120,000 Long Term Debt 2,034,000 2,576,000 2,101,000 2,120,000 Long Term Capital Lease O... 50,000 Non Current Deferred Liab. 366,000 517,000 538,000 563,000 Non Current Deferred Taxe... 366,000 359,000 387,000 399,000 Non Current Deferred Rev... 158,000 151,000 164,000 Other Non Current Liabilities 354,000 242,000 220,000 182,000 Total Equity Gross Minority Inte... 1,089,000 963,000 1,212,000 1,418,000 Stockholders' Equity 1,089,000 963,000 1,212,000 1,418,000 Capital Stock 1,000 1,000 1,000 Preferred Stock 0 0 0 Common Stock 1,000 1,000 1,000 Additional Paid in Capital 1,504,000 1,488,000 1,475,000 Retained Earnings -82,000 113,000 69,000 Treasury Stock 408,000 363,000 119,000 Gains Losses Not Affecting Re... -52,000 -27,000 -8,000 Total Capitalization 3,123,000 3,539,000 3,313,000 3,538,000Common Stock Equity 1,089,000 963,000 1,212,000 1,418,000 Capital Lease Obligations 50,000 4,000 5,000 Net Tangible Assets -2,111,000 -2,277,000 -2,273,000 -2,116,000 Working Capital 195,000 554,000 37,000 158,000 Invested Capital 2,034,000 3,560,000 3,334,000 3,559,000 Tangible Book Value -2,111,000 -2,277,000 -2,273,000 -2,116,000 Total Debt 2,084,000 2,601,000 2,127,000 2,141,000 Net Debt 1,863,000 2,104,000 2,028,000 1,775,000 Share Issued 101,300 100,800 100,600 100,360 Ordinary Shares Number 92.300 93,100 93,800 98,091 Treasury Shares Number 9,000 7,700 6,800 2,269