

Answered step by step
Verified Expert Solution
Question
1 Approved Answer
Please help, Python coding on Jupiter. Code the problems below using Jupyter Notebook. Provide a label for each problem using a comment. Your code solutions
Please help, Python coding on Jupiter.
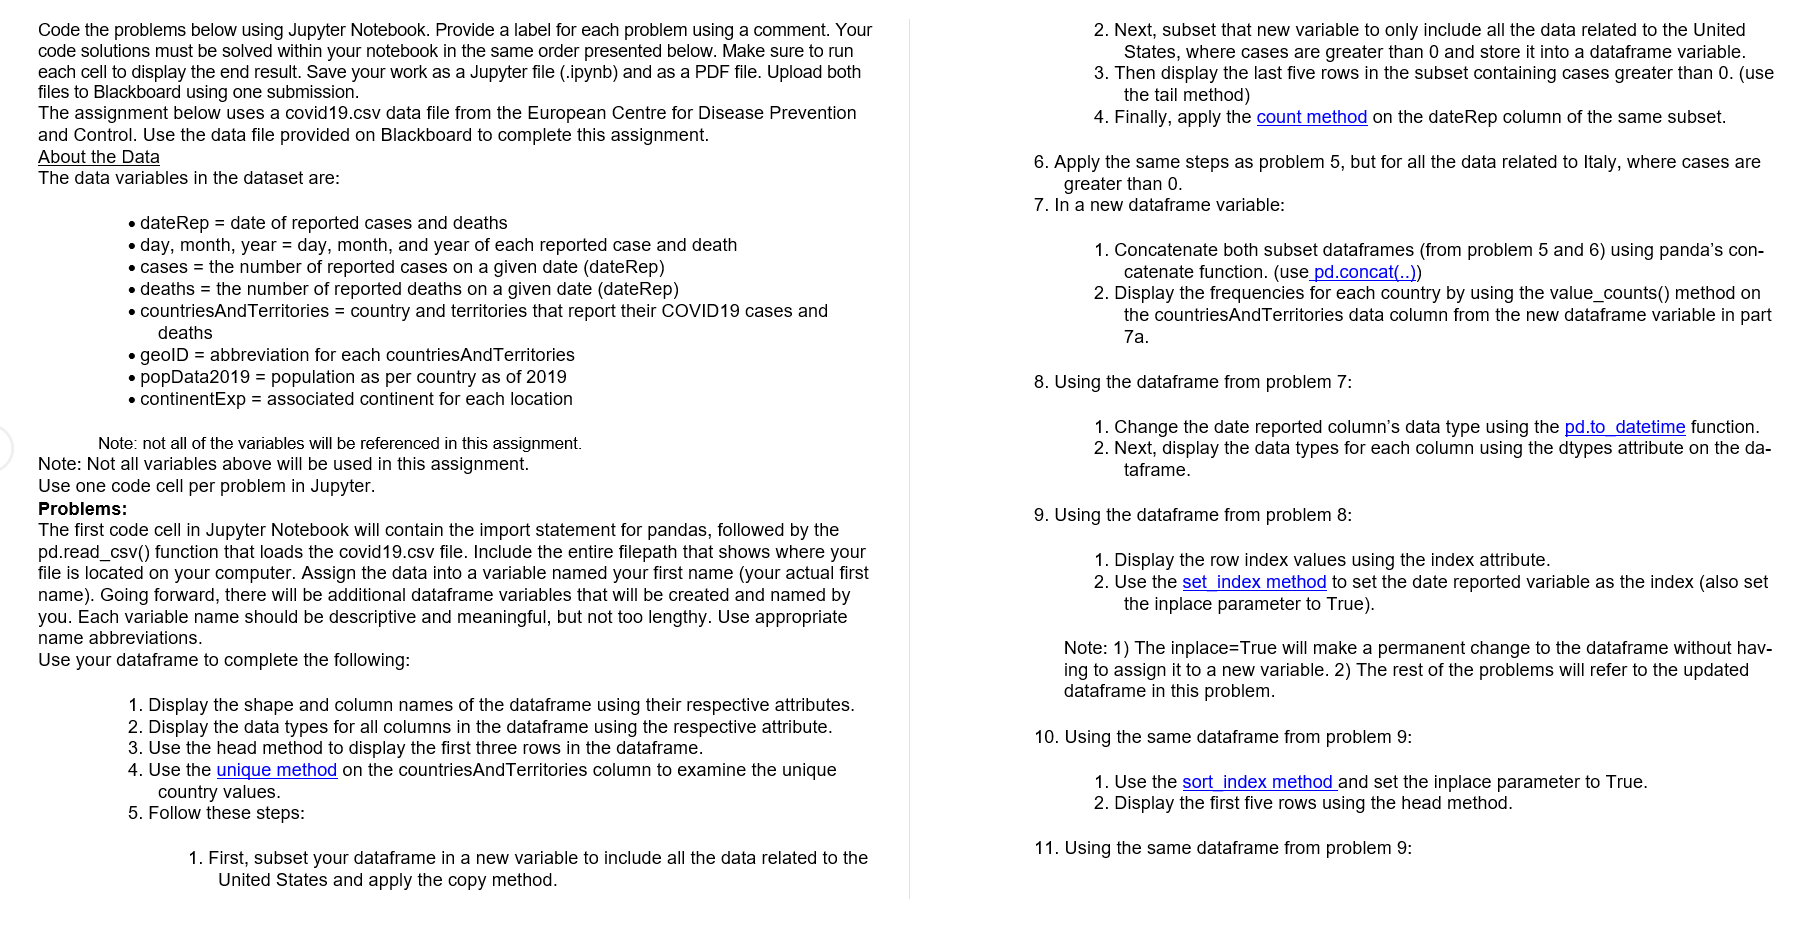
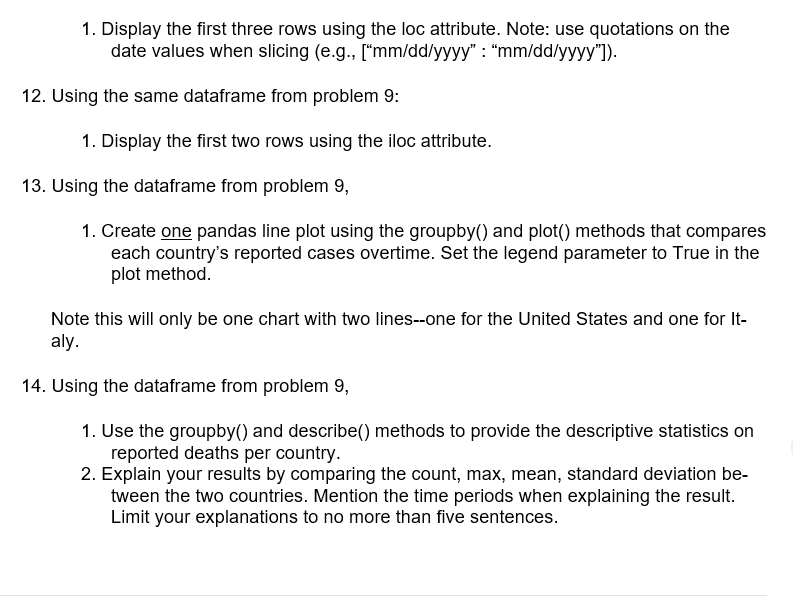
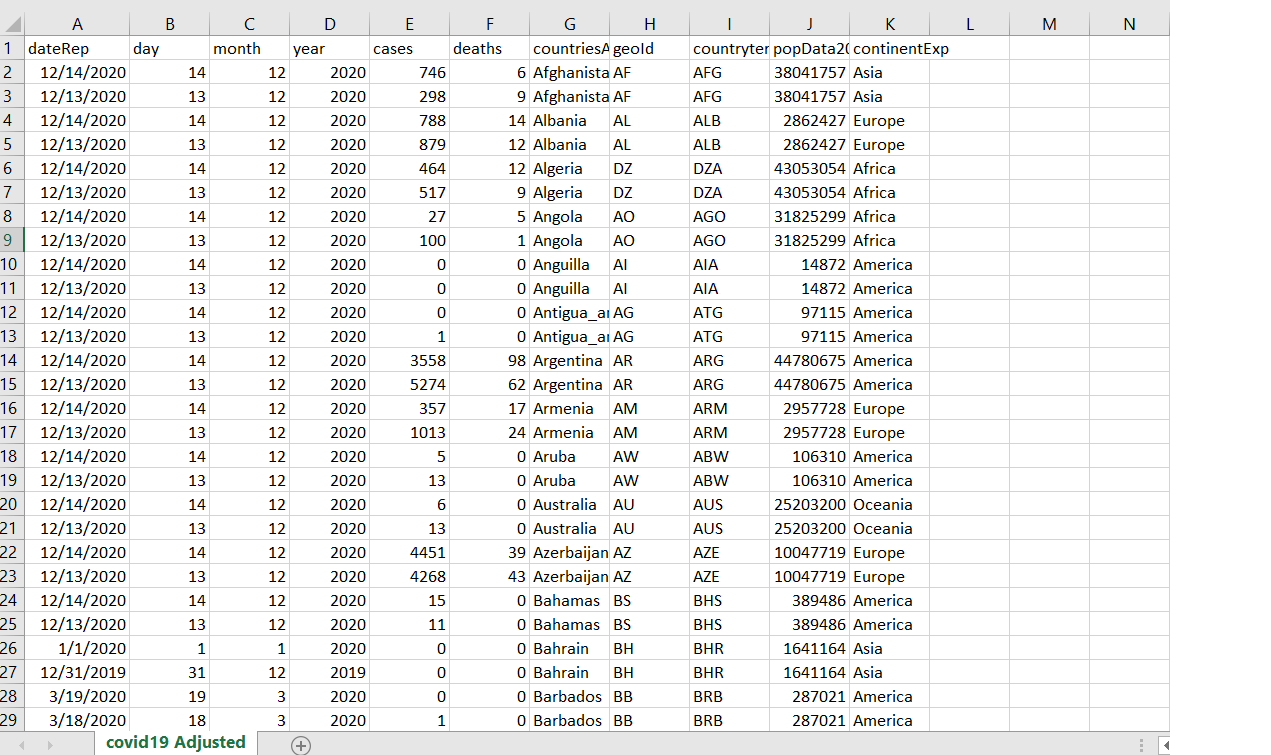
Code the problems below using Jupyter Notebook. Provide a label for each problem using a comment. Your code solutions must be solved within your notebook in the same order presented below. Make sure to run each cell to display the end result. Save your work as a Jupyter file (.ipynb) and as a PDF file. Upload both files to Blackboard using one submission. The assignment below uses a covid19.csv data file from the European Centre for Disease Prevention and Control. Use the data file provided on Blackboard to complete this assignment. About the Data The data variables in the dataset are: 2. Next, subset that new variable to only include all the data related to the United States, where cases are greater than 0 and store it into a dataframe variable. 3. Then display the last five rows in the subset containing cases greater than 0. (use the tail method) 4. Finally, apply the count method on the date Rep column of the same subset. 6. Apply the same steps as problem 5, but for all the data related to Italy, where cases are greater than 0. 7. In a new dataframe variable: . dateRep = date of reported cases and deaths day, month, year = day, month, and year of each reported case and death cases = the number of reported cases on a given date (dateRep) deaths = the number of reported deaths on a given date (dateRep) countriesAndTerritories = country and territories that report their COVID19 cases and deaths geolD = abbreviation for each countriesAndTerritories popData2019 = population as per country as of 2019 continentExp = associated continent for each location 1. Concatenate both subset dataframes (from problem 5 and 6) using panda's con- catenate function. (use pd.concat(..)) 2. Display the frequencies for each country by using the value_counts() method on the countriesAndTerritories data column from the new dataframe variable in part 7a. 8. Using the dataframe from problem 7: 1. Change the date reported column's data type using the pd.to datetime function. 2. Next, display the data types for each column using the dtypes attribute on the da- taframe. 9. Using the dataframe from problem 8: Note: not all of the variables will be referenced in this assignment. Note: Not all variables above will be used in this assignment. Use one code cell per problem in Jupyter. Problems: The first code cell in Jupyter Notebook will contain the import statement for pandas, followed by the pd.read_csv() function that loads the covid 19.csv file. Include the entire filepath that shows where your file is located on your computer. Assign the data into a variable named your first name (your actual first name). Going forward, there will be additional dataframe variables that will be created and named by you. Each variable name should be descriptive and meaningful, but not too lengthy. Use appropriate name abbreviations. Use your dataframe to complete the following: 1. Display the row index values using the index attribute. 2. Use the set index method to set the date reported variable as the index (also set the inplace parameter to True). Note: 1) The inplace=True will make a permanent change to the dataframe without hav- ing to assign it to a new variable. 2) The rest of the problems will refer to the updated dataframe in this problem. 10. Using the same dataframe from problem 9: 1. Display the shape and column names of the dataframe using their respective attributes. 2. Display the data types for all columns in the dataframe using the respective attribute. 3. Use the head method to display the first three rows in the dataframe. 4. Use the unique method on the countriesAndTerritories column to examine the unique country values. 5. Follow these steps: 1. Use the sort index method and set the inplace parameter to True. 2. Display the first five rows using the head method. 11. Using the same dataframe from problem 9: 1. First, subset your dataframe in a new variable to include all the data related to the United States and apply the copy method. 1. Display the first three rows using the loc attribute. Note: use quotations on the date values when slicing (e.g., ["mm/dd/yyyy" : "mm/dd/yyyy"]). 12. Using the same dataframe from problem 9: 1. Display the first two rows using the iloc attribute. 13. Using the dataframe from problem 9, 1. Create one pandas line plot using the groupby() and plot() methods that compares each country's reported cases overtime. Set the legend parameter to True in the plot method. Note this will only be one chart with two lines--one for the United States and one for It- aly. 14. Using the dataframe from problem 9, 1. Use the groupby() and describe() methods to provide the descriptive statistics on reported deaths per country. 2. Explain your results by comparing the count, max, mean, standard deviation be- tween the two countries. Mention the time periods when explaining the result. Limit your explanations to no more than five sentences. L M z day ATG B D E F G H 1 date Rep month year cases deaths countries geold 2 12/14/2020 14 12 2020 746 6 Afghanista AF 3 12/13/2020 13 12 2020 298 9 Afghanista AF 4 12/14/2020 14 12 2020 788 14 Albania AL 5 12/13/2020 13 12 2020 879 12 Albania AL 6 12/14/2020 14 12 2020 464 12 Algeria DZ 7 12/13/2020 13 12 2020 517 9 Algeria DZ 8 12/14/2020 14 12 2020 27 5 Angola 9 12/13/2020 13 12 2020 100 1 Angola AO 10 12/14/2020 14 12 2020 0 O Anguilla 11 12/13/2020 13 12 2020 0 0 Anguilla 12 12/14/2020 14 12 2020 O Antigua_ai AG 13 12/13/2020 13 12 2020 1 0 Antigua_a1 AG 14 12/14/2020 14 12 2020 3558 98 Argentina AR 15 12/13/2020 13 12 2020 5274 62 Argentina AR 16 12/14/2020 14 12 2020 357 17 Armenia AM 17 12/13/2020 13 12 2020 1013 24 Armenia AM 18 12/14/2020 14 12 2020 5 0 Aruba AW 19 12/13/2020 13 12 2020 13 0 Aruba AW 20 12/14/2020 14 12 2020 6 0 Australia AU 21 12/13/2020 13 12 2020 13 0 Australia AU 22 12/14/2020 14 12 2020 4451 39 Azerbaijan AZ 23 12/13/2020 13 12 2020 4268 43 Azerbaijan AZ 24 12/14/2020 14 12 2020 15 O Bahamas BS 25 12/13/2020 13 12 2020 11 O Bahamas BS 26 1/1/2020 1 1 2020 0 O Bahrain BH 27 12/31/2019 31 12 2019 0 O Bahrain BH 28 3/19/2020 19 3 2020 0 O Barbados BB 29 3/18/2020 18 3 2020 1 O Barbados BB covid 19 Adjusted + K countryter popData21 continentExp AFG 38041757 Asia AFG 38041757 Asia ALB 2862427 Europe ALB 2862427 Europe DZA 43053054 Africa DZA 43053054 Africa AGO 31825299 Africa AGO 31825299 Africa AIA 14872 America AIA 14872 America 97115 America ATG 97115 America ARG 44780675 America 44780675 America ARM 2957728 Europe ARM 2957728 Europe ABW 106310 America ABW 106310 America AUS 25203200 Oceania AUS 25203200 Oceania AZE 10047719 Europe AZE 10047719 Europe BHS 389486 America BHS 389486 America BHR 1641164 Asia BHR 1641164 Asia BRB 287021 America BRB 287021 America ARG Code the problems below using Jupyter Notebook. Provide a label for each problem using a comment. Your code solutions must be solved within your notebook in the same order presented below. Make sure to run each cell to display the end result. Save your work as a Jupyter file (.ipynb) and as a PDF file. Upload both files to Blackboard using one submission. The assignment below uses a covid19.csv data file from the European Centre for Disease Prevention and Control. Use the data file provided on Blackboard to complete this assignment. About the Data The data variables in the dataset are: 2. Next, subset that new variable to only include all the data related to the United States, where cases are greater than 0 and store it into a dataframe variable. 3. Then display the last five rows in the subset containing cases greater than 0. (use the tail method) 4. Finally, apply the count method on the date Rep column of the same subset. 6. Apply the same steps as problem 5, but for all the data related to Italy, where cases are greater than 0. 7. In a new dataframe variable: . dateRep = date of reported cases and deaths day, month, year = day, month, and year of each reported case and death cases = the number of reported cases on a given date (dateRep) deaths = the number of reported deaths on a given date (dateRep) countriesAndTerritories = country and territories that report their COVID19 cases and deaths geolD = abbreviation for each countriesAndTerritories popData2019 = population as per country as of 2019 continentExp = associated continent for each location 1. Concatenate both subset dataframes (from problem 5 and 6) using panda's con- catenate function. (use pd.concat(..)) 2. Display the frequencies for each country by using the value_counts() method on the countriesAndTerritories data column from the new dataframe variable in part 7a. 8. Using the dataframe from problem 7: 1. Change the date reported column's data type using the pd.to datetime function. 2. Next, display the data types for each column using the dtypes attribute on the da- taframe. 9. Using the dataframe from problem 8: Note: not all of the variables will be referenced in this assignment. Note: Not all variables above will be used in this assignment. Use one code cell per problem in Jupyter. Problems: The first code cell in Jupyter Notebook will contain the import statement for pandas, followed by the pd.read_csv() function that loads the covid 19.csv file. Include the entire filepath that shows where your file is located on your computer. Assign the data into a variable named your first name (your actual first name). Going forward, there will be additional dataframe variables that will be created and named by you. Each variable name should be descriptive and meaningful, but not too lengthy. Use appropriate name abbreviations. Use your dataframe to complete the following: 1. Display the row index values using the index attribute. 2. Use the set index method to set the date reported variable as the index (also set the inplace parameter to True). Note: 1) The inplace=True will make a permanent change to the dataframe without hav- ing to assign it to a new variable. 2) The rest of the problems will refer to the updated dataframe in this problem. 10. Using the same dataframe from problem 9: 1. Display the shape and column names of the dataframe using their respective attributes. 2. Display the data types for all columns in the dataframe using the respective attribute. 3. Use the head method to display the first three rows in the dataframe. 4. Use the unique method on the countriesAndTerritories column to examine the unique country values. 5. Follow these steps: 1. Use the sort index method and set the inplace parameter to True. 2. Display the first five rows using the head method. 11. Using the same dataframe from problem 9: 1. First, subset your dataframe in a new variable to include all the data related to the United States and apply the copy method. 1. Display the first three rows using the loc attribute. Note: use quotations on the date values when slicing (e.g., ["mm/dd/yyyy" : "mm/dd/yyyy"]). 12. Using the same dataframe from problem 9: 1. Display the first two rows using the iloc attribute. 13. Using the dataframe from problem 9, 1. Create one pandas line plot using the groupby() and plot() methods that compares each country's reported cases overtime. Set the legend parameter to True in the plot method. Note this will only be one chart with two lines--one for the United States and one for It- aly. 14. Using the dataframe from problem 9, 1. Use the groupby() and describe() methods to provide the descriptive statistics on reported deaths per country. 2. Explain your results by comparing the count, max, mean, standard deviation be- tween the two countries. Mention the time periods when explaining the result. Limit your explanations to no more than five sentences. L M z day ATG B D E F G H 1 date Rep month year cases deaths countries geold 2 12/14/2020 14 12 2020 746 6 Afghanista AF 3 12/13/2020 13 12 2020 298 9 Afghanista AF 4 12/14/2020 14 12 2020 788 14 Albania AL 5 12/13/2020 13 12 2020 879 12 Albania AL 6 12/14/2020 14 12 2020 464 12 Algeria DZ 7 12/13/2020 13 12 2020 517 9 Algeria DZ 8 12/14/2020 14 12 2020 27 5 Angola 9 12/13/2020 13 12 2020 100 1 Angola AO 10 12/14/2020 14 12 2020 0 O Anguilla 11 12/13/2020 13 12 2020 0 0 Anguilla 12 12/14/2020 14 12 2020 O Antigua_ai AG 13 12/13/2020 13 12 2020 1 0 Antigua_a1 AG 14 12/14/2020 14 12 2020 3558 98 Argentina AR 15 12/13/2020 13 12 2020 5274 62 Argentina AR 16 12/14/2020 14 12 2020 357 17 Armenia AM 17 12/13/2020 13 12 2020 1013 24 Armenia AM 18 12/14/2020 14 12 2020 5 0 Aruba AW 19 12/13/2020 13 12 2020 13 0 Aruba AW 20 12/14/2020 14 12 2020 6 0 Australia AU 21 12/13/2020 13 12 2020 13 0 Australia AU 22 12/14/2020 14 12 2020 4451 39 Azerbaijan AZ 23 12/13/2020 13 12 2020 4268 43 Azerbaijan AZ 24 12/14/2020 14 12 2020 15 O Bahamas BS 25 12/13/2020 13 12 2020 11 O Bahamas BS 26 1/1/2020 1 1 2020 0 O Bahrain BH 27 12/31/2019 31 12 2019 0 O Bahrain BH 28 3/19/2020 19 3 2020 0 O Barbados BB 29 3/18/2020 18 3 2020 1 O Barbados BB covid 19 Adjusted + K countryter popData21 continentExp AFG 38041757 Asia AFG 38041757 Asia ALB 2862427 Europe ALB 2862427 Europe DZA 43053054 Africa DZA 43053054 Africa AGO 31825299 Africa AGO 31825299 Africa AIA 14872 America AIA 14872 America 97115 America ATG 97115 America ARG 44780675 America 44780675 America ARM 2957728 Europe ARM 2957728 Europe ABW 106310 America ABW 106310 America AUS 25203200 Oceania AUS 25203200 Oceania AZE 10047719 Europe AZE 10047719 Europe BHS 389486 America BHS 389486 America BHR 1641164 Asia BHR 1641164 Asia BRB 287021 America BRB 287021 America ARG
Step by Step Solution
There are 3 Steps involved in it
Step: 1

Get Instant Access to Expert-Tailored Solutions
See step-by-step solutions with expert insights and AI powered tools for academic success
Step: 2

Step: 3
Ace Your Homework with AI
Get the answers you need in no time with our AI-driven, step-by-step assistance
Get Started
The Ultimate Apache Flink Introduction Streamlined Data Mastering Apache Flink For Real Time Processing
Authors: Big Data Landscape
1st Edition
B0CNN5YBX5, 979-8868164415