Please help Question 23 & 24


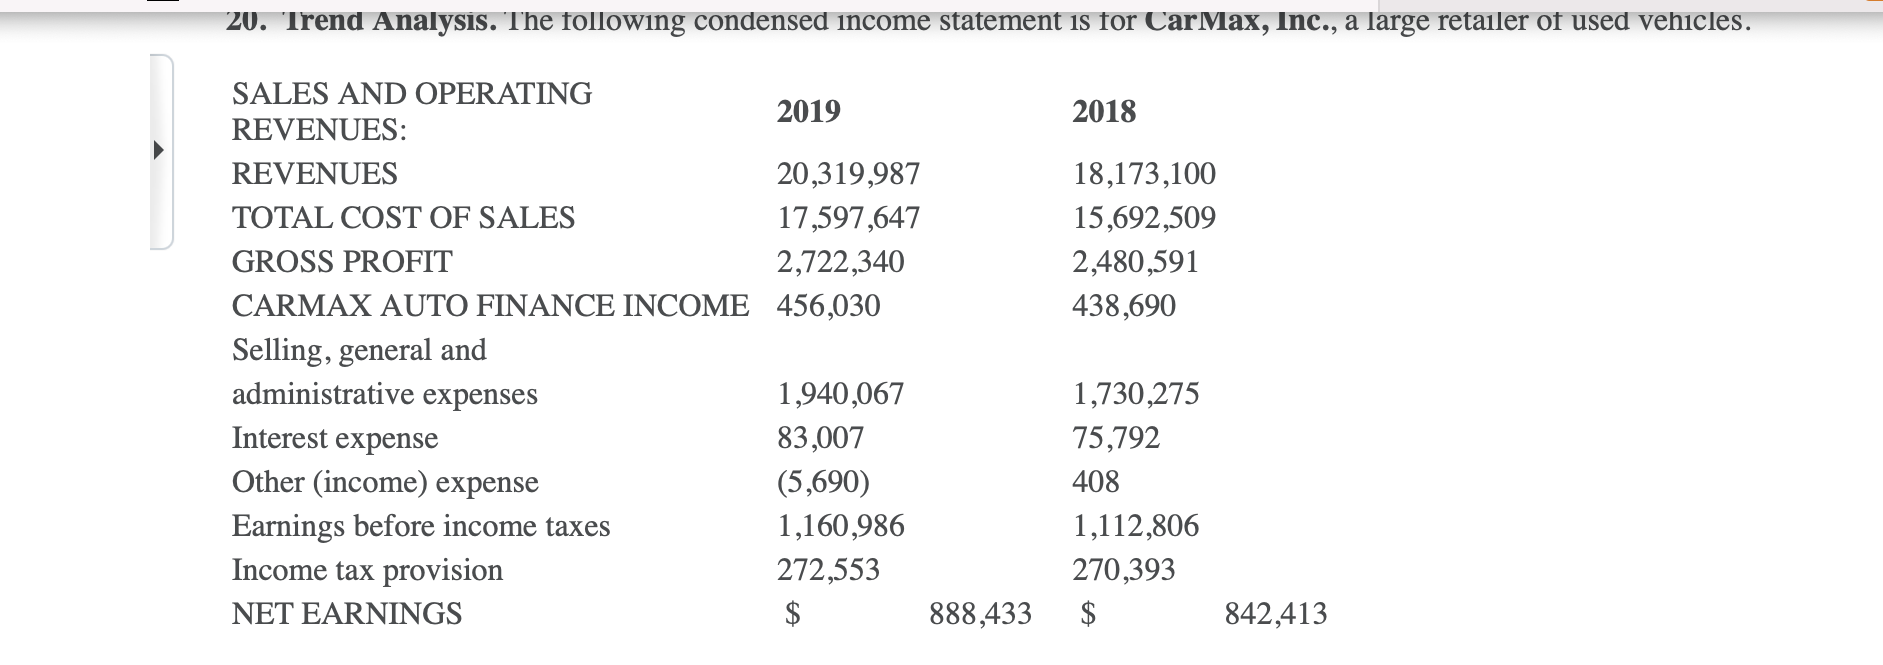
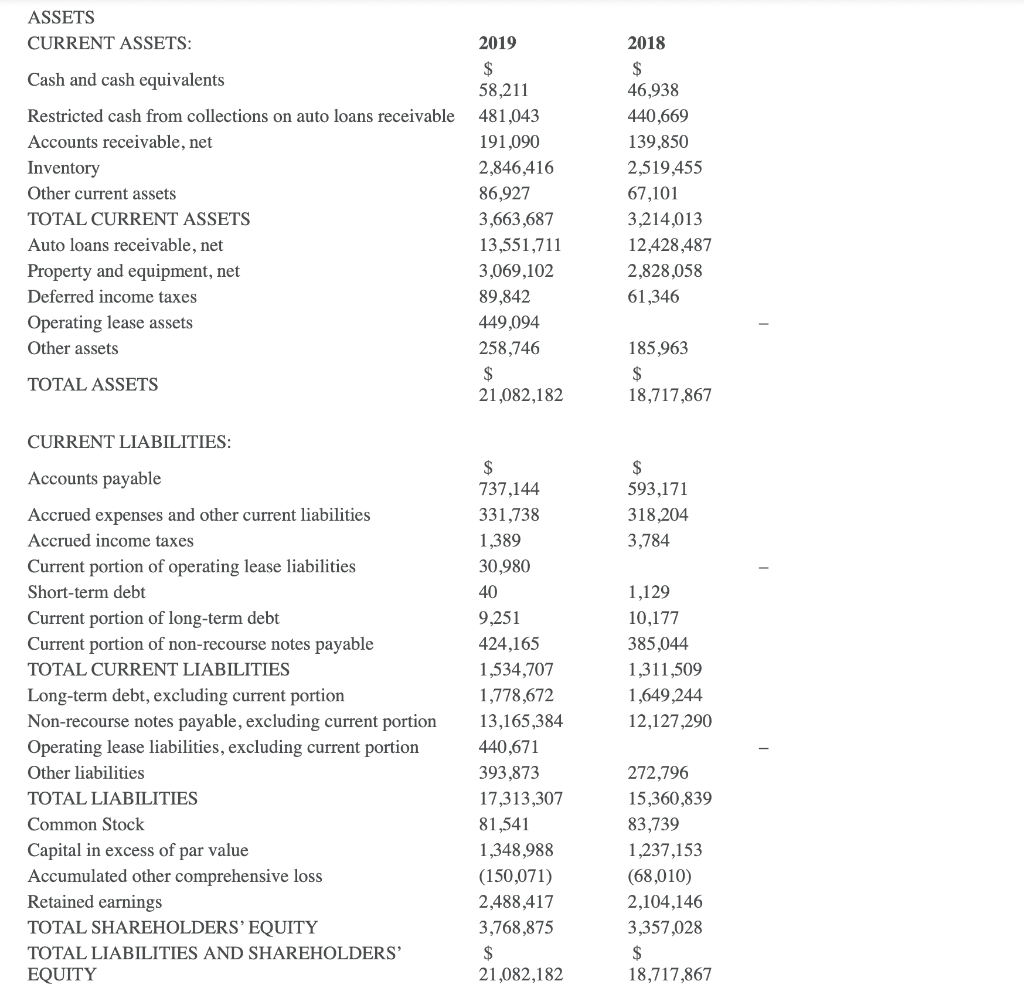
20. Trend Analysis. The following condensed income statement is for CarMax, Inc., a large retailer of used vehicles. 2018 18,173,100 15,692,509 2,480,591 438,690 SALES AND OPERATING 2019 REVENUES: REVENUES 20,319,987 TOTAL COST OF SALES 17,597,647 GROSS PROFIT 2,722,340 CARMAX AUTO FINANCE INCOME 456,030 Selling, general and administrative expenses 1,940,067 Interest expense 83,007 Other (income) expense (5,690) Earnings before income taxes 1,160,986 Income tax provision 272,553 NET EARNINGS $ 888,433 1,730,275 75,792 408 1,112,806 270,393 $ 842,413 ASSETS CURRENT ASSETS: Cash and cash equivalents Restricted cash from collections on auto loans receivable Accounts receivable, net Inventory Other current assets TOTAL CURRENT ASSETS Auto loans receivable, net Property and equipment, net Deferred income taxes Operating lease assets Other assets 2019 $ 58,211 481,043 191,090 2,846,416 86,927 3,663,687 13,551,711 3,069,102 89,842 449,094 258,746 $ 21,082,182 2018 $ 46,938 440,669 139,850 2,519,455 67,101 3,214,013 12,428,487 2,828.058 61,346 185,963 $ 18,717,867 TOTAL ASSETS CURRENT LIABILITIES: $ 737,144 331,738 1,389 30,980 $ 593,171 318,204 3,784 40 Accounts payable Accrued expenses and other current liabilities Accrued income taxes Current portion of operating lease liabilities Short-term debt Current portion of long-term debt Current portion of non-recourse notes payable TOTAL CURRENT LIABILITIES Long-term debt, excluding current portion Non-recourse notes payable, excluding current portion Operating lease liabilities, excluding current portion Other liabilities TOTAL LIABILITIES Common Stock Capital in excess of par value Accumulated other comprehensive loss Retained earnings TOTAL SHAREHOLDERS' EQUITY TOTAL LIABILITIES AND SHAREHOLDERS' EQUITY 1,129 10,177 385,044 1,311,509 1,649,244 12,127,290 9,251 424,165 1,534,707 1,778,672 13,165,384 440,671 393,873 17,313,307 81,541 1,348,988 (150,071) 2,488,417 3,768,875 $ 21,082,182 272,796 15,360,839 83,739 1,237,153 (68,010) 2,104,146 3,357,028 $ 18,717,867 23. Short-Term Liquidity Ratios. Refer to the condensed income statement for CarMax, Inc., in Exercise 20 and to the company's balance sheet in Exercise 22. Required: Compute the following short-term liquidity ratios for 2019, and provide a brief explanation after each ratio (round computations to two decimal places): 1. Current ratio 2. Quick ratio 3. Receivables turnover ratio and average collection period (assume all sales are on account) 4. Inventory turnover ratio and average sale period 24. Long-Term Solvency Ratios. Refer to the condensed income statement for CarMax, Inc., in Exercise 20 and to the company's balance sheet in Exercise 22. Required: Compute the following long-term solvency ratios for 2019, and provide a brief explanation after each ratio (round computations to two decimal places): 1. Debt to assets 2. Debt to equity 3. Times interest earned


