

Question
Please help Requirement 3. Briefly describe the conclusions you can draw from the variances. Kanji Corporation shows a(n) [ favorable / unfavorable ] sales-quantity variance
Please help


Requirement 3. Briefly describe the conclusions you can draw from the variances.
Kanji Corporation shows a(n) [ favorable / unfavorable ] sales-quantity variance because it sold [ fewer / more ] wine glasses in total than was budgeted. This is partially offset by a(n) [ favorable / unfavorable ] sales-mix variance because the actual mix of wine glasses sold has shifted in favor of the higher contribution margin [ Chic / Plain ] wine glasses.
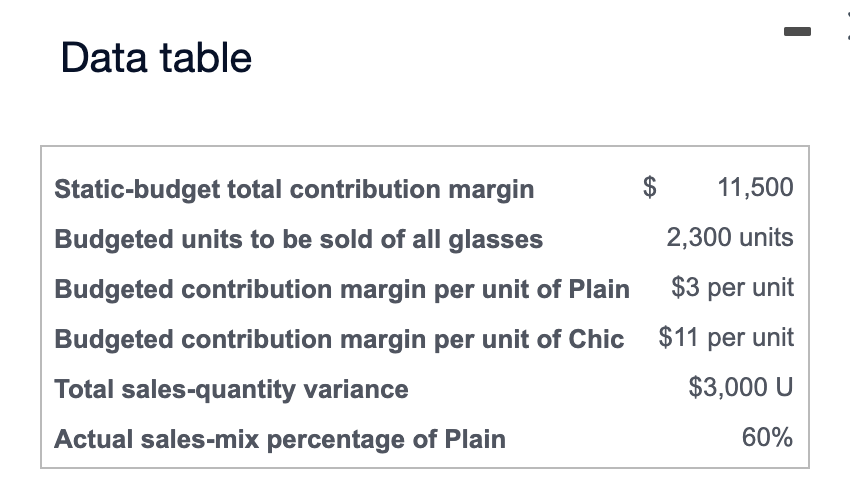
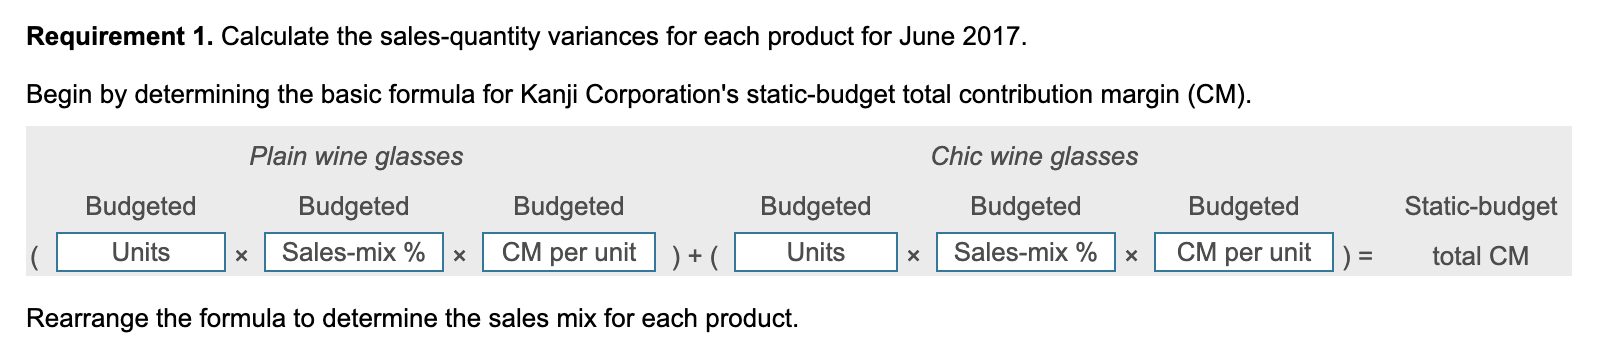
The Kanji Corporation sells two brands of wine glasses: Plain and Chic. Kanji provides the following information for sales in the month of June 2017: (Click the icon to view the data for sales.) All variances are computed in contribution-margin terms. Read the requirements. Data table Requirement 1. Calculate the sales-quantity variances for each product for June 2017. Begin by determining the basic formula for Kanji Corporation's static-budget total contribution margin (CM). Rearrange the formula to determine the sales mix for each product. Rearrange the formula to determine the sales mix for each product. The sales-mix percentage of Plain wine glasses is % The sales-mix percentage of Chic wine glasses is % Budgeted CM based on actual units sold at the budgeted mix Now determine the formula, then calculate the sales-quantity variances for each product for June 2017. Label each variance as favorable or unfavorable (U). (Enter percentages, if any, as decimals to two places, X.XX. Enter all variances as positive numbers.) Requirement 2. Calculate the individual-product and total sales-mix variances for June 2017. Calculate the individual-product and total sales-volume variances for June 2017. Begin with the individual-product sales-mix variances for June 2017. Determine the formula, then calculate the variance for each product Label each variance as favorable (F) or unfavorable (U). (Enter percentages, if any, as decimals to two places, X.XX. Enter all variances positive numbers.) Chic 1 1)x = The total sales-mix variance is Now calculate the individual-product sales-volume variances for June 2017. Determine the formula, then calculate the variance for ea product. Label each variance as favorable (F) or unfavorable (U). (Enter all variances as positive numbers.)Step by Step Solution
There are 3 Steps involved in it
Step: 1

Get Instant Access to Expert-Tailored Solutions
See step-by-step solutions with expert insights and AI powered tools for academic success
Step: 2

Step: 3
Ace Your Homework with AI
Get the answers you need in no time with our AI-driven, step-by-step assistance
Get Started
Principles Of Auditing
Authors: Vasuhi M
1st Edition
6206150747, 978-6206150749