Please Help. Thank you.
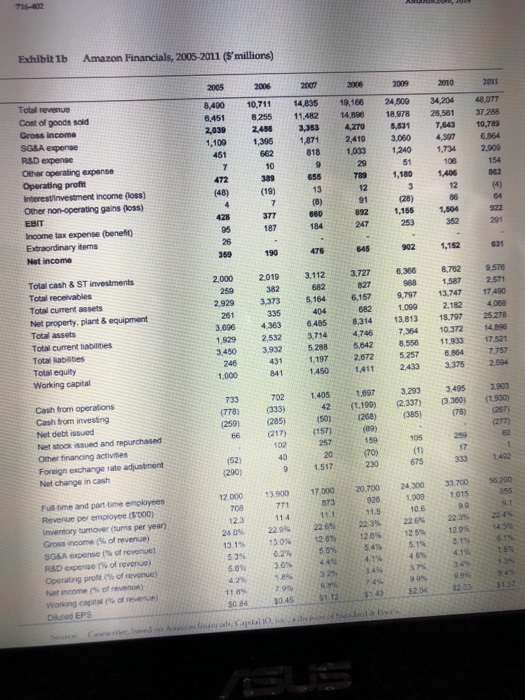
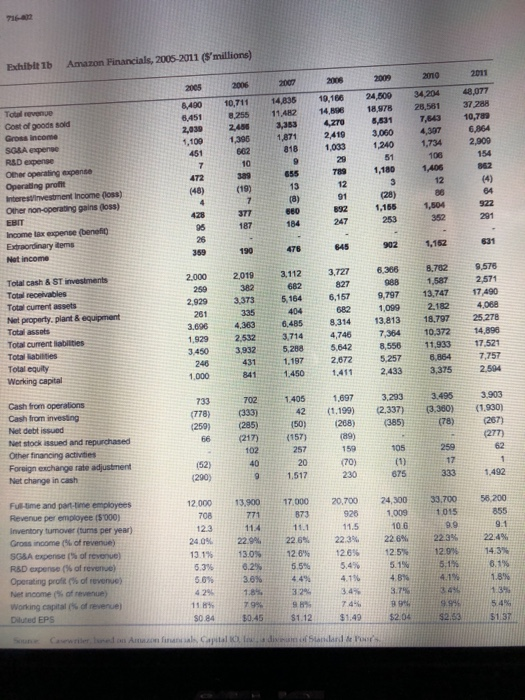
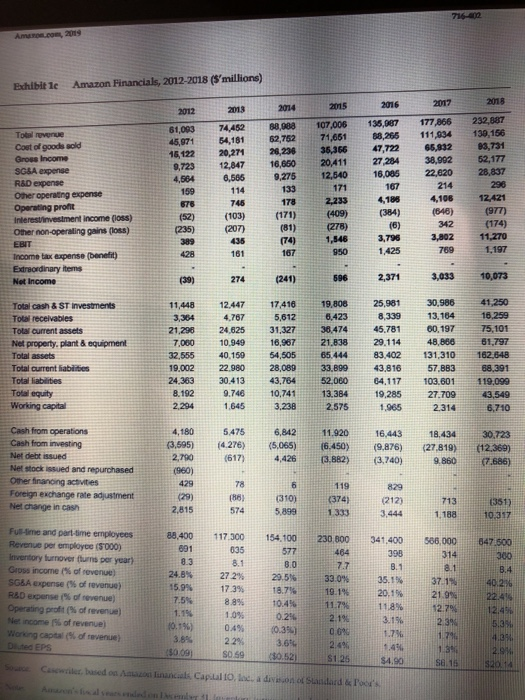
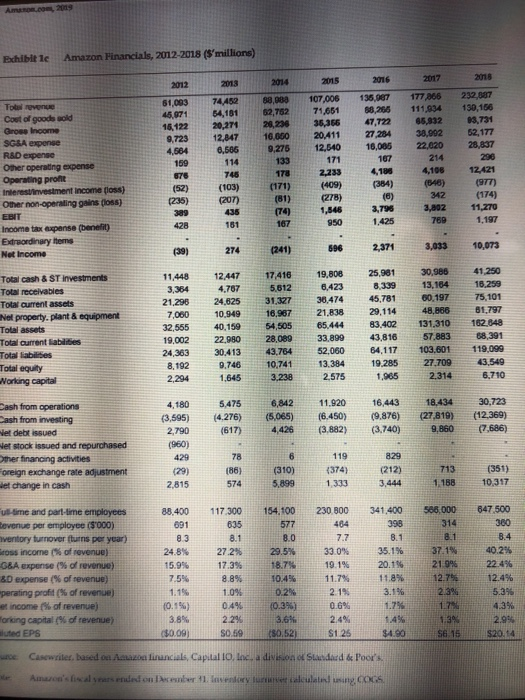
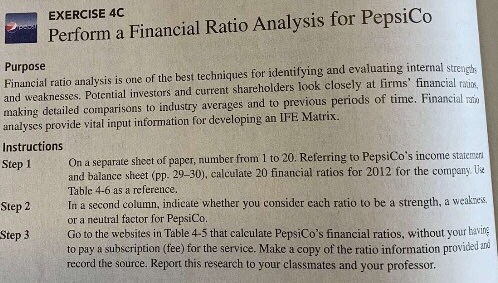
Exhibit Ib Amazon Financials, 2005-2011 (5'millions) 2005 2000 2016 no 2011 19.166 8,400 6,451 2,03 1,100 34 204 28,581 14 835 11.482 3.353 10,711 8.255 2450 1356 662 14.896 ZTO Total revenue Cost of goods sold Gross income SG&A expense RSD expense Other operating expense Operating profit Interestinvestment income (05) Other non-operating gains (los) 24.309 18.978 8.891 3.060 1,240 48,077 37 288 10,79 6.854 2.909 1.871 2.419 1033 818 1,734 1,180 ADS 362 (19) 88.33 (28) 1,166 EBIT Income tax expense benefit Extraordinary items Net Income 845 902 1,152 601 6.358 752 3.727 2.000 2019 9.578 2571 3,373 Total cash 8 ST Investments Total receivables Total current assets Net property, plant & equipment Total assets Total current liabilities Total abilities Total equity Working capital 3.112 682 5.164 404 6.485 3.714 5.258 1,197 1450 2,929 201 3.000 1.929 3.450 6,157 682 8.354 25278 9,797 1.099 13813 7354 8,556 5.257 2,532 3,932 431 13.747 2.182 18.797 10372 11.933 0.354 3.375 5,642 2872 17.521 7757 1.000 702 1.405 1.097 (1.100) 733 (778) 2501 3.293 (2.337) 385) (3 360) (1930) (205) 501 (157) 189) Cash from operations Cash from investing Net debt issued Net stocked and repurchased Other financing activities Foreign exchange rate adjustment Not change in cash 102 257 105 1492 (52) (290) 56200 12 000 130 17 000 20.700 928 24 300 1,009 33700 1015 114 123 240 131 120 1204 12.5 5.11 129 5.11 Fatime and part-time employees Revenge per m e (5000) Inventory tumovertus per year) Gross income of revenue) SOSA S ofrer RAD P orn Operating profits of revne et income of reven) Wong con Dud EPS 4301 22 3.05 18 501 794 5132 11 S084 51.12 $1.40 Exhibit 1b Amazon Financials, 2006-2011 ($'millions) 2009 2010 2011 2007 8.480 8.451 2,039 1,109 2006 10,711 8.255 2.456 1,396 14,836 11.482 3,353 10,186 14,896 ZTO 2/419 1.033 24,500 18.978 6,631 3,060 1.240 34 204 28,581 7.643 48,077 37 288 10,789 6,864 2.900 1871 818 1,734 2 1,180 1,406 AT2 655 Total revenue Cost of goods sold Gross income SC&A expense RSD expense Other operating expense Operating profit Interest investment Income (los) Other non-operating gains (los) EBIT Income tax expense (benefit) Extraordinary tems Not income (48) (19) 428 1,165 253 291 621 359 2,019 2.000 259 2,929 261 3.696 3.373 335 Total cash & ST investments Total receivables Total current assets Net property, plant & equipment Total assets Total current liabilities Total abilities Total equity Working capital 6.356 988 9,797 1.099 13.813 7.364 8,556 5,257 2433 3.727 827 6,157 682 8.314 4,746 5.642 2,672 1.411 8.782 1.587 13.747 2.182 18.797 10.372 11.933 6.864 3,375 4.363 9.575 2.571 17 490 4,068 25 278 14.898 17.521 7,757 2,504 1929 2,532 3.450 246 1.000 3932 431 3,714 5.288 1.197 1.450 1.405 733 (778) (259) 66 (333) (285) 3,233 (2.337) (385) 3495 (3.360) (78) 3.903 (1.930) (267) (277) 150) 1.097 (1.199) (268) (89) 159 (70) Cash from operations Cash from investing Net debt issued Net stock issued and repurchased Other financing activities Foreign exchange rate adjustment Net change in cash (217) (157) 257 (52) (290) 1.517 230 675 1.492 58 200 12.000 20,700 13.900 17.000 873 926 24,300 1,009 10.6 22.6% 123 2.4% Ful-time and part-time employees Revenue per employee (5000) Inventory tumover (tus per year) Gross income (of revenue) SGSA expense of revenue) RBD expense (% of revenue) Operating profit of revenue) Net income ( of revenue) Working capital of revenue) Diluted EPS 13 03 11.5 22 3% 12.6% 5.4 24.09 13.1% 5.396 5.6% $0.84 10.45 $1.12 $1,49 Sune Cawwerled on Amazon final Capital l di AMEL, 2019 Exhibit le Amazon Financials, 2012-2018 (S'millions) 2017 2016 2018 2013 2012 74,452 61,083 45.971 16,122 9,723 4,564 159 678 (52) (235) 54,181 20,271 12,847 6,565 2014 88,888 62.752 2236 10,650 9,275 2015 107,006 71,661 36,366 20,411 12,540 171 2,233 (409) (278) 135,987 88,265 47,722 27 284 16,085 167 Total revenue Cost of goods sold Grous Income SG&A expense R&D expense Other operating expense Operating profit Interestinvestment Income (loss) Other non-operating gains (los) EBIT Income tax expense (Denefit) Extraordinary Items Not Income 177,866 111,834 65,832 38,992 22,620 214 4,106 (646) 342 133 232,887 130, 156 83,731 52,177 28,837 296 12,421 (977) (174) 11,270 1.197 746 4.18 178 (171) (103) (384) (207) 1,546 3.802 (74) 167 3.795 1.425 950 789 (39) 274 (241) 596 2,371 3,033 10,073 Total cash & ST Investments To receivables Total current assets Net property.plant & equipment Total assets Total current liabilities Total liabilities Total equity Working capital 11,448 3,354 21.296 7,000 32,555 19.002 24,363 8.192 12.447 4,767 24.625 10.949 40.159 22 980 30.413 9.748 1,645 17,416 5,612 31,327 16,967 54 505 28,089 43,764 10.741 3,238 19,808 6,423 38,474 21.838 65.444 33,899 52.060 13,384 2.575 25,981 8,339 45.781 29.114 83 402 43,816 64,117 19,285 1.965 30.986 13,164 60,197 48,866 131,310 57.883 103.601 27.709 2314 41,250 16.259 75,101 61,797 162 848 88,391 119.099 43,549 6.710 2.294 5.475 (4.276) 6,842 (5.065) 4,426 11.920 [6.450) 13.882) 16,443 (9,876) (3,740) 18,434 (27.819) 30.723 (12.369) (7.686) (617) 9.860 Cash from operations Cash from investing Net debt issued Net stock issued and repurchased Other financing activities Foreign exchange rate adjustment Net change in cash 4,180 (3,595) 2,790 (960) 429 (29) 2,815 (310) (3741 829 (212) 3.444 (351) 10317 117300 154.100 230 000 341,400 395 586,000 547.500 135 Fu-me and part-time employees Revenue per employce (5000) Inventory turnover flurns per year) Gross income of revenue) SG&A expense (6 of revenue) R&D expense of revenue) Operating profit of revenue) Net income of revenue Working capital of revenue) Dited EPS 88.400 891 8.3 24.8% 15.99 7.5% 1.1% 10.19 29.5% 33.0% 19 19 04% 0.000 229 (0.350 3.81 $0.09 SO 59 Cewe based on a A linacal Capul 10, loc. a d onandard & Poor's AMADEL 2019 Ethibit 1e Amazon Financials, 2012-2018 (S'millions) 2012 2017 016 74,482 64,181 61,093 45.971 16122 9.723 20,21 BEDS 52,762 2008 16.000 9.276 136 OCT 69,285 47.722 2724 19.099 107.006 71,651 36,366 20.411 12.540 171 2,233 177.006 111,834 85,832 34,992 22.02 Total revenue Cost of goods sold Groe Income SG&A expone R&D expense Other operating expense Operating profit Interestinvestment income foss) Other non-operating gains (los) 12.847 0.506 232 087 130,166 25,731 52,177 26.097 4504 214 4,105 (546) (384) 12,421 (97) (174) 11,270 1,197 1.425 Income tax expense Denett) Extraordinary tems Nex Income (39) 696 2,371 10,073 11448 17.416 5.812 Total cash & ST Investments Total receivables Total current assets Net property.plant & equipment Total assets Total current liabilities Total liabilities Total equity Working capital 21.295 7,060 32.555 19,002 24,363 8,192 2.294 12.447 4.787 24.625 10.949 40.159 22.980 30.413 0.746 1.645 31.327 16.967 54 505 28.089 43,764 10,741 3.238 19,808 6,423 38,474 21,838 65.444 33.899 52,060 13.384 2.575 25,981 8,339 45,781 29.114 83.402 43,816 64,117 19.285 1.865 30.986 13,164 60,197 48,888 131,310 57.883 103,601 27,709 2.314 41.250 16.259 75,101 81.797 162.848 58,391 119,099 43,549 6.710 5.475 (4.276) 6 M2 (5,065) 4,426 11.920 (6.450) (3.882) 16.443 (9.876) (3.740) (27,819) 9.860 30.723 (12,369) (7,686) Dash from operations Cash from investing et debt issued Her stock issued and repurchased Other financing activities oreign exchange rate adjustment et change in cash (3.595) 2.790 (960) 429 (29) 119 (374) 829 212 (310) 2.815 (351) 10317 1 333 117300 154,100 230.000 588.000 88.400 691 635 8.1 647 500 360 ultime and part-time employees evenue per employee (3 000) ventory turnover furns per year) oss income of revenue) 38A expense of revenue) 3D expense of revenue) perating profit (% of revenue) income of revenue) Pricing capital of revenue) ted EPS 2725 17.3% 24.8% 15.9% 7.5 1.19 (0.1%) 7.7 33.0% 19.19 11.7% 2.1% 0.6% 402 22.4% 12.45 0.3% 0.4% 220 3.6 $0.09 0.59 $0.52 Caswer, based on Ame's final a financials, Capital io, loc. a division of Standard & Poor's ended on weber 11. lasnory l e asing COGS EXERCISE 4C Perform a Financial Ratio Analysis for PepsiCo Purpose Financial ratio analysis is one of the best techniques for identifying and evaluating internal strength and weaknesses. Potential investors and current shareholders look closely at firms' financial making detailed comparisons to industry averages and to previous periods of time. Financial rating analyses provide vital input information for developing an IFE Matrix. Instructions Step 1 On a separate sheet of paper, number from 1 to 20. Referring to PepsiCo's income statement and balance sheet (pp. 29-30), calculate 20 financial ratios for 2012 for the company. Use Table 4-6 as a reference. Step 2 In a second column, indicate whether you consider cach ratio to be a strength, a weaknes or a neutral factor for PepsiCo. Step 3 Go to the websites in Table 4-5 that calculate PepsiCo's financial ratios, without your having to pay a subscription (fee) for the service. Make a copy of the ratio information provided record the source. Report this research to your classmates and your professor. Exhibit Ib Amazon Financials, 2005-2011 (5'millions) 2005 2000 2016 no 2011 19.166 8,400 6,451 2,03 1,100 34 204 28,581 14 835 11.482 3.353 10,711 8.255 2450 1356 662 14.896 ZTO Total revenue Cost of goods sold Gross income SG&A expense RSD expense Other operating expense Operating profit Interestinvestment income (05) Other non-operating gains (los) 24.309 18.978 8.891 3.060 1,240 48,077 37 288 10,79 6.854 2.909 1.871 2.419 1033 818 1,734 1,180 ADS 362 (19) 88.33 (28) 1,166 EBIT Income tax expense benefit Extraordinary items Net Income 845 902 1,152 601 6.358 752 3.727 2.000 2019 9.578 2571 3,373 Total cash 8 ST Investments Total receivables Total current assets Net property, plant & equipment Total assets Total current liabilities Total abilities Total equity Working capital 3.112 682 5.164 404 6.485 3.714 5.258 1,197 1450 2,929 201 3.000 1.929 3.450 6,157 682 8.354 25278 9,797 1.099 13813 7354 8,556 5.257 2,532 3,932 431 13.747 2.182 18.797 10372 11.933 0.354 3.375 5,642 2872 17.521 7757 1.000 702 1.405 1.097 (1.100) 733 (778) 2501 3.293 (2.337) 385) (3 360) (1930) (205) 501 (157) 189) Cash from operations Cash from investing Net debt issued Net stocked and repurchased Other financing activities Foreign exchange rate adjustment Not change in cash 102 257 105 1492 (52) (290) 56200 12 000 130 17 000 20.700 928 24 300 1,009 33700 1015 114 123 240 131 120 1204 12.5 5.11 129 5.11 Fatime and part-time employees Revenge per m e (5000) Inventory tumovertus per year) Gross income of revenue) SOSA S ofrer RAD P orn Operating profits of revne et income of reven) Wong con Dud EPS 4301 22 3.05 18 501 794 5132 11 S084 51.12 $1.40 Exhibit 1b Amazon Financials, 2006-2011 ($'millions) 2009 2010 2011 2007 8.480 8.451 2,039 1,109 2006 10,711 8.255 2.456 1,396 14,836 11.482 3,353 10,186 14,896 ZTO 2/419 1.033 24,500 18.978 6,631 3,060 1.240 34 204 28,581 7.643 48,077 37 288 10,789 6,864 2.900 1871 818 1,734 2 1,180 1,406 AT2 655 Total revenue Cost of goods sold Gross income SC&A expense RSD expense Other operating expense Operating profit Interest investment Income (los) Other non-operating gains (los) EBIT Income tax expense (benefit) Extraordinary tems Not income (48) (19) 428 1,165 253 291 621 359 2,019 2.000 259 2,929 261 3.696 3.373 335 Total cash & ST investments Total receivables Total current assets Net property, plant & equipment Total assets Total current liabilities Total abilities Total equity Working capital 6.356 988 9,797 1.099 13.813 7.364 8,556 5,257 2433 3.727 827 6,157 682 8.314 4,746 5.642 2,672 1.411 8.782 1.587 13.747 2.182 18.797 10.372 11.933 6.864 3,375 4.363 9.575 2.571 17 490 4,068 25 278 14.898 17.521 7,757 2,504 1929 2,532 3.450 246 1.000 3932 431 3,714 5.288 1.197 1.450 1.405 733 (778) (259) 66 (333) (285) 3,233 (2.337) (385) 3495 (3.360) (78) 3.903 (1.930) (267) (277) 150) 1.097 (1.199) (268) (89) 159 (70) Cash from operations Cash from investing Net debt issued Net stock issued and repurchased Other financing activities Foreign exchange rate adjustment Net change in cash (217) (157) 257 (52) (290) 1.517 230 675 1.492 58 200 12.000 20,700 13.900 17.000 873 926 24,300 1,009 10.6 22.6% 123 2.4% Ful-time and part-time employees Revenue per employee (5000) Inventory tumover (tus per year) Gross income (of revenue) SGSA expense of revenue) RBD expense (% of revenue) Operating profit of revenue) Net income ( of revenue) Working capital of revenue) Diluted EPS 13 03 11.5 22 3% 12.6% 5.4 24.09 13.1% 5.396 5.6% $0.84 10.45 $1.12 $1,49 Sune Cawwerled on Amazon final Capital l di AMEL, 2019 Exhibit le Amazon Financials, 2012-2018 (S'millions) 2017 2016 2018 2013 2012 74,452 61,083 45.971 16,122 9,723 4,564 159 678 (52) (235) 54,181 20,271 12,847 6,565 2014 88,888 62.752 2236 10,650 9,275 2015 107,006 71,661 36,366 20,411 12,540 171 2,233 (409) (278) 135,987 88,265 47,722 27 284 16,085 167 Total revenue Cost of goods sold Grous Income SG&A expense R&D expense Other operating expense Operating profit Interestinvestment Income (loss) Other non-operating gains (los) EBIT Income tax expense (Denefit) Extraordinary Items Not Income 177,866 111,834 65,832 38,992 22,620 214 4,106 (646) 342 133 232,887 130, 156 83,731 52,177 28,837 296 12,421 (977) (174) 11,270 1.197 746 4.18 178 (171) (103) (384) (207) 1,546 3.802 (74) 167 3.795 1.425 950 789 (39) 274 (241) 596 2,371 3,033 10,073 Total cash & ST Investments To receivables Total current assets Net property.plant & equipment Total assets Total current liabilities Total liabilities Total equity Working capital 11,448 3,354 21.296 7,000 32,555 19.002 24,363 8.192 12.447 4,767 24.625 10.949 40.159 22 980 30.413 9.748 1,645 17,416 5,612 31,327 16,967 54 505 28,089 43,764 10.741 3,238 19,808 6,423 38,474 21.838 65.444 33,899 52.060 13,384 2.575 25,981 8,339 45.781 29.114 83 402 43,816 64,117 19,285 1.965 30.986 13,164 60,197 48,866 131,310 57.883 103.601 27.709 2314 41,250 16.259 75,101 61,797 162 848 88,391 119.099 43,549 6.710 2.294 5.475 (4.276) 6,842 (5.065) 4,426 11.920 [6.450) 13.882) 16,443 (9,876) (3,740) 18,434 (27.819) 30.723 (12.369) (7.686) (617) 9.860 Cash from operations Cash from investing Net debt issued Net stock issued and repurchased Other financing activities Foreign exchange rate adjustment Net change in cash 4,180 (3,595) 2,790 (960) 429 (29) 2,815 (310) (3741 829 (212) 3.444 (351) 10317 117300 154.100 230 000 341,400 395 586,000 547.500 135 Fu-me and part-time employees Revenue per employce (5000) Inventory turnover flurns per year) Gross income of revenue) SG&A expense (6 of revenue) R&D expense of revenue) Operating profit of revenue) Net income of revenue Working capital of revenue) Dited EPS 88.400 891 8.3 24.8% 15.99 7.5% 1.1% 10.19 29.5% 33.0% 19 19 04% 0.000 229 (0.350 3.81 $0.09 SO 59 Cewe based on a A linacal Capul 10, loc. a d onandard & Poor's AMADEL 2019 Ethibit 1e Amazon Financials, 2012-2018 (S'millions) 2012 2017 016 74,482 64,181 61,093 45.971 16122 9.723 20,21 BEDS 52,762 2008 16.000 9.276 136 OCT 69,285 47.722 2724 19.099 107.006 71,651 36,366 20.411 12.540 171 2,233 177.006 111,834 85,832 34,992 22.02 Total revenue Cost of goods sold Groe Income SG&A expone R&D expense Other operating expense Operating profit Interestinvestment income foss) Other non-operating gains (los) 12.847 0.506 232 087 130,166 25,731 52,177 26.097 4504 214 4,105 (546) (384) 12,421 (97) (174) 11,270 1,197 1.425 Income tax expense Denett) Extraordinary tems Nex Income (39) 696 2,371 10,073 11448 17.416 5.812 Total cash & ST Investments Total receivables Total current assets Net property.plant & equipment Total assets Total current liabilities Total liabilities Total equity Working capital 21.295 7,060 32.555 19,002 24,363 8,192 2.294 12.447 4.787 24.625 10.949 40.159 22.980 30.413 0.746 1.645 31.327 16.967 54 505 28.089 43,764 10,741 3.238 19,808 6,423 38,474 21,838 65.444 33.899 52,060 13.384 2.575 25,981 8,339 45,781 29.114 83.402 43,816 64,117 19.285 1.865 30.986 13,164 60,197 48,888 131,310 57.883 103,601 27,709 2.314 41.250 16.259 75,101 81.797 162.848 58,391 119,099 43,549 6.710 5.475 (4.276) 6 M2 (5,065) 4,426 11.920 (6.450) (3.882) 16.443 (9.876) (3.740) (27,819) 9.860 30.723 (12,369) (7,686) Dash from operations Cash from investing et debt issued Her stock issued and repurchased Other financing activities oreign exchange rate adjustment et change in cash (3.595) 2.790 (960) 429 (29) 119 (374) 829 212 (310) 2.815 (351) 10317 1 333 117300 154,100 230.000 588.000 88.400 691 635 8.1 647 500 360 ultime and part-time employees evenue per employee (3 000) ventory turnover furns per year) oss income of revenue) 38A expense of revenue) 3D expense of revenue) perating profit (% of revenue) income of revenue) Pricing capital of revenue) ted EPS 2725 17.3% 24.8% 15.9% 7.5 1.19 (0.1%) 7.7 33.0% 19.19 11.7% 2.1% 0.6% 402 22.4% 12.45 0.3% 0.4% 220 3.6 $0.09 0.59 $0.52 Caswer, based on Ame's final a financials, Capital io, loc. a division of Standard & Poor's ended on weber 11. lasnory l e asing COGS EXERCISE 4C Perform a Financial Ratio Analysis for PepsiCo Purpose Financial ratio analysis is one of the best techniques for identifying and evaluating internal strength and weaknesses. Potential investors and current shareholders look closely at firms' financial making detailed comparisons to industry averages and to previous periods of time. Financial rating analyses provide vital input information for developing an IFE Matrix. Instructions Step 1 On a separate sheet of paper, number from 1 to 20. Referring to PepsiCo's income statement and balance sheet (pp. 29-30), calculate 20 financial ratios for 2012 for the company. Use Table 4-6 as a reference. Step 2 In a second column, indicate whether you consider cach ratio to be a strength, a weaknes or a neutral factor for PepsiCo. Step 3 Go to the websites in Table 4-5 that calculate PepsiCo's financial ratios, without your having to pay a subscription (fee) for the service. Make a copy of the ratio information provided record the source. Report this research to your classmates and your professor


