Answered step by step
Verified Expert Solution
Link Copied!

Question

1 Approved Answer

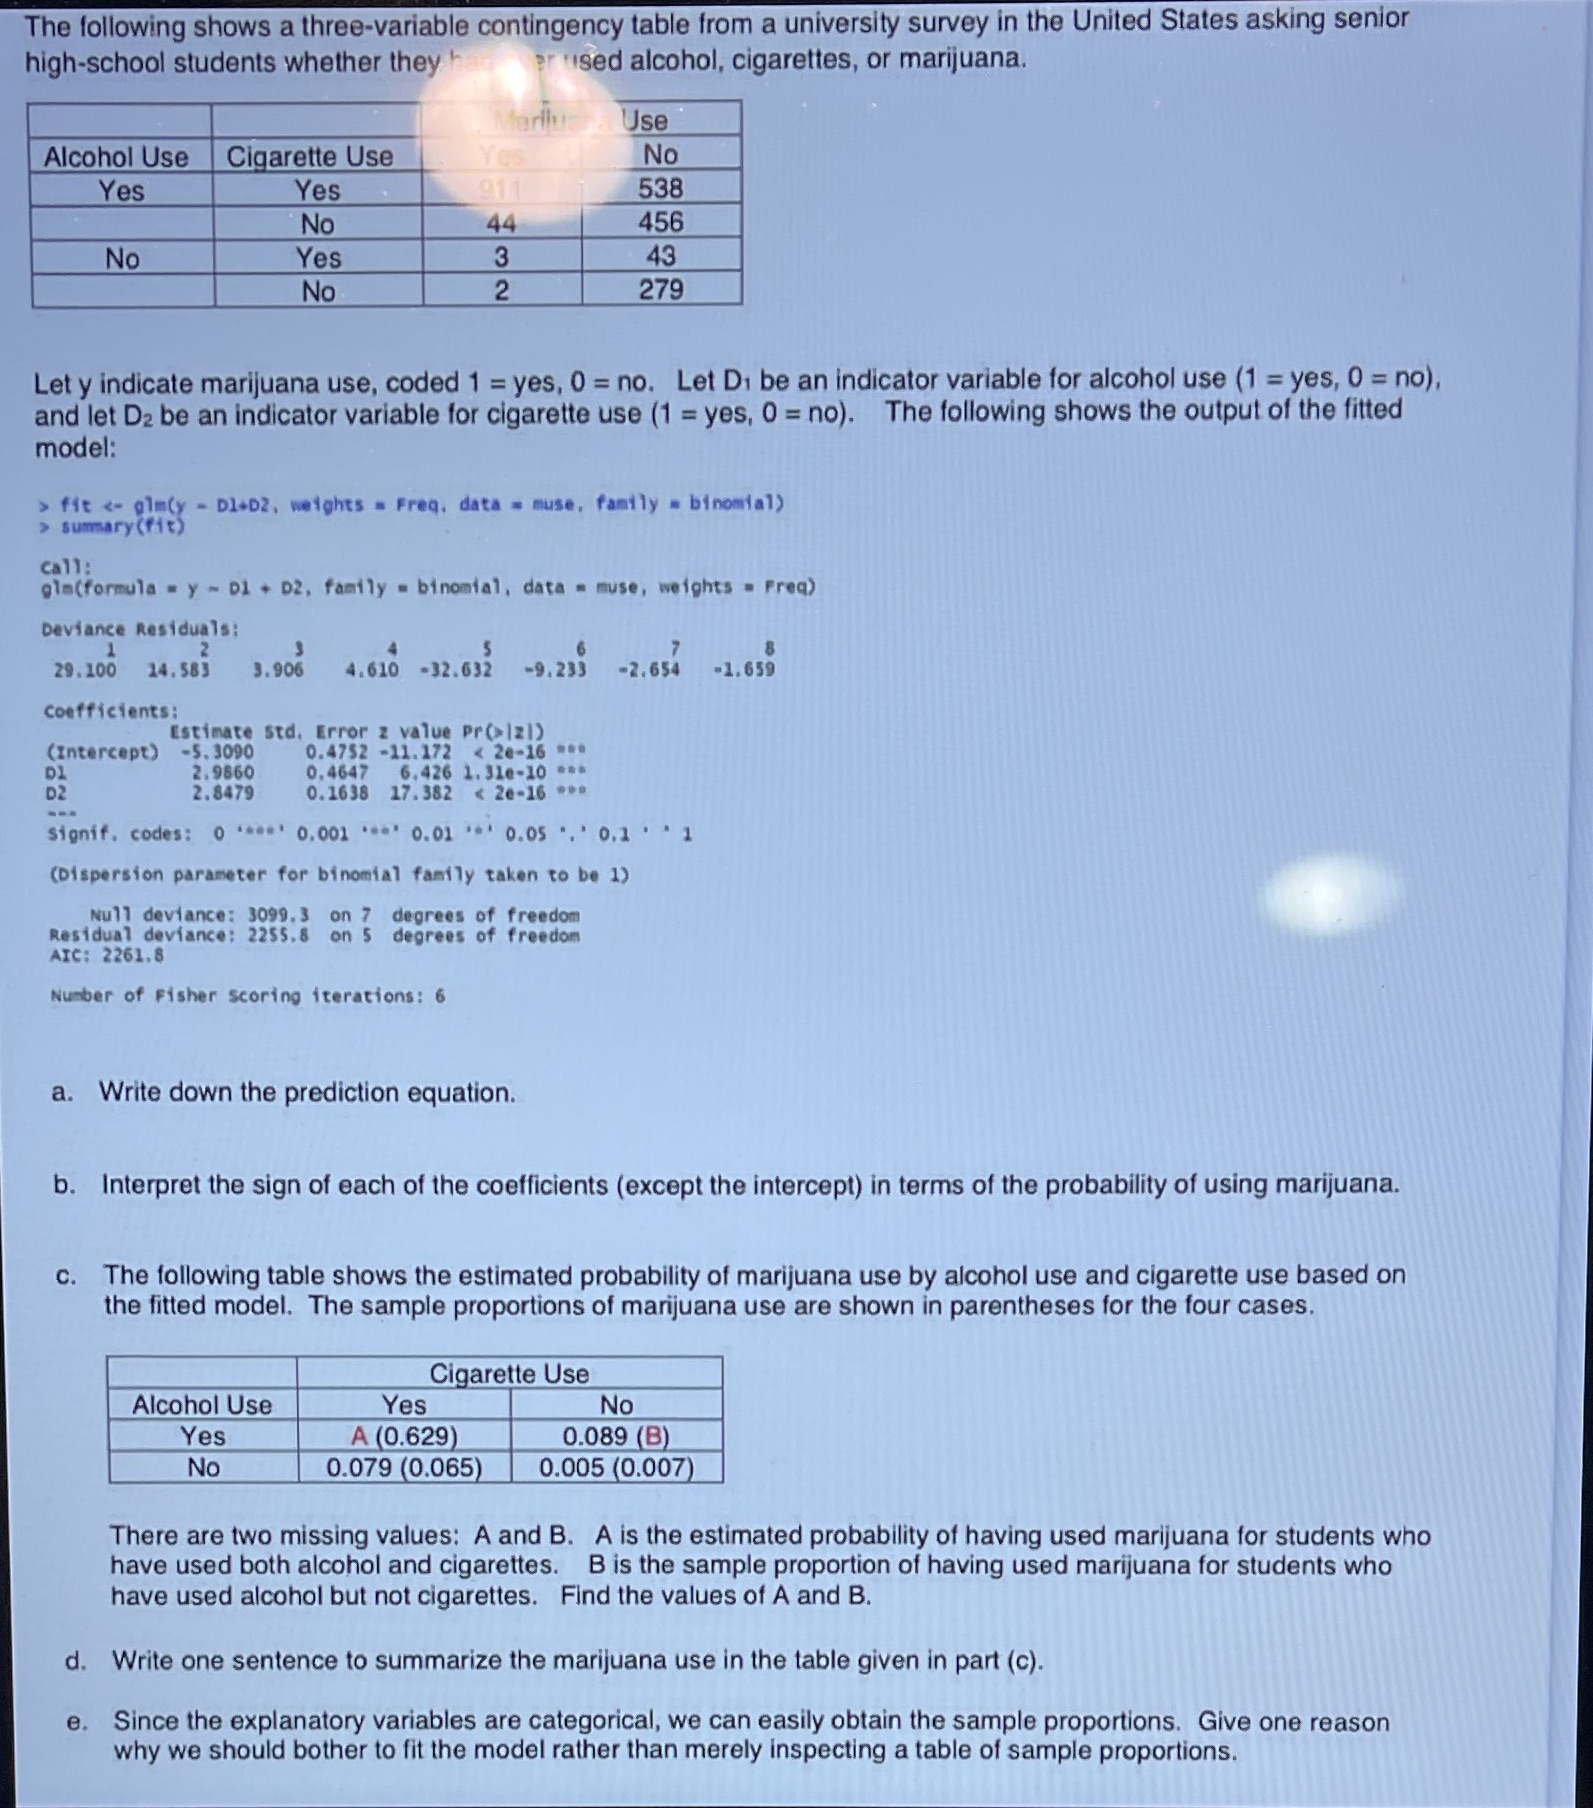
Please help to answer The following shows a three-variable contingency table from a university survey in the United States asking senior high-school students whether they

Please help to answer

image text in transcribed
The following shows a three-variable contingency table from a university survey in the United States asking senior high-school students whether they er used alcohol, cigarettes, or marijuana. Mariluz Jse Alcohol Use Cigarette Use Yes No Yes Yes 917 538 No 44 456 No Yes 3 43 No 2 279 Let y indicate marijuana use, coded 1 = yes, 0 = no. Let Di be an indicator variable for alcohol use (1 = yes, 0 = no), and let D2 be an indicator variable for cigarette use (1 = yes, 0 = no). The following shows the output of the fitted model: > fit summary (fit) call: gim(formula = y - DI + D2, family = binomial, data = muse, weights = Freq) Deviance Residuals: 29. 100 14. 583 3.906 4.610 -32.632 -9.233 -2.654 -1.659 Coefficients: Estimate std. Error 2 value Pr(> |21) (Intercept) -5. 3090 0.4752 -11. 172 Signif. codes: 0 .*# ' 0.001 ..' 0.01 .' 0.05 . . ' 0.1 . * 1 (Dispersion parameter for binomial family taken to be 1) Null deviance: 3099.3 on 7 degrees of freedom Residual deviance: 2255.8 on 5 degrees of freedom AIC: 2261. 8 Number of Fisher scoring iterations: 6 a. Write down the prediction equation. b. Interpret the sign of each of the coefficients (except the intercept) in terms of the probability of using marijuana. C. The following table shows the estimated probability of marijuana use by alcohol use and cigarette use based on the fitted model. The sample proportions of marijuana use are shown in parentheses for the four cases. Cigarette Use Alcohol Use Yes No Yes A (0.629) 0.089 (B) No 0.079 (0.065) 0.005 (0.007) There are two missing values: A and B. A is the estimated probability of having used marijuana for students who have used both alcohol and cigarettes. B is the sample proportion of having used marijuana for students who have used alcohol but not cigarettes. Find the values of A and B. d. Write one sentence to summarize the marijuana use in the table given in part (c). e. Since the explanatory variables are categorical, we can easily obtain the sample proportions. Give one reason why we should bother to fit the model rather than merely inspecting a table of sample proportions

Step by Step Solution

There are 3 Steps involved in it

Step: 1

blur-text-image

Get Instant Access to Expert-Tailored Solutions

See step-by-step solutions with expert insights and AI powered tools for academic success

Step: 2

blur-text-image

Step: 3

blur-text-image

Ace Your Homework with AI

Get the answers you need in no time with our AI-driven, step-by-step assistance

Get Started

Recommended Textbook for

WebAssign For Trigonometry

Authors: James Stewart

2nd Edition

1337772313, 9781337772310

More Books

Students also viewed these Mathematics questions