

Question
Please help using MATLAB, how do I initialize the mycounts in order to be used as a way to count the number of exams scores
Please help using MATLAB, how do I initialize the "mycounts" in order to be used as a way to count the number of exams scores for each grade.
Also, How do I fix my edges in code below? once everything is done its suppose to output a bar graph I dont under stand what I did wrong please help!
Grades are:
65 77 69 75 69 61 74 70 66 68 81 80 71 74 79 88 76 80 88 79 69 77 74 69 76 89 93 78 77 80 55 64 60 50 63 84 83 80 77 78 86 75 81 87 79 84 82 86 92 85 71 70 73 81 79 81 88 80 79 83 84 78 80 74 80 81 77 81 83 79 78 66 90 84 75 67 74 73 76 72 96 87 80 78 82 66 69 75 68 70 73 75 64 76 74 75 68 82 85 79 59 64 67 60 67 71 71 69 78 75 69 68 68 60 66 63 75 75 69 77 79 83 91 90 87 76 80 80 69 76 63 67 62 66 72 85 78 88 79 83 87 84 85 90 80 88 91 89 81 77 80 76 73 75 73 71 73 76 90 79 65 67 69 64 65 84 89 85 83 79 71 67 62 73 67 75 75 73 65 77 81 72 56 69 68 79 69 65 64 70 64 71 78 69 71 65 72 65 71 72 84 72 84 78 78 77 81 85 86 82 70 77 80 82 79 75 71 67 68 71 84 77 59 59 70 75 77 75 85 79 73 67 82 71 72 92 75 71 73 74 90 83 88 78 86 79 74 65 70 68 80 74 83 79 73 71 81 69 52 74 73 67 82 76 82 71 69 82 88 84 58 63 66 72 64 79 73 70 69 71 73 77 74 72 70 64 79 83 70 79 77 86 79 93 84 82 73 76 91 74 81 84 74 88 77 59 71 66 76 70 54 67 67 66 63 82 84 69 63 77 57 71 63 67 69 79 78 70 82 76 79 68 71 87 76 73 68 82 70 76 74 77 78 85 79 82 84 86 88 77 63 70 72 78 70 64 69 77 67 74 73 81 73 76 71 69 81 71 74 72 87 77 78 73 76 68 66 74 69 68 81 76 78 74 74 73 75 78 68 80 83 83 89 91 86 73 77 70 75 77 80 78 76 70 71 73 77 79 81 72 73 74 70 74 76 71 72 75 64 71 66 68 84 75 73 78 75 77 74 78 64 78 75 77 71 74 71 75 74 72 68 74 73 71 73 67 70 67 73 67 75 88 81 81 81 75 70 72 68 70 80 74 72 72 70 85 76 86 84 78 74 71 60 69 73 76 79 79 80 73 80 62 59 60 67 77 77 72 75 75 93 80 80 78 83 70 71 67 66 73 86 72 73 84 81 80 79 72 85 83 81 76 81 69 75 83 77 78 74 77 68 71 77 82 77 60 64 70 66 74 85 74 72 68 74 64 63 66 71 67 74 68 78 76 72 82 78 72 76 72 81 69 68 66 73 77 73 75 78 75 66 79 78 93 80 85 76 73 72 73 75 84 85 81 77 81 89 83 85 85 69 63 73 70 73 60 69 74 66 75 83 79 86 74 82 72 83 77 69 75
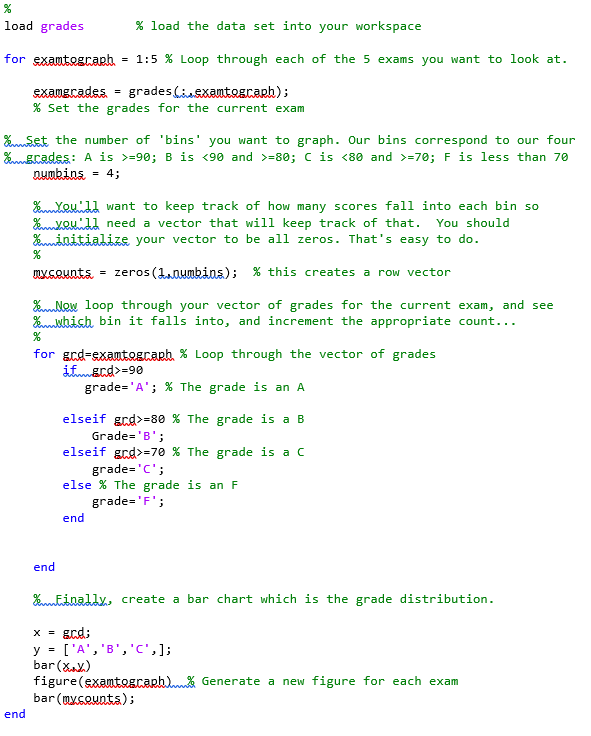
% load grades % load the data set into your workspace for exautograph = 1:5 % Loop through each of the 5 exams you want to look at. examecades. grades examtegcarb); % Set the grades for the current exam Set the number of 'bins' you want to graph. Our bins correspond to our four Kecades: A is >=90; B is =80; C is =70; F is less than 70 numbins = 4; Keunde want to keep track of how many scores fall into each bin so Freundd need a vector that will keep track of that. You should Kuinitialize your vector to be all zeros. That's easy to do. % my seunts = zeros (1. aumbins); % this creates a row vector Endow loop through your vector of grades for the current exam, and see Kwhish bin it falls into, and increment the appropriate count... for scd=exantegcaph % Loop through the vector of grades ifmgcd>=90 grade='A'; % The grade is an A elseif god>=80 % The grade is a B Grade='B'; elseif gcd>=70 % The grade is ac grade='c'; else % The grade is an F grade='F'; end end Kombinadlids create a bar chart which is the grade distribution. &cdi y = ['A', 'B', 'C',]; bar(x) figure (examtegcarh..me Generate a new figure for each exam bar(my seunts); end % load grades % load the data set into your workspace for exautograph = 1:5 % Loop through each of the 5 exams you want to look at. examecades. grades examtegcarb); % Set the grades for the current exam Set the number of 'bins' you want to graph. Our bins correspond to our four Kecades: A is >=90; B is =80; C is =70; F is less than 70 numbins = 4; Keunde want to keep track of how many scores fall into each bin so Freundd need a vector that will keep track of that. You should Kuinitialize your vector to be all zeros. That's easy to do. % my seunts = zeros (1. aumbins); % this creates a row vector Endow loop through your vector of grades for the current exam, and see Kwhish bin it falls into, and increment the appropriate count... for scd=exantegcaph % Loop through the vector of grades ifmgcd>=90 grade='A'; % The grade is an A elseif god>=80 % The grade is a B Grade='B'; elseif gcd>=70 % The grade is ac grade='c'; else % The grade is an F grade='F'; end end Kombinadlids create a bar chart which is the grade distribution. &cdi y = ['A', 'B', 'C',]; bar(x) figure (examtegcarh..me Generate a new figure for each exam bar(my seunts); endStep by Step Solution
There are 3 Steps involved in it
Step: 1

Get Instant Access to Expert-Tailored Solutions
See step-by-step solutions with expert insights and AI powered tools for academic success
Step: 2

Step: 3
Ace Your Homework with AI
Get the answers you need in no time with our AI-driven, step-by-step assistance
Get Started
Upgrading Oracle Databases Oracle Database New Features
Authors: Charles Kim, Gary Gordhamer, Sean Scott
1st Edition
B0BL12WFP6, 979-8359657501