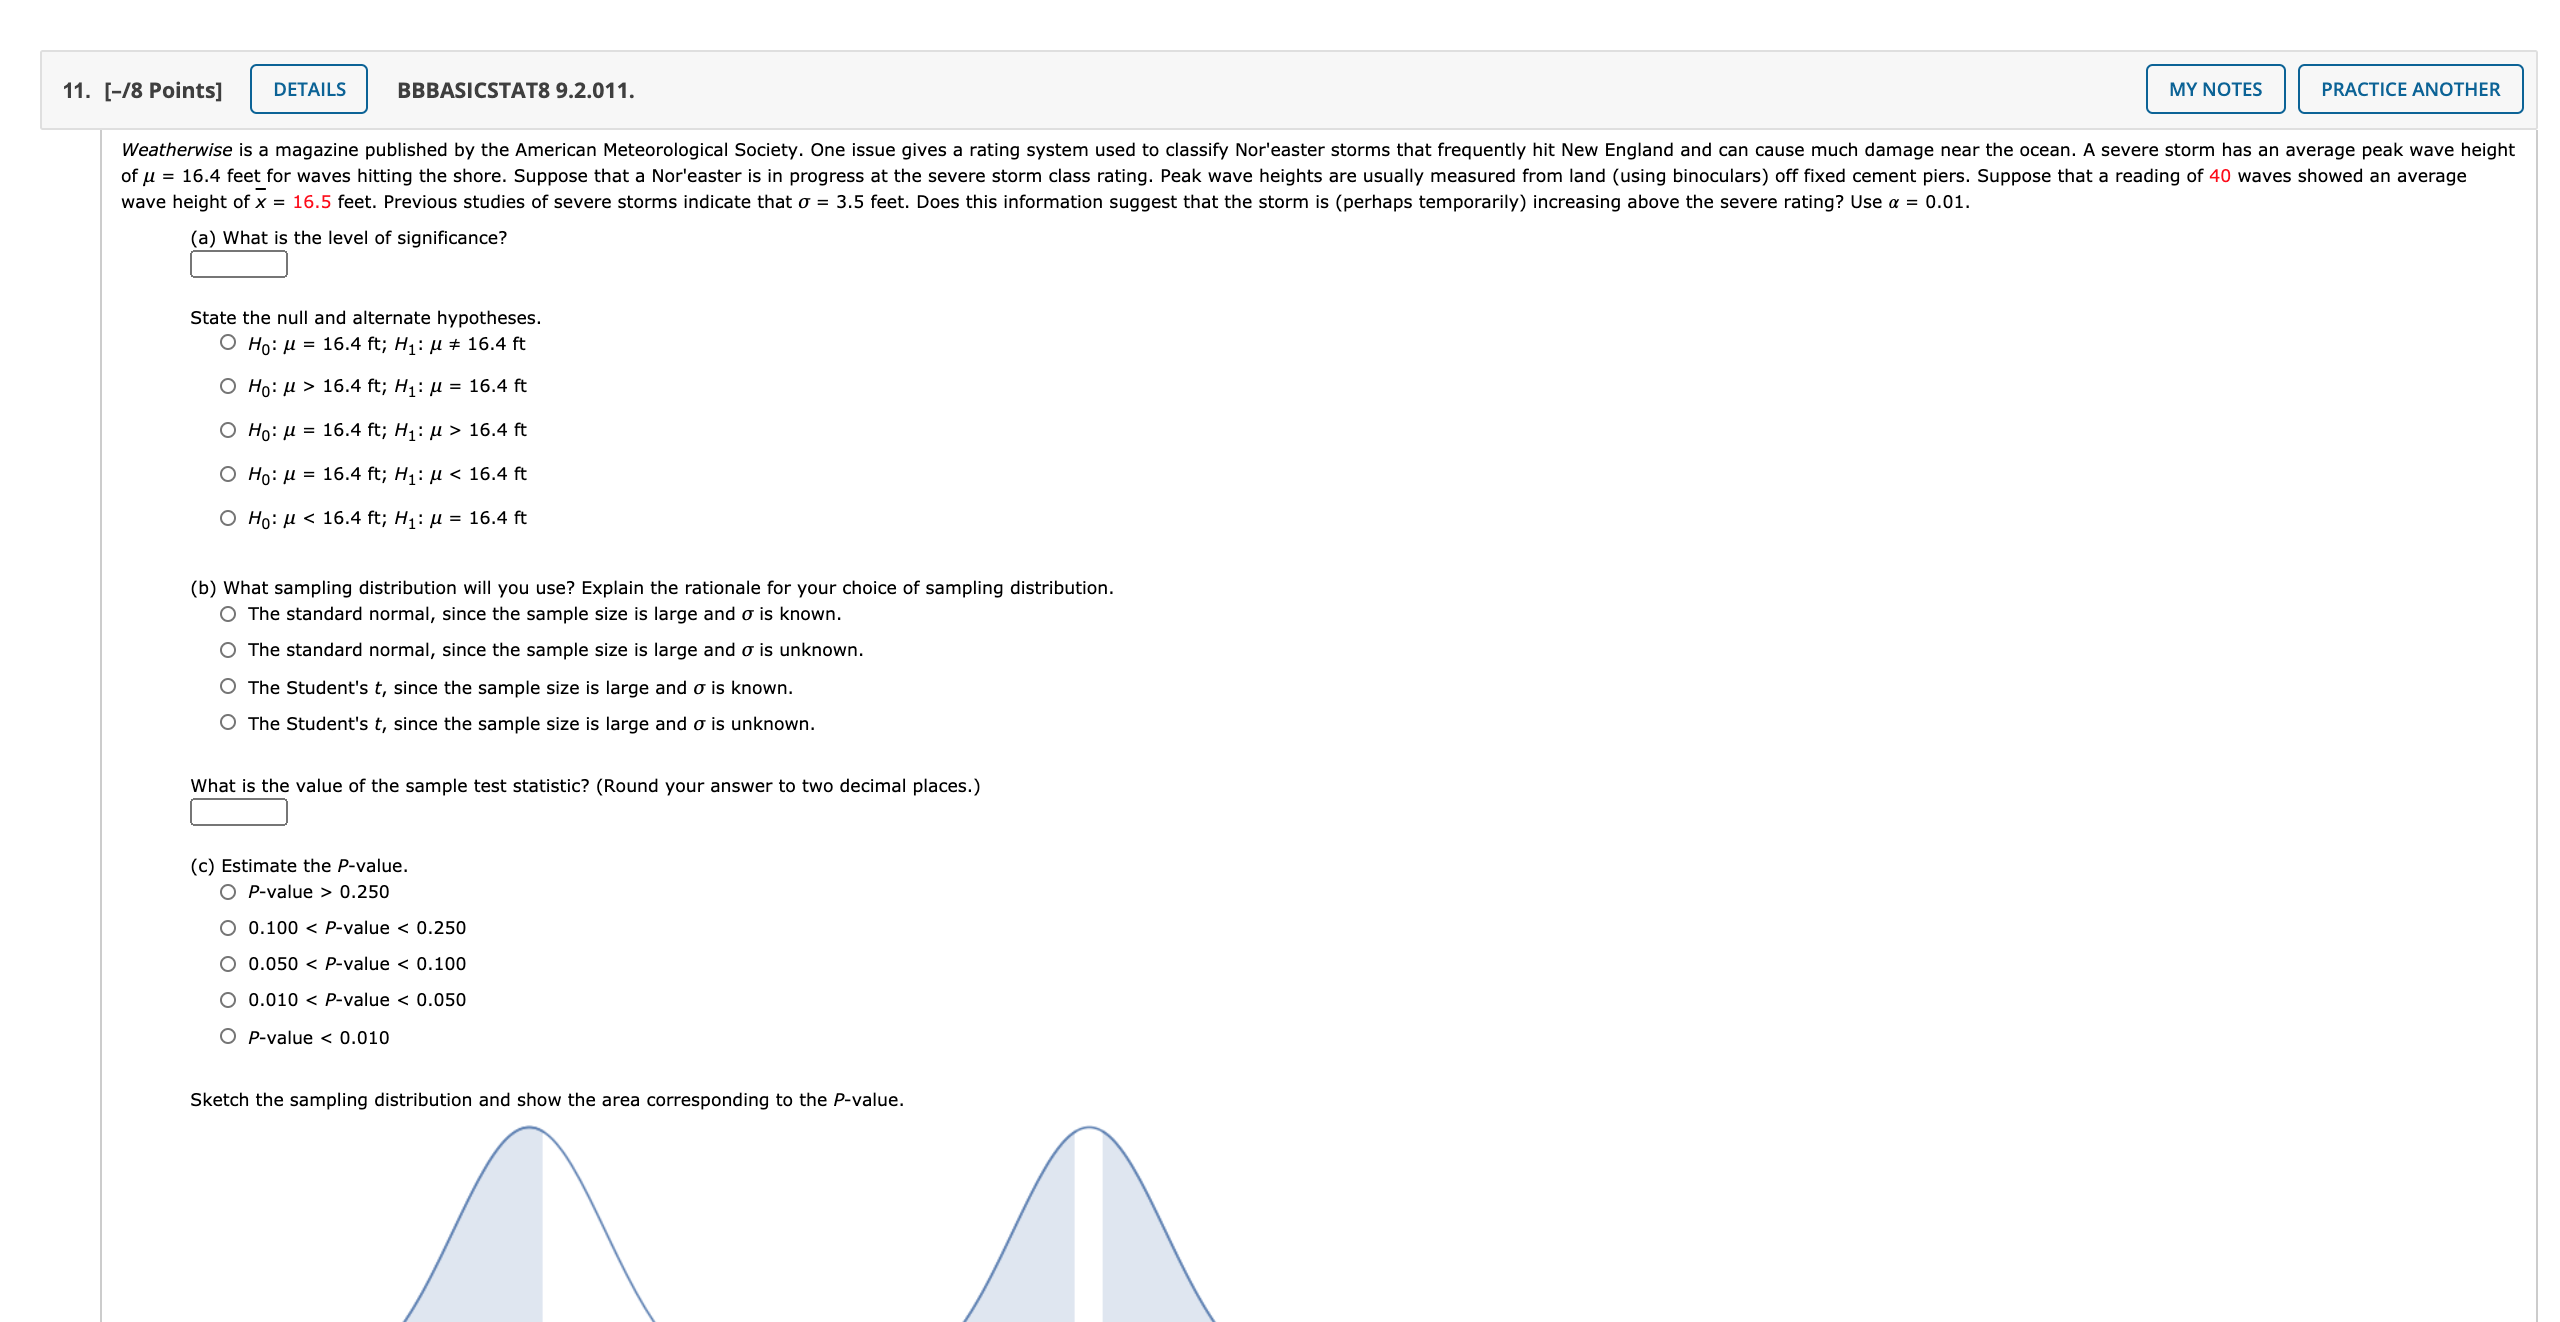
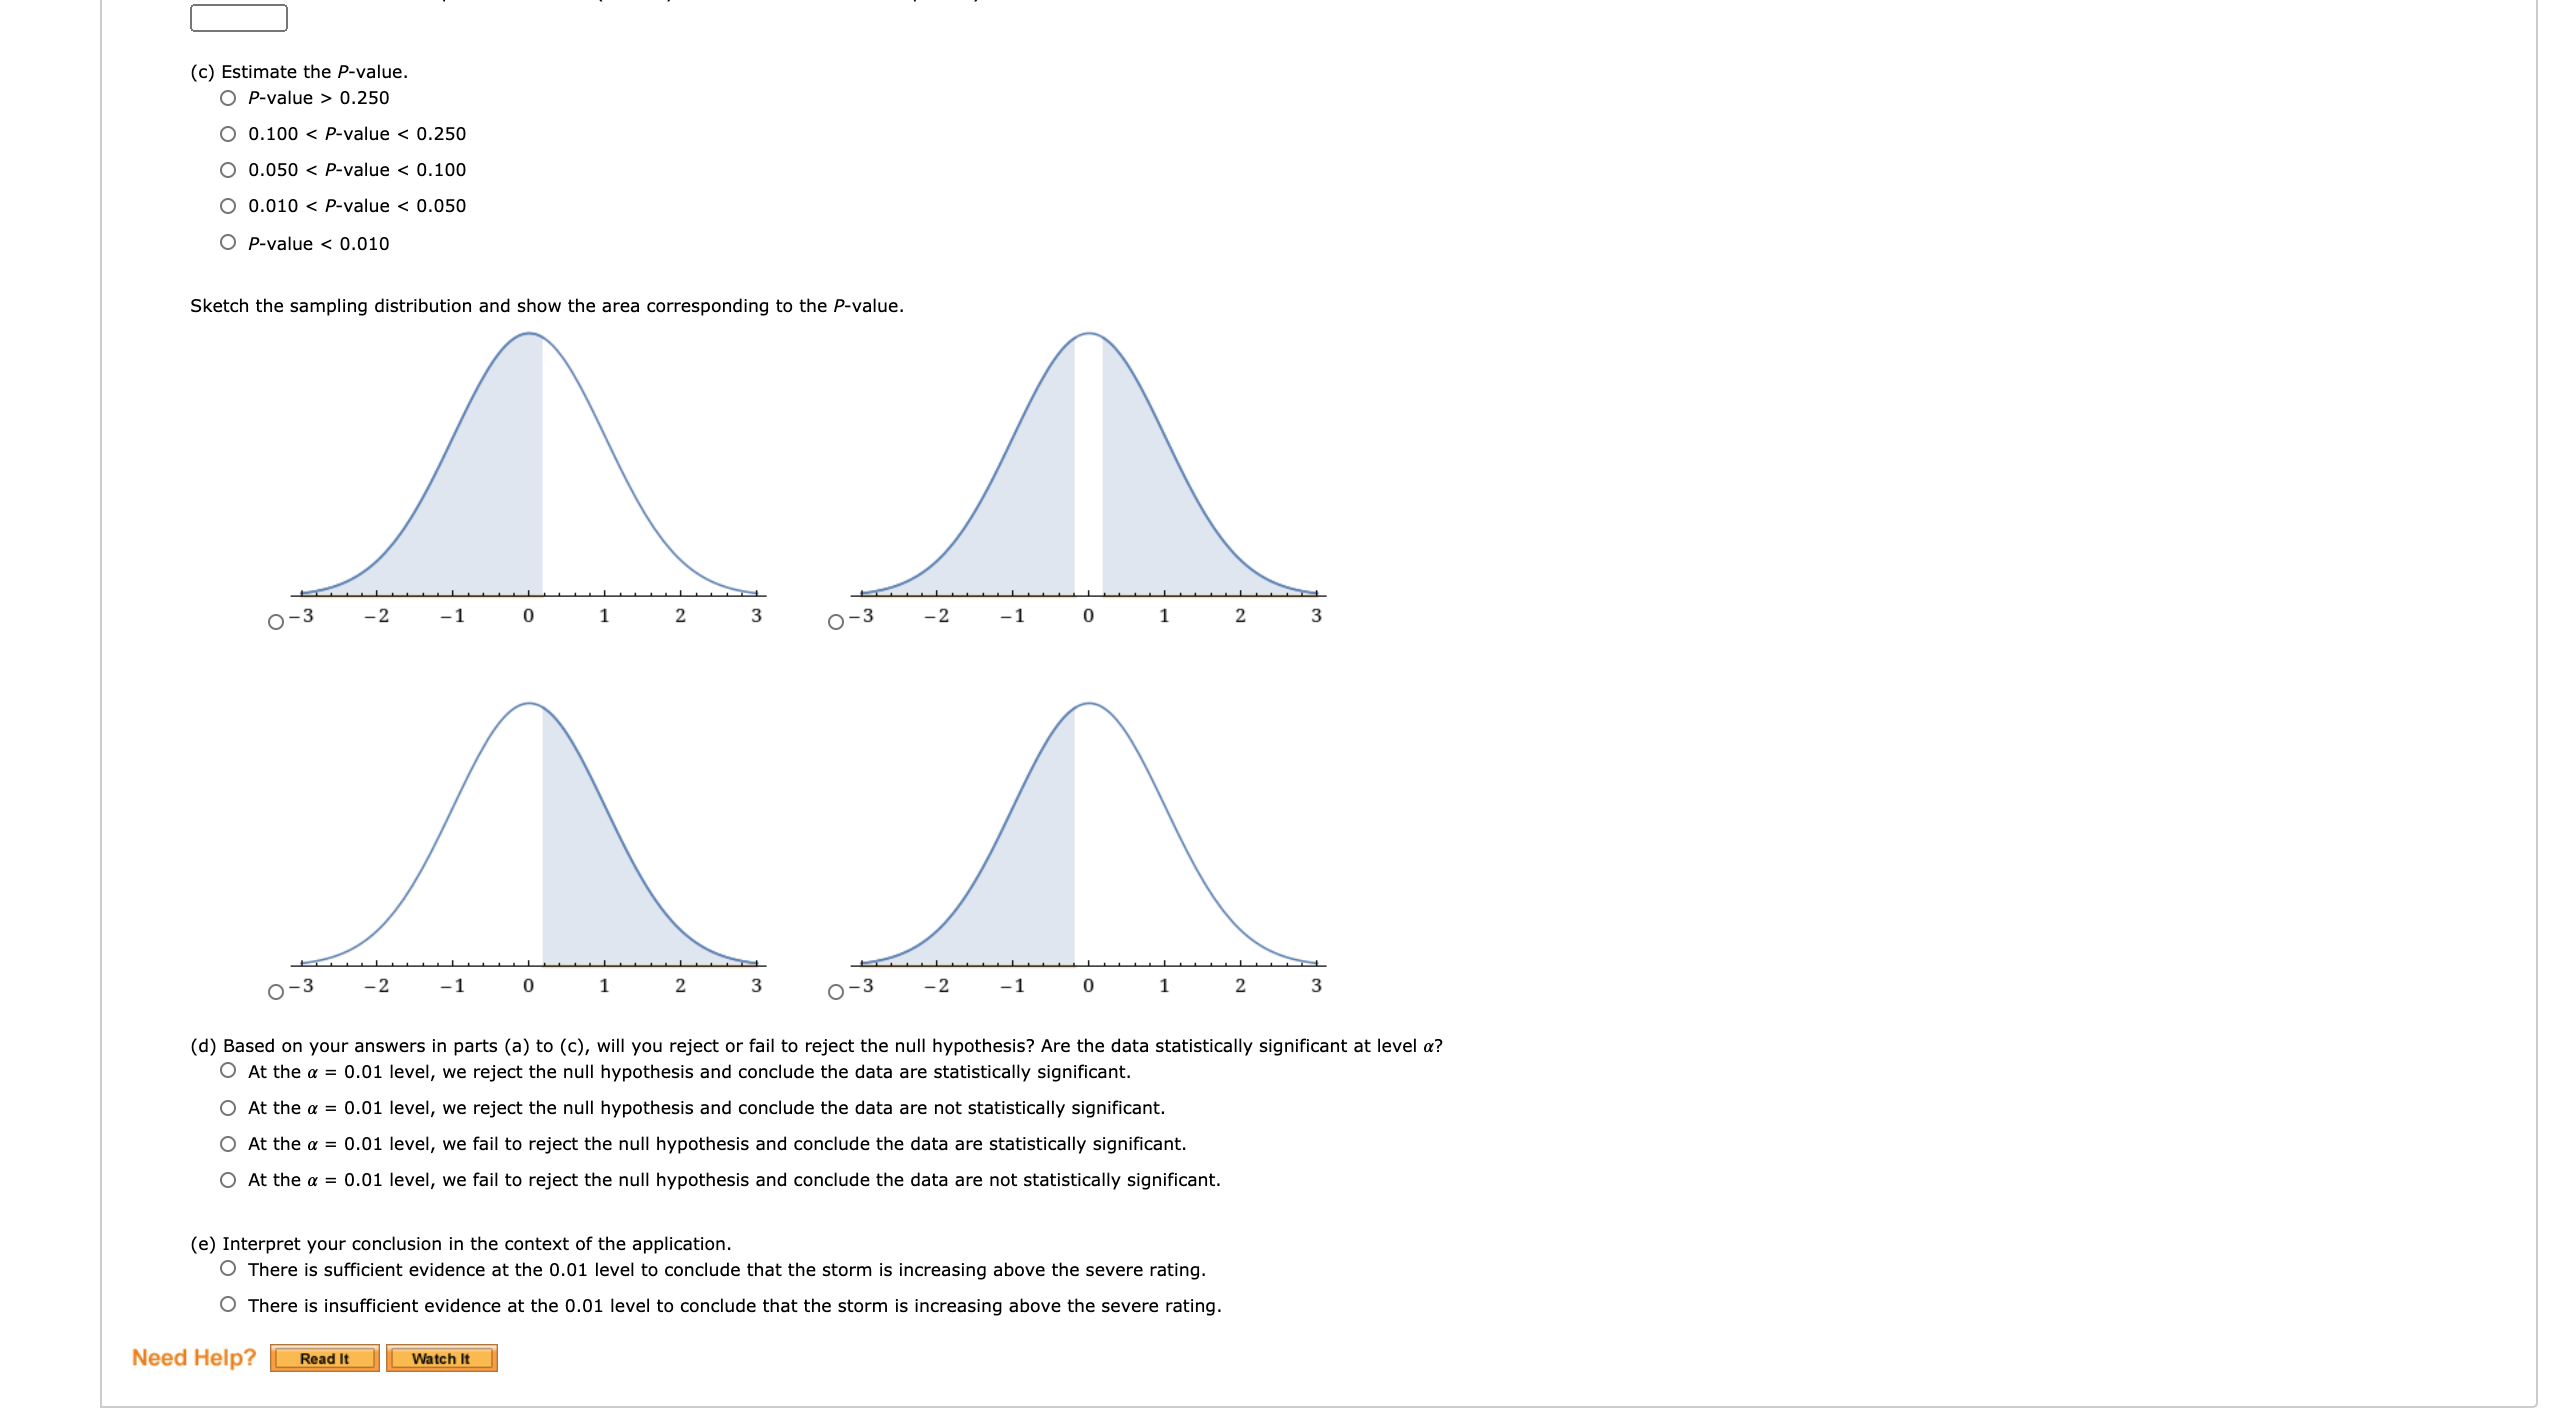
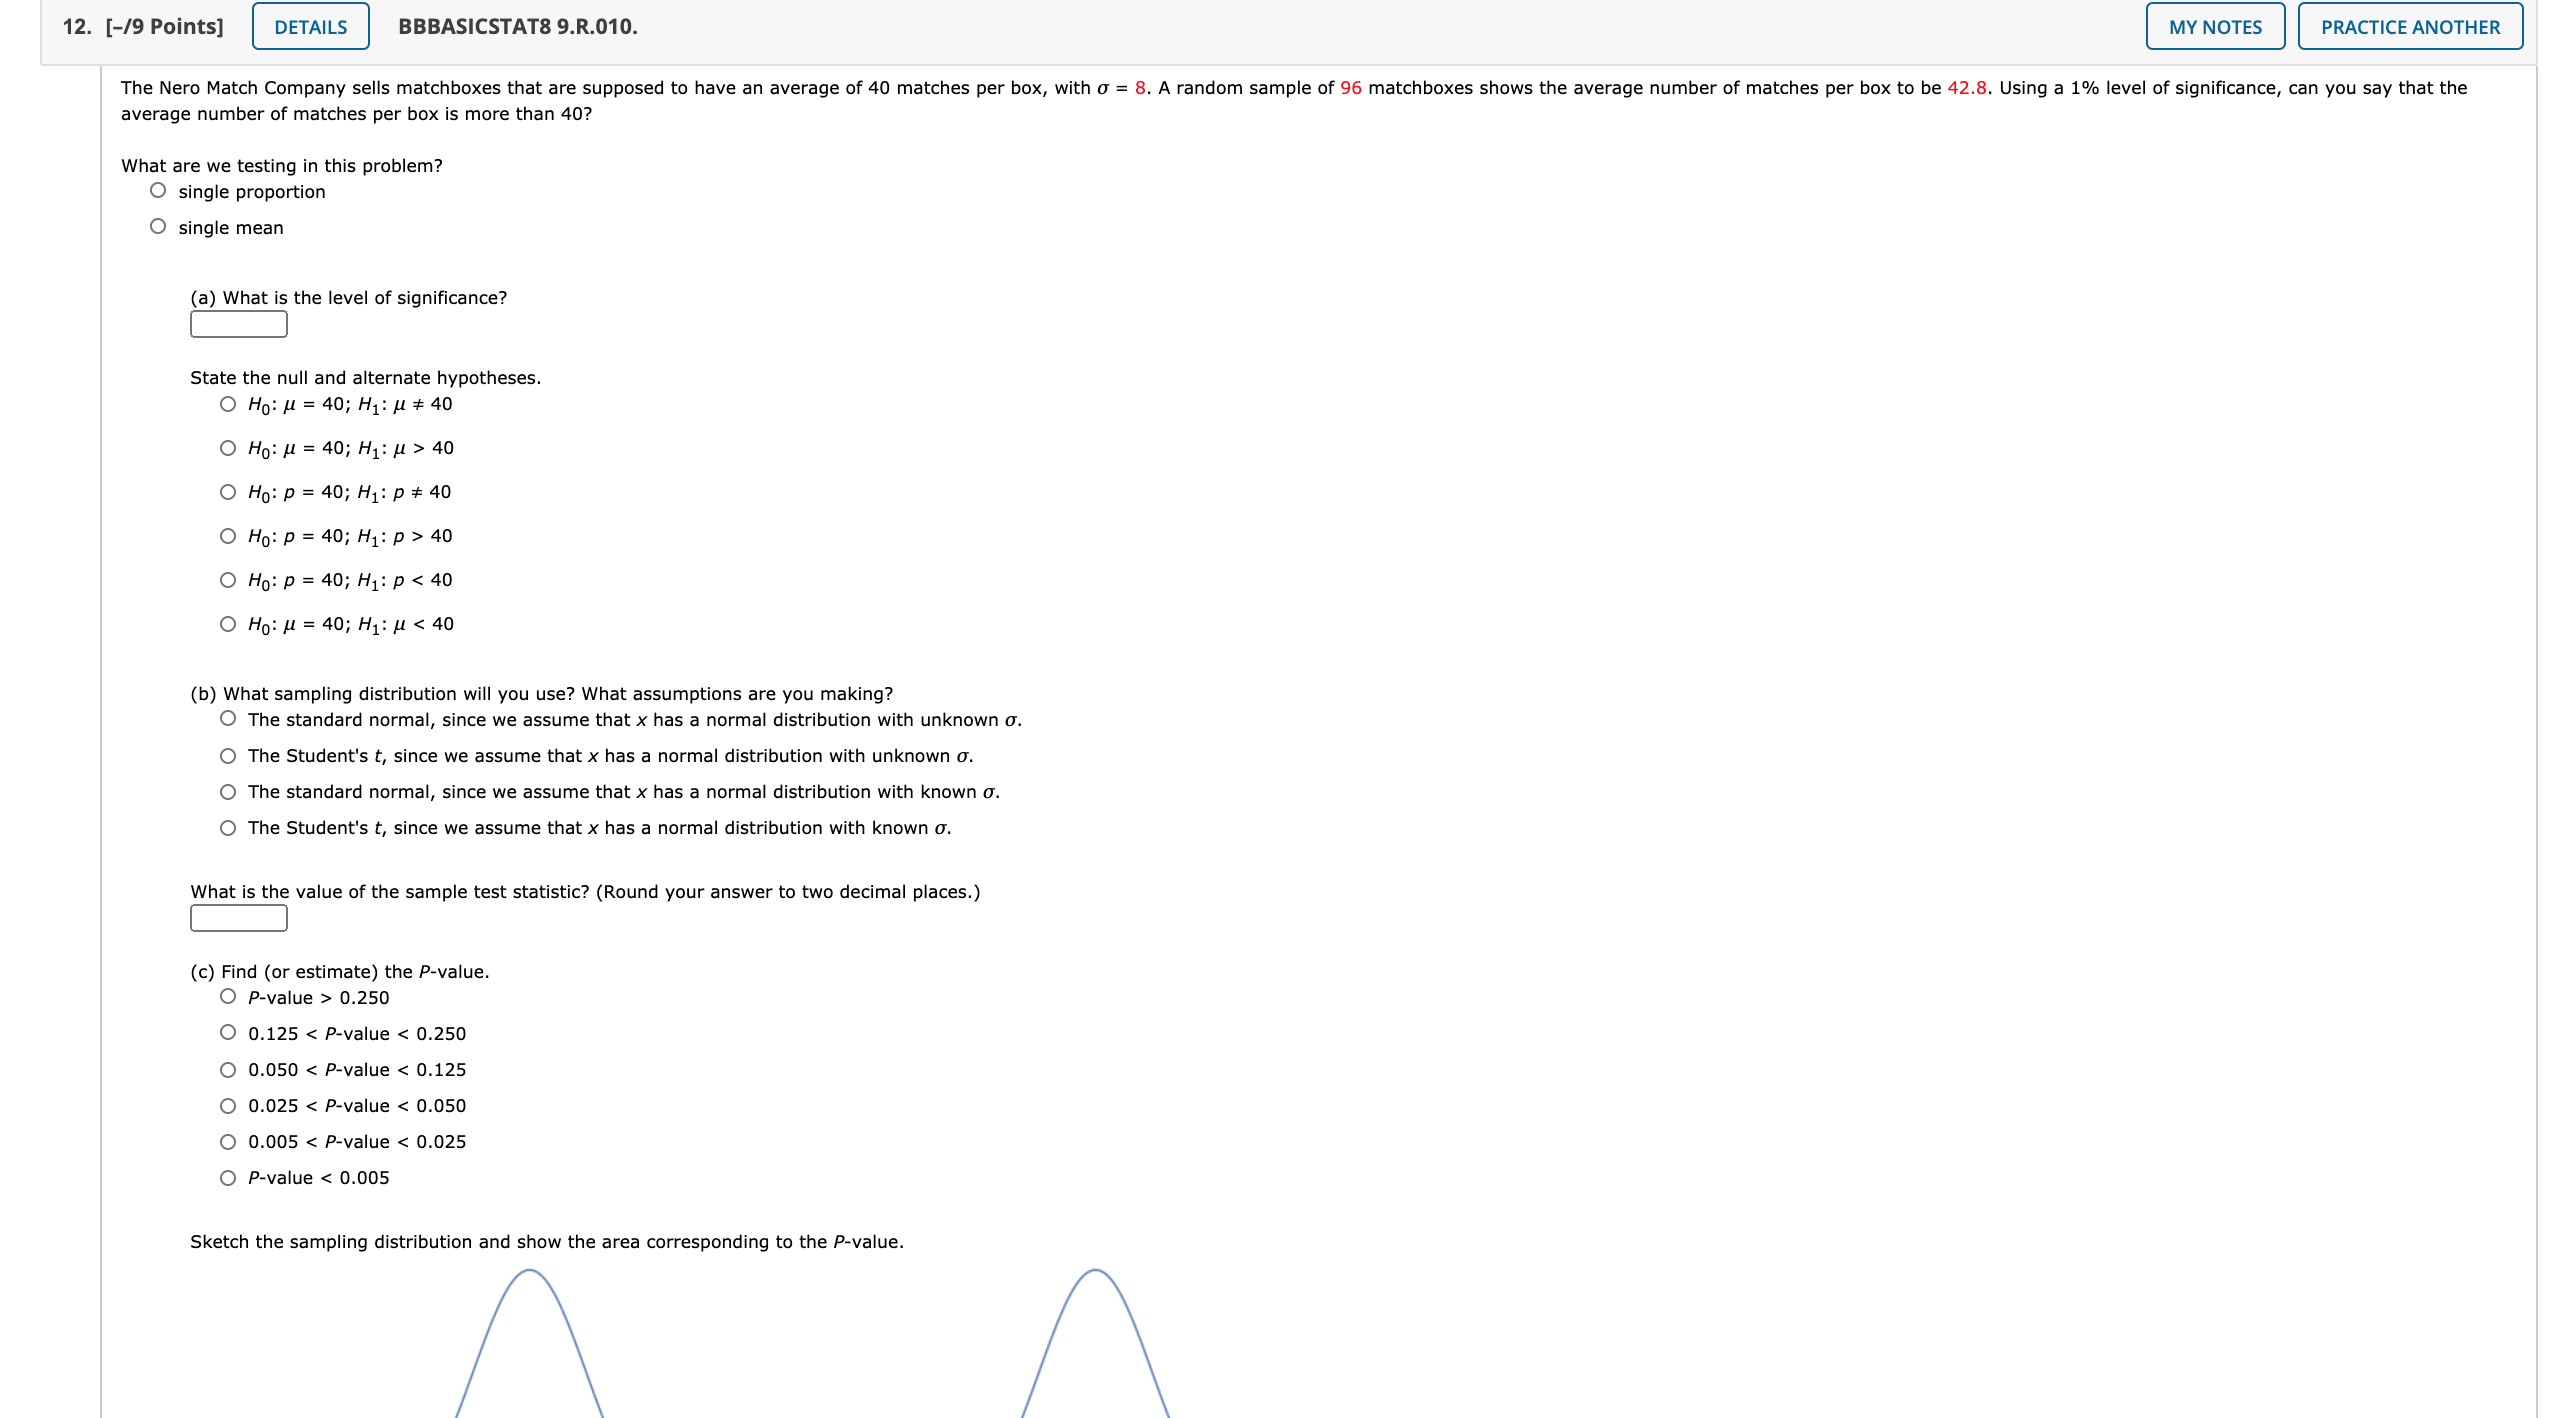
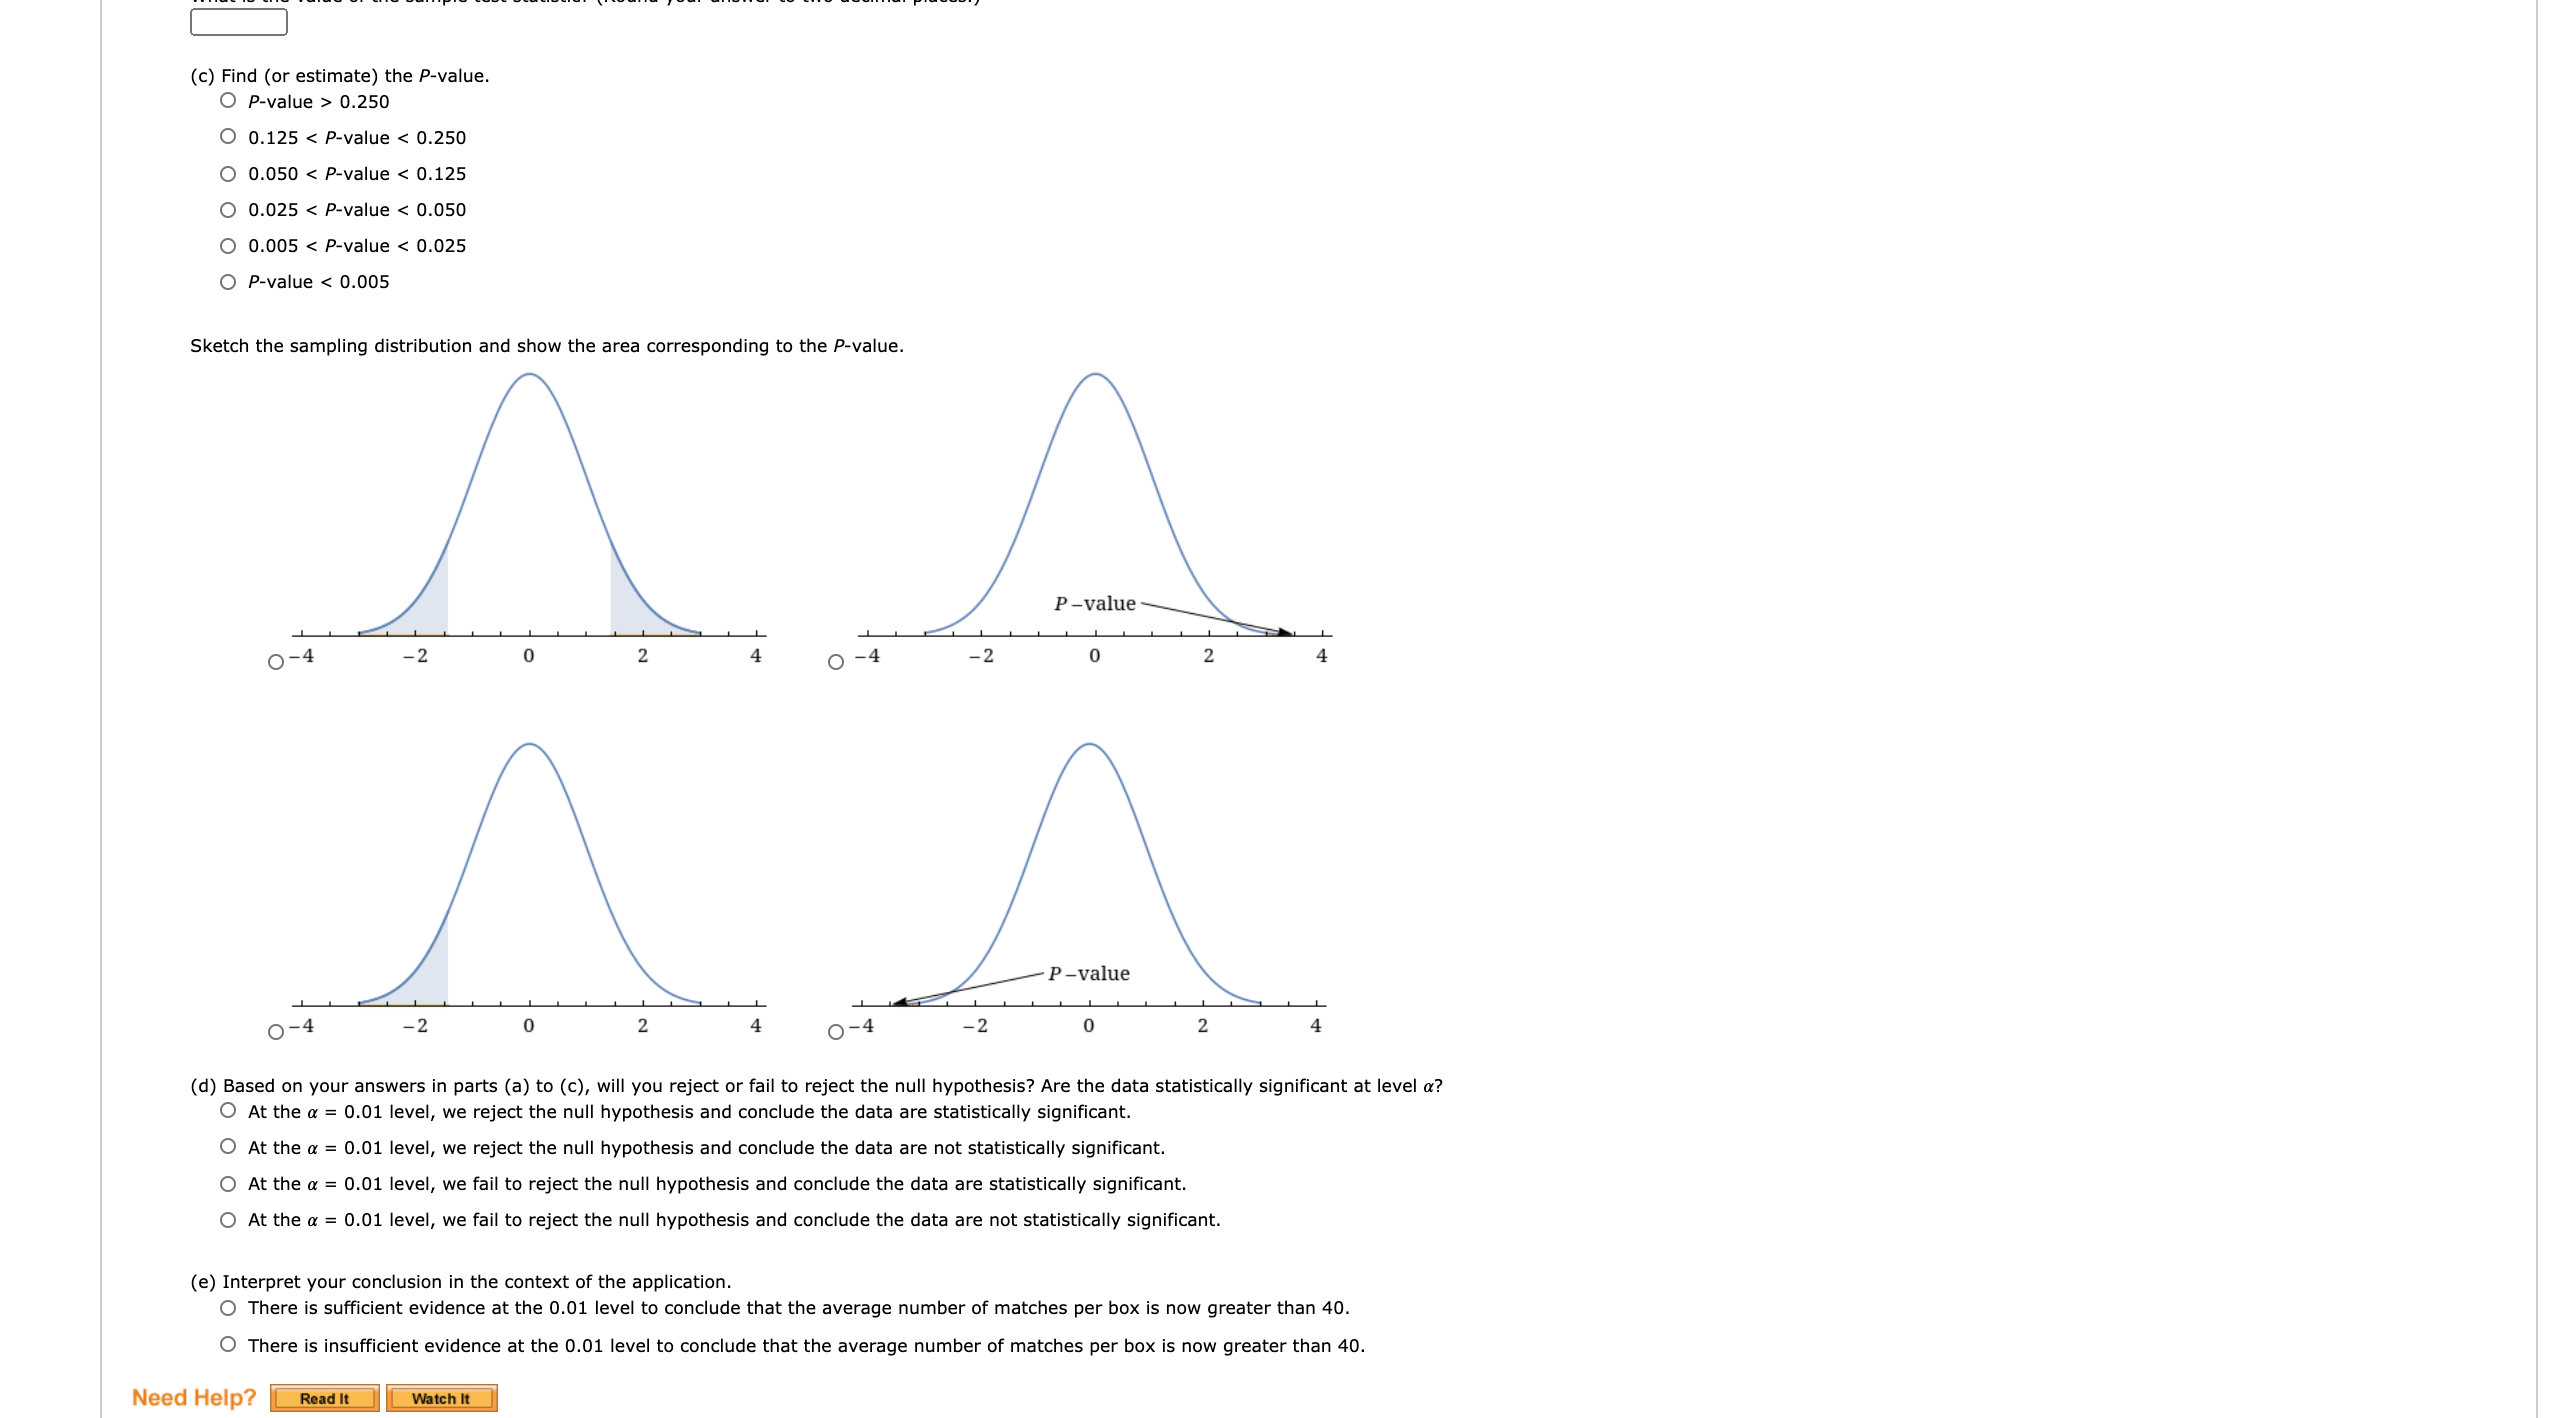
please help with 1- 12
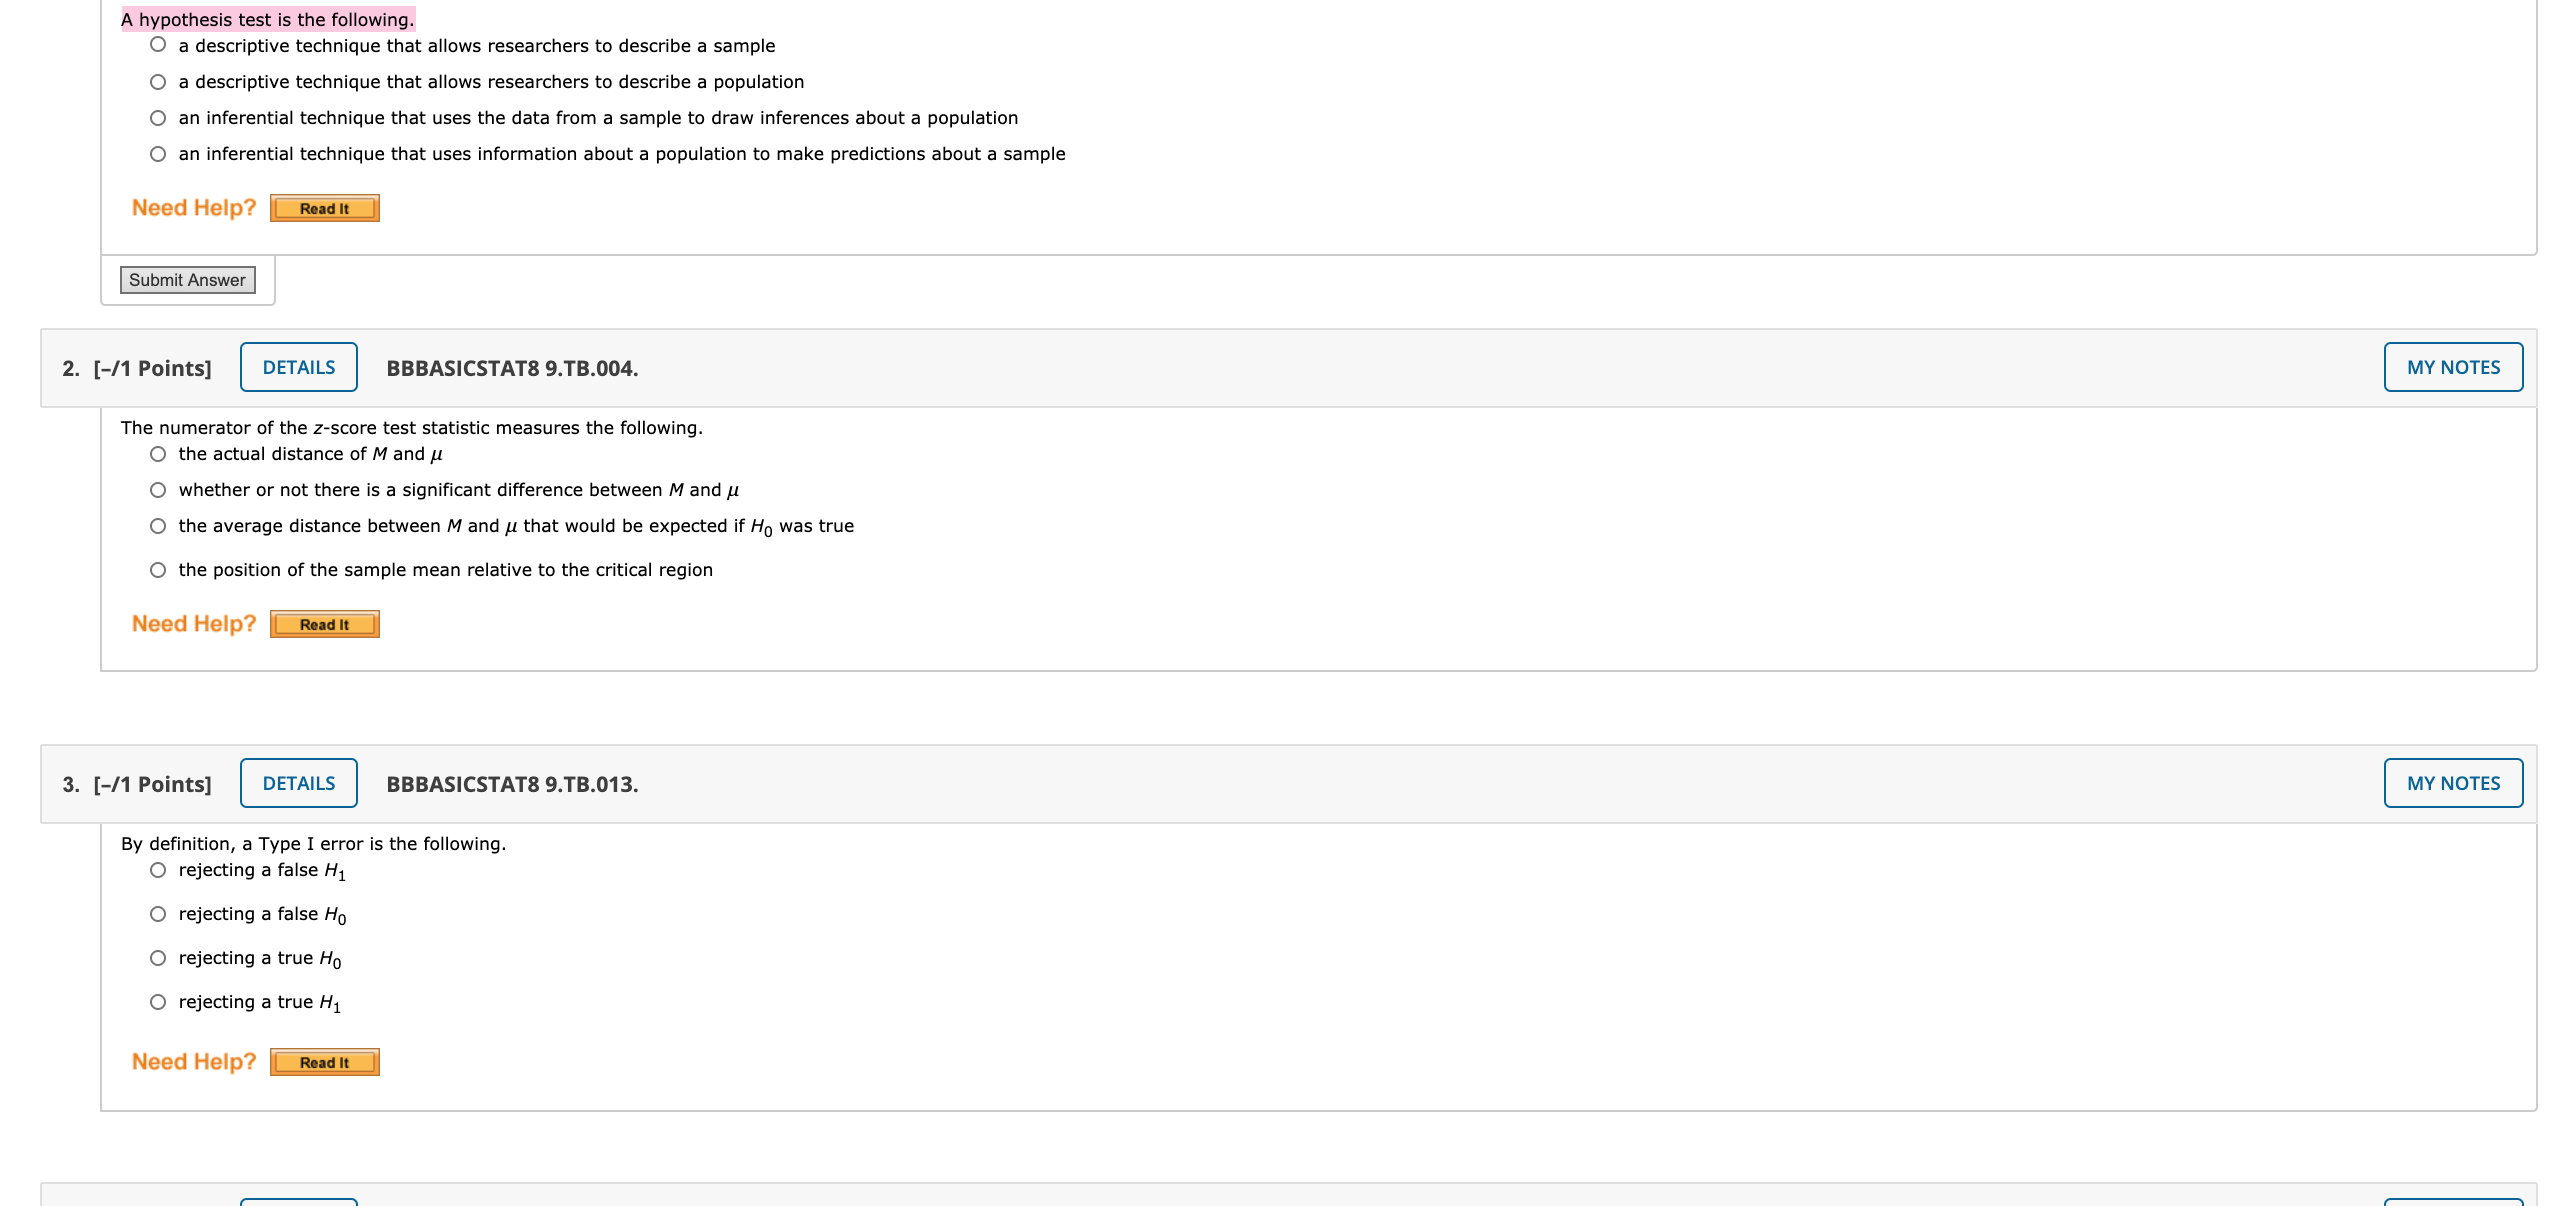
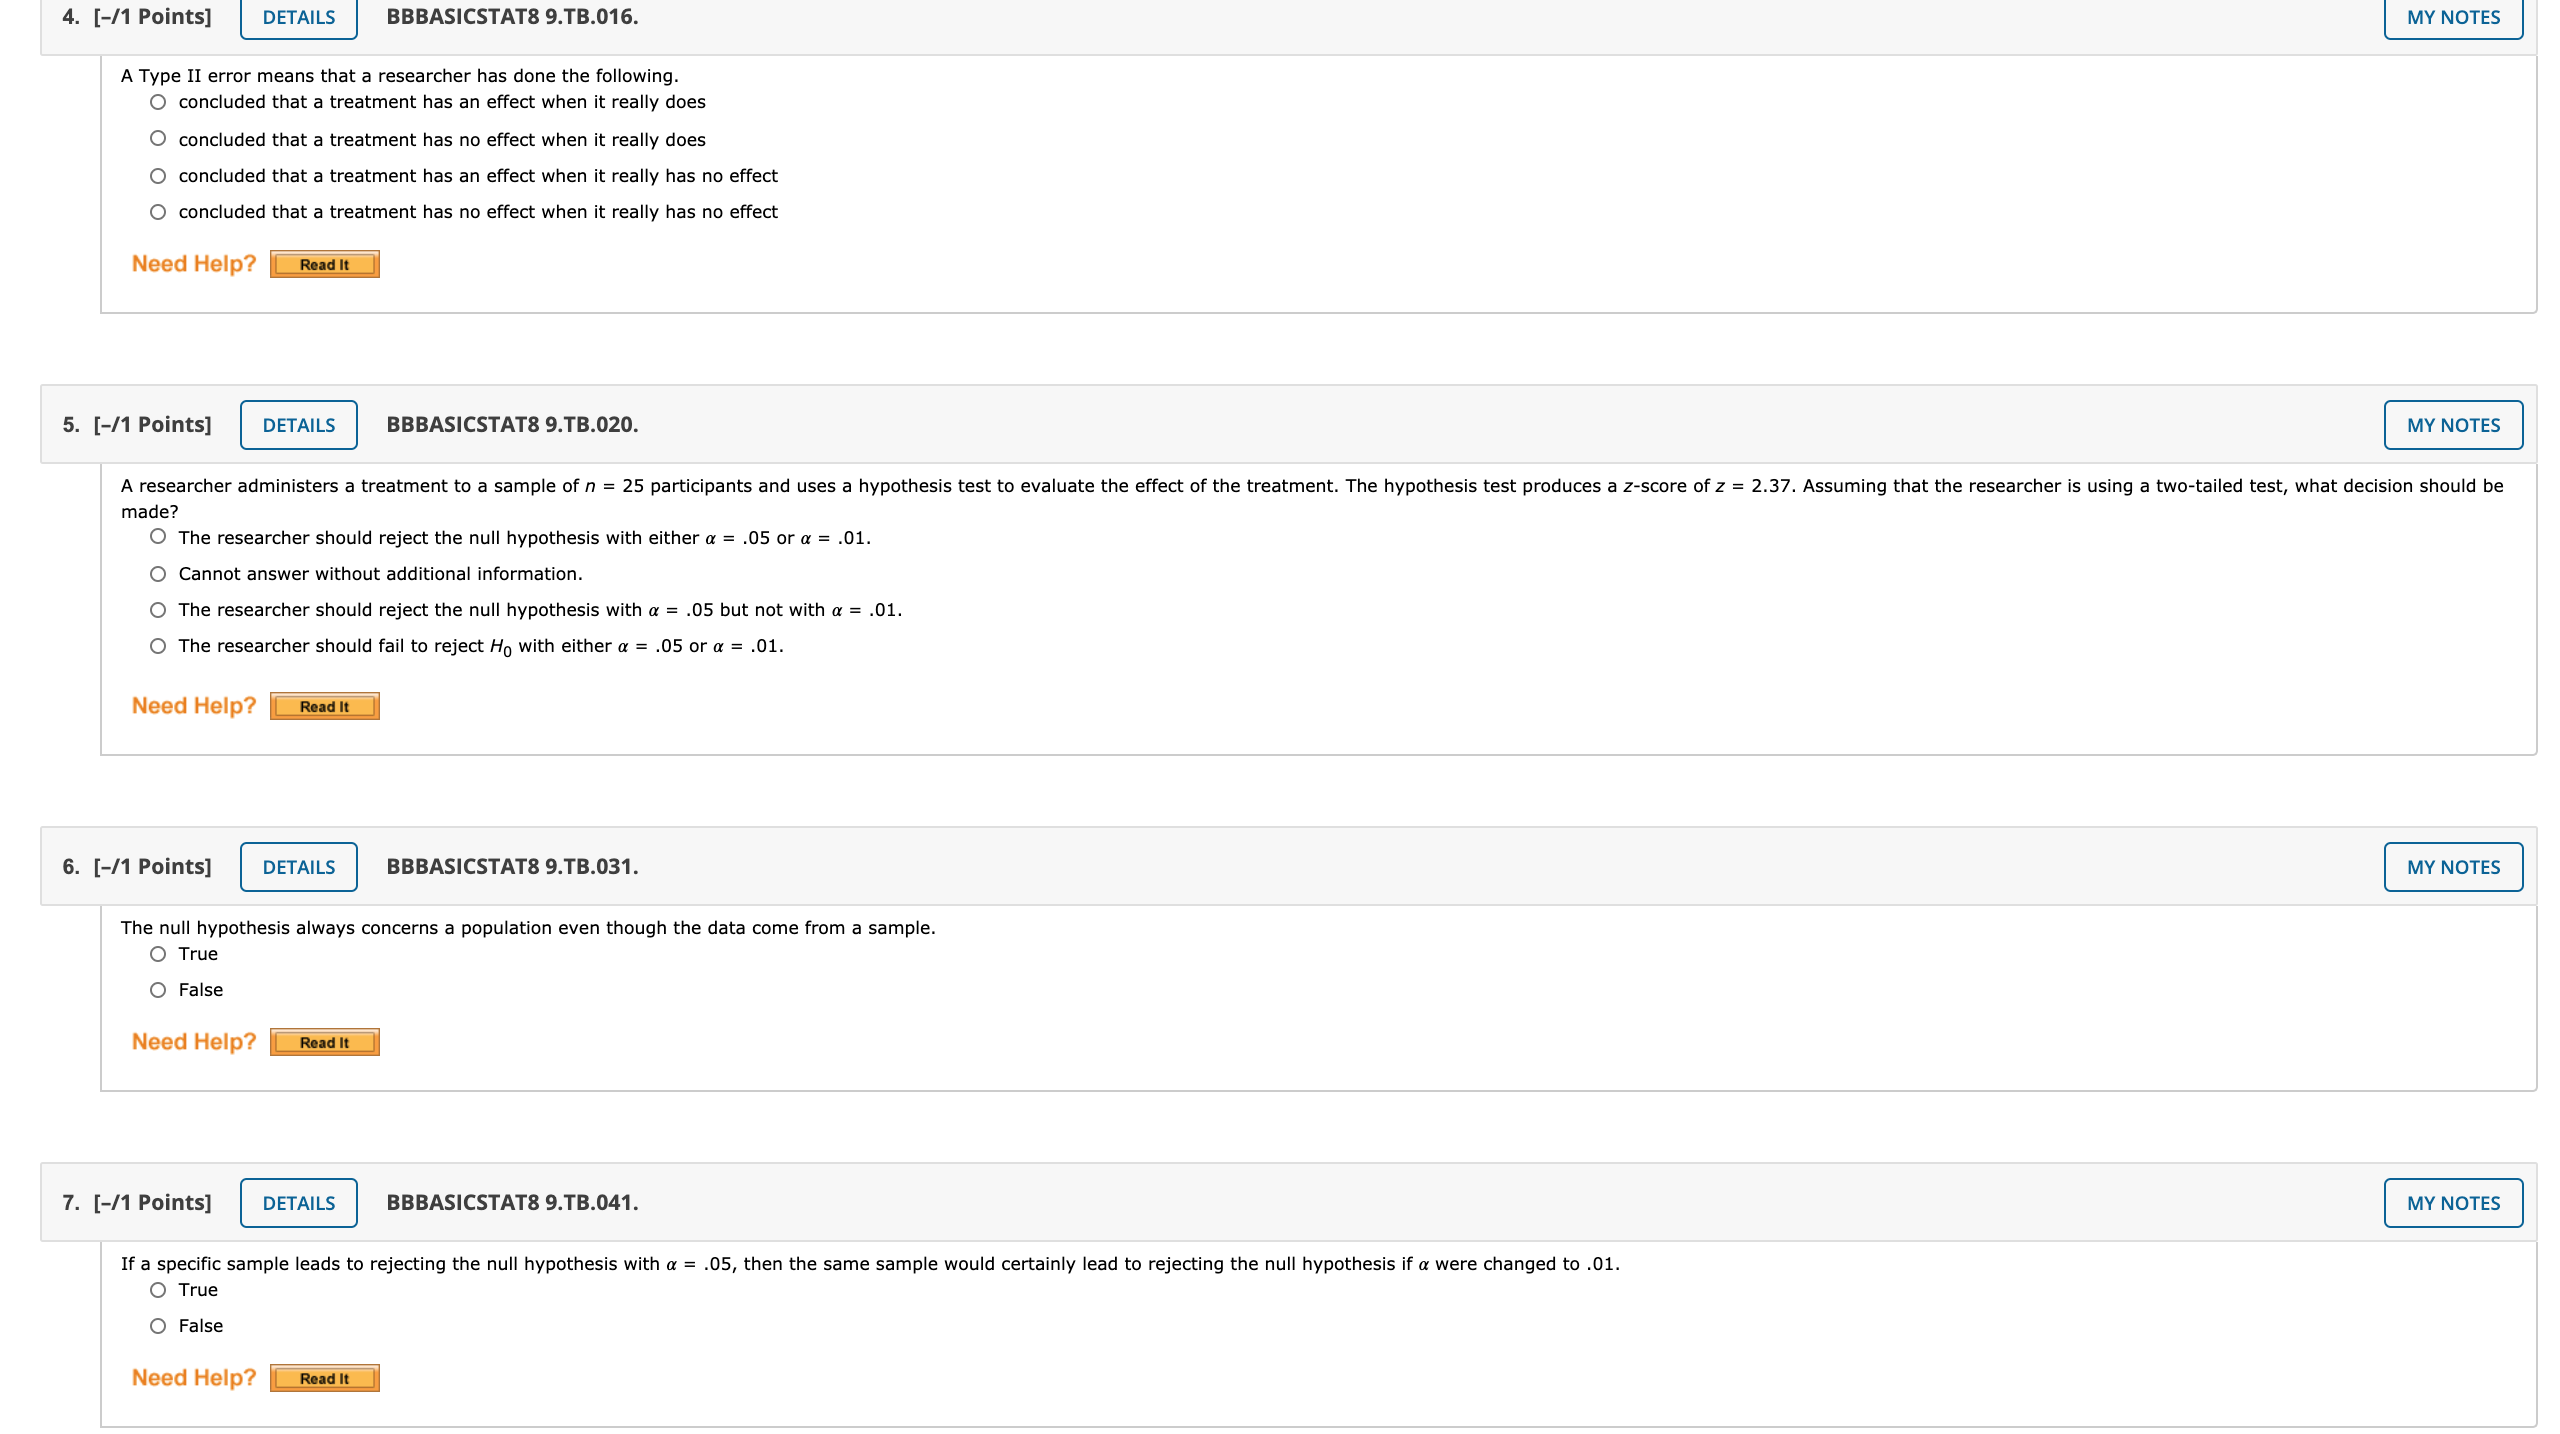
A hypothesis test is the following. a descriptive technique that allows researchers to describe a sample O a descriptive technique that allows researchers to describe a population O an inferential technique that uses the data from a sample to draw inferences about a population O an inferential technique that uses information about a population to make predictions about a sample Need Help? Read It Submit Answer 2. [-/1 Points] DETAILS BBBASICSTAT8 9.TB.004. MY NOTES The numerator of the z-score test statistic measures the following. O the actual distance of M and u O whether or not there is a significant difference between M and u O the average distance between M and u that would be expected if Ho was true O the position of the sample mean relative to the critical region Need Help? Read It 3. [-/1 Points] DETAILS BBBASICSTAT8 9.TB.013. MY NOTES By definition, a Type I error is the following. O rejecting a false H O rejecting a false Ho O rejecting a true Ho O rejecting a true H1 Need Help? Read It4. [-/1 Points] DETAILS BBBASICSTAT8 9. TB.016. MY NOTES A Type II error means that a researcher has done the following. O concluded that a treatment has an effect when it really does O concluded that a treatment has no effect when it really does O concluded that a treatment has an effect when it really has no effect O concluded that a treatment has no effect when it really has no effect Need Help? Read It 5. [-/1 Points] DETAILS BBBASICSTAT8 9.TB.020. MY NOTES A researcher administers a treatment to a sample of n = 25 participants and uses a hypothesis test to evaluate the effect of the treatment. The hypothesis test produces a z-score of z = 2.37. Assuming that the researcher is using a two-tailed test, what decision should be made? O The researcher should reject the null hypothesis with either a = .05 or a = .01. O Cannot answer without additional information. O The researcher should reject the null hypothesis with a = .05 but not with a = .01. The researcher should fail to reject Ho with either a = .05 or a = .01. Need Help? Read It 6. [-/1 Points] DETAILS BBBASICSTAT8 9.TB.031. MY NOTES The null hypothesis always concerns a population even though the data come from a sample. O True O False Need Help? Read It 7. [-/1 Points] DETAILS BBBASICSTAT8 9.TB.041. MY NOTES If a specific sample leads to rejecting the null hypothesis with a = .05, then the same sample would certainly lead to rejecting the null hypothesis if a were changed to .01. O True O False Need Help? Read It8. [-/1 Points] DETAILS BBBASICSTAT8 9.TB.051. MY NOTES There is always a possibility that the decision reached in a hypothesis test is incorrect. O True O False Need Help? Read It 9. [-/1 Points] DETAILS BBBASICSTAT8 9.TB.072. MY NOTES A sample of n = 25 individuals is selected from a population with / = 80 and a treatment is administered to the sample. If the treatment has no effect, then the sample mean should be one of the following. close to 80 and should lead you to fail to reject the null hypothesis O very different from 80 and should lead you to reject the null hypothesis O very different from 80 and should lead you to fail to reject the null hypothesis close to 80 and should lead you to reject the null hypothesis Need Help? Read It10. [-/8 Points] DETAILS BBBASICSTAT8 9.1.024. MY NOTES PRACTICE ANOTHER Total blood volume (in ml) per body weight (in kg) is important in medical research. For healthy adults, the red blood cell volume mean is about u = 28 ml/kg.+ Red blood cell volume that is too low or too high can indicate a medical problem. Suppose that Roger has had seven blood tests, and the red blood cell volumes were as follows. 31 25 43 33 31 39 28 Let x be a random variable that represents Roger's red blood cell volume. Assume that x has a normal distribution and o = 4.75. Do the data indicate that Roger's red blood cell volume is different (either way) from u = 28 ml/kg? Use a 0.01 level of significance. (a) What is the level of significance? State the null and alternate hypotheses. Will you use a left-tailed, right-tailed, or two-tailed test? O Ho: H = 28 ml/kg; H1: H 28 ml/kg; right-tailed O Ho: M = 28 ml/kg; H1: H # 28 ml/kg; two-tailed (b) What sampling distribution will you use? Explain the rationale for your choice of sampling distribution. The standard normal, since we assume that x has a normal distribution with unknown o. O The standard normal, since we assume that x has a normal distribution with known o. O The Student's t, since n is large with unknown o. The Student's t, since we assume that x has a normal distribution with known o. Compute the z value of the sample test statistic. (Round your answer to two decimal places.) c) Find (or estimate) the P-value. (Round your answer to four decimal places.) Sketch the sampling distribution and show the area corresponding to the P-value. P -value 0 -3 -2 -1 0 1 2 3 0-3 -2 -1 0 1 2 3Compute the z value of the sample test statistic. (Round your answer to two decimal places.) (c) Find (or estimate) the P-value. (Round your answer to four decimal places.) Sketch the sampling distribution and show the area corresponding to the P-value. P -value 0-3 -2 -1 0 1 2 0-3 -2 -1 1 2 P-value P-value 0-3 -2 -1 -3 -2 -1 0 2 (d) Based on your answers in parts (a) to (c), will you reject or fail to reject the null hypothesis? Are the data statistically significant at level a? At the a = 0.01 level, we reject the null hypothesis and conclude the data are statistically significant. O At the a = 0.01 level, we reject the null hypothesis and conclude the data are not statistically significant. O At the a = 0.01 level, we fail to reject the null hypothesis and conclude the data are statistically significant. O At the a = 0.01 level, we fail to reject the null hypothesis and conclude the data are not statistically significant. (e) State your conclusion in the context of the application. O There is sufficient evidence at the 0.01 level to conclude that Roger's average red cell volume differs from the average for healthy adults. O There is insufficient evidence at the 0.01 level to conclude that Roger's average red cell volume differs from the average for healthy adults. Need Help? Read It11. [-/8 Points] DETAILS BBBASICSTAT8 9.2.011. MY NOTES PRACTICE ANOTHER Weatherwise is a magazine published by the American Meteorological Society. One issue gives a rating system used to classify Nor'easter storms that frequently hit New England and can cause much damage near the ocean. A severe storm has an average peak wave height of u = 16.4 feet for waves hitting the shore. Suppose that a Nor'easter is in progress at the severe storm class rating. Peak wave heights are usually measured from land (using binoculars) off fixed cement piers. Suppose that a reading of 40 waves showed an average wave height of x = 16.5 feet. Previous studies of severe storms indicate that o = 3.5 feet. Does this information suggest that the storm is (perhaps temporarily) increasing above the severe rating? Use a = 0.01. (a) What is the level of significance? State the null and alternate hypotheses. O Ho: M = 16.4 ft; H1: H # 16.4 ft O Ho: M > 16.4 ft; H1: H = 16.4 ft O Ho: M = 16.4 ft; H1: M > 16.4 ft O Ho: M = 16.4 ft; H1: u 0.250 O 0.100 0.250 O 0.100 40 O Ho: P = 40; H1: p # 40 O Ho: P = 40; H1: p > 40 O Ho: P = 40; H1: p 0.250 0.125 0.250 O 0.125
