Please help with answering the following questions based on the completed budget below.
Issues and Problem Areas:
Summarize the key weaknesses in the proposed budget, given the established pricing, inventory, receivable, payable, dividend and cash management policies.
Strategies:
Propose at least 3 changes to current policies that will address the weaknesses which you have identified.
Describe your reasoning for the suggestions you are making. For example, if you suggest raising the sales price in the off-season, why do you think it would make sense to the customer to pay more in January for a chair less likely to be used in the winter.
Prepare at least 1 set of alternative budgets reflecting the outcomes of the strategies you are suggesting.
You must comment on the impact of your suggestions on cost structure, profitability and cash flows.
You must assess the risks associated with your strategies and recognize the influence one set of suggestions will have on other parts of the budget. For example, what affect
will increasing the sales price have on sales volume? Would the impact be the same throughout the year? How would you increase the volume?
Try to incorporate some of the concepts we have covered so far in the class, such as contribution margin and break-even.
You should explain any strategies that you considered and rejected because they did not significantly improve the situation.
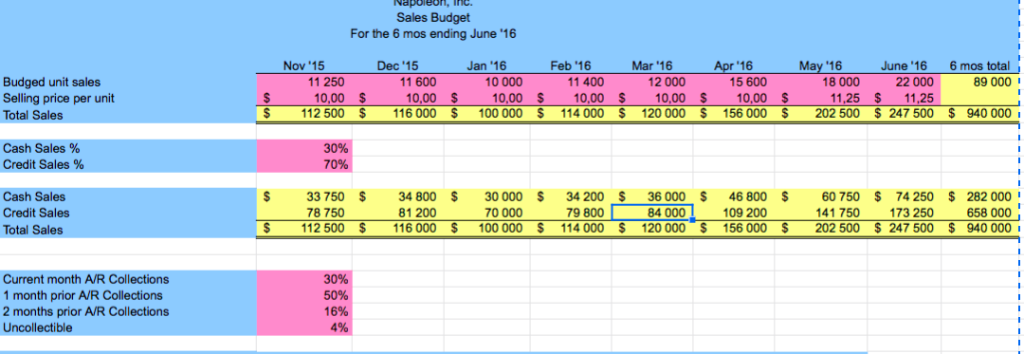
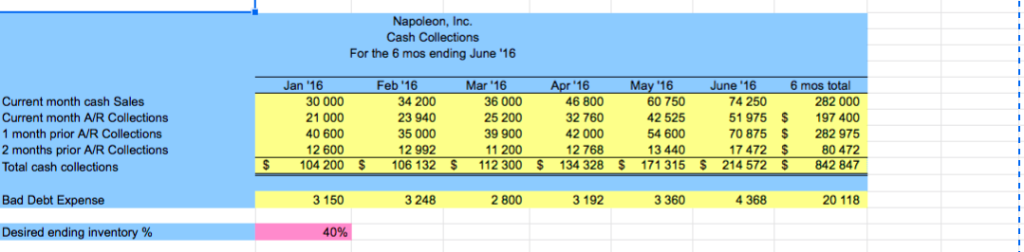
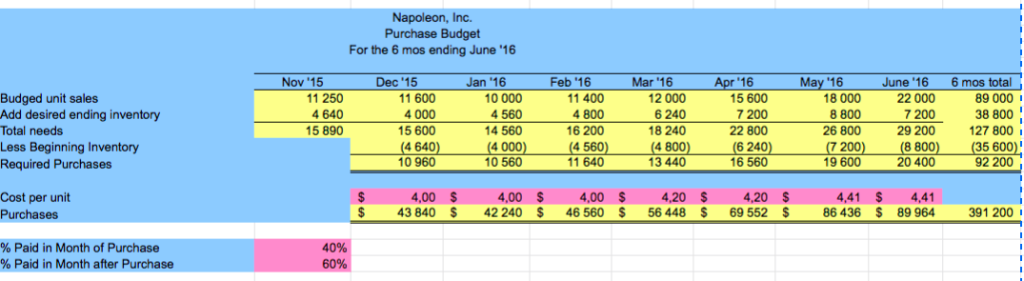
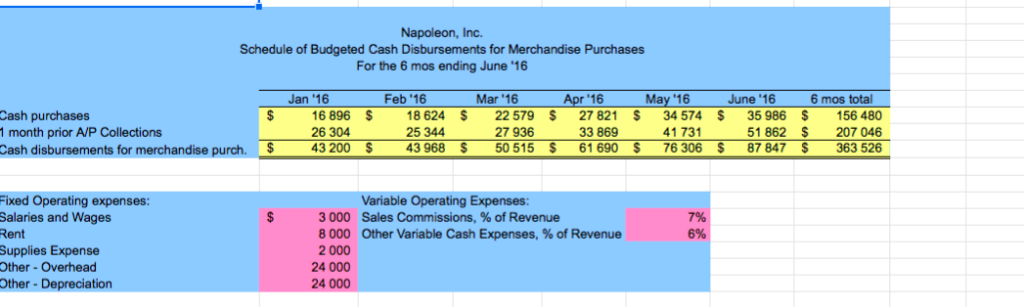
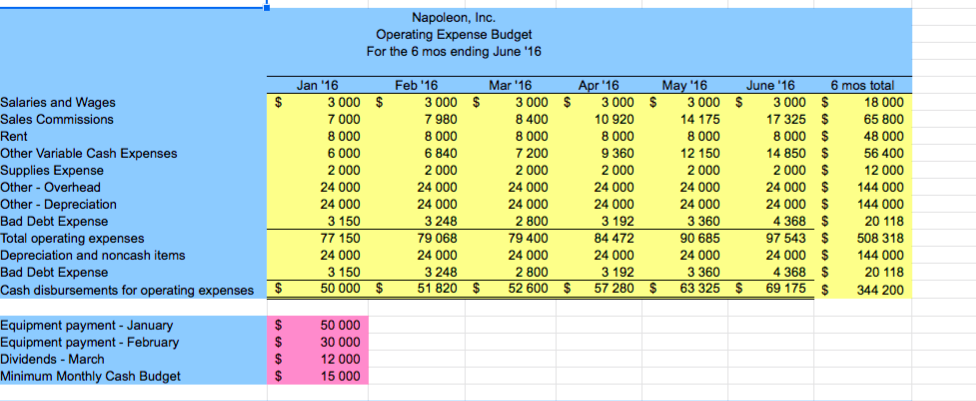
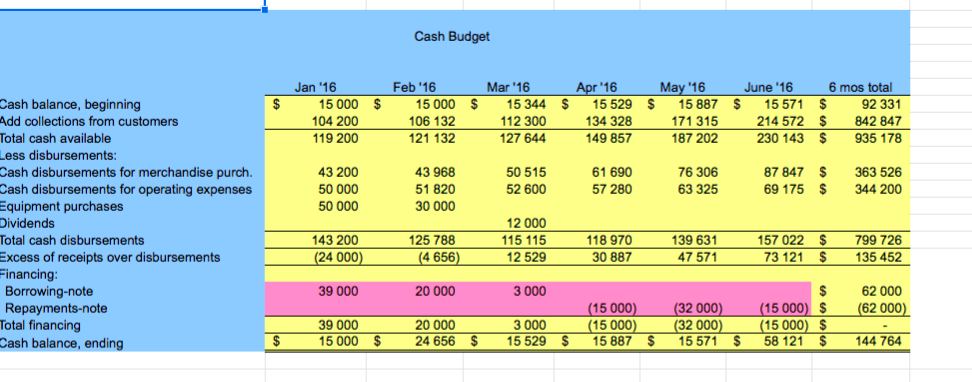
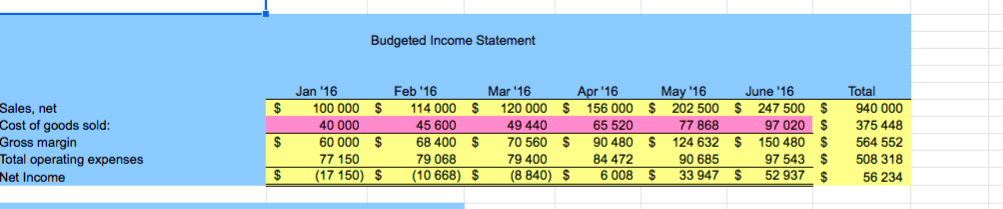
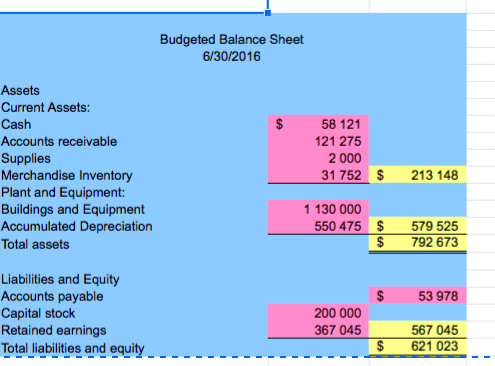
Napoleon, Inc. Sales Budget For the 6 mos ending June '16 Budged unit sales Selling price per unit Total Sales Nov '15 11 250 10.00 112 500 Dec '15 11 600 10,00 116 000 Jan 16 10 000 10,00 100 000 Feb '16 11 400 10,00 114 000 Mar '16 12 000 10,00 120 000 Apr '16 15 600 10,00 156 000 May '16 18 000 11,25 202 500 June '16 6mos total 22 000 89 000 $ 11,25 $ 247 500 $ 940 000 $ $ $ $ 112 500 $ $ $ $ $ $ $ $ S Cash Sales % Credit Sales % 30% 70% 33 750 $ $ $ $ $ $ Cash Sales Credit Sales Total Sales 34 800 81 200 116 000 30 000 70 000 100 000 34 200 79 800 114 000 36 000 84 000 120 000 46 800 109 200 156 000 60 750 $ 74 250 1 41 750 173 250 202 500 $ 247 500 $ 282 000 658 000 $ 940 000 112 500 $ $ $ $ $ $ Current month A/R Collections 1 month prior A/R Collections 2 months prior A/R Collections Uncollectible 30% 50% 16% 4% Napoleon, Inc. Cash Collections For the 6 mos ending June '16 Current month cash Sales Current month A/R Collections 1 month prior A/R Collections 2 months prior A/R Collections Total cash collections Jan 16 30 000 21 000 40 600 12 600 104 2005 Feb '16 34 200 23 940 35 000 12 992 106 132 Mar '16 36 000 25 200 39 900 11 200 112 300 Apr '16 46 800 32 760 42 000 12 768 134 328 May '16 60 750 42 525 54 600 13 440 $ 171 315 June 16 6 mos total 74 250 282 000 51 975 $ 197 400 70 875 $ 282 975 17 472 $ 80 472 $ 214 572 $ 842 847 $ $ $ Bad Debt Expense 3 150 3 248 2 800 31923 360 4368 20 118 Desired ending inventory % 40% Napoleon, Inc. Purchase Budget For the 6 mos ending June '16 Budged unit sales Add desired ending inventory Total needs Less Beginning Inventory Required Purchases Nov '15 11 250 4 640 15 890 Dec '15 11 600 4 000 15 600 (4 640 10 960 Jan '16 10 000 4560 14 560 (4000) 10 560 Feb '16 11 400 4 800 16 200 (4560) 11 640 Mar '16 12 000 6 240 18 240 (4 800) 13 440 Apr '16 15 600 7 200 22 800 (6 240) 16 560 May '16 18 000 8 800 26 800 (7 200) 19 600 June '16 22 000 7200 29 200 (8 800) 20 400 6 mos total 89 0001 38 800 127 800 (35 600) 92 200 Cost per unit Purchases $ $ 4,00 43 840 $ $ 4,00 42 240 $ $ 4,00 46 560 $ $ 4,20 $ 56 448 $ 4,20 $ 69 552 $ 4,41 $ 4,41 86 436 $ 89 964 391 2001 % Paid in Month of Purchase % Paid in Month after Purchase 40% 60% Napoleon, Inc. Schedule of Budgeted Cash Disbursements for Merchandise Purchases For the 6 mos ending June 16 $ Cash purchases 1 month prior A/P Collections wash disbursements for merchandise purch. Jan '16 16 896 $ 26 304 43 200 $ Feb '16 18 624 $ 2 5 344 43 968 $ Mar '16 Apr '16 May '16 22 579 $ 27 821 $ 34 574 27 936 33 869 41 731 50 515 $ 61 690 76 306 June '16 6mos total 35 986 $ 156 480 5 1 862 $ 207 046 87 847 269 698 $ Fixed Operating expenses: Salaries and Wages Rent Supplies Expense Other - Overhead Other - Depreciation Variable Operating Expenses: 3 000 Sales Commissions, % of Revenue 8 000 Other Variable Cash Expenses, % of Revenue 2 000 24 000 24 000 Napoleon, Inc. Operating Expense Budget For the 6 mos ending June '16 $ $ Salaries and Wages Sales Commissions Rent Other Variable Cash Expenses Supplies Expense Other - Overhead Other - Depreciation Bad Debt Expense Total operating expenses Depreciation and noncash items Bad Debt Expense Cash disbursements for operating expenses Jan '16 3 000 7 000 8 000 6 000 2 000 24 000 24 000 3 150 77 150 24 000 3 150 50 000 Feb '16 3 000 7 980 8 000 6 840 2000 24 000 24 000 3248 79 068 24 000 3 248 51 820 Mar '16 3 000 $ 8 400 8 000 7 200 2 000 24 000 24 000 2 800 79 400 24 000 2 800 52 600 $ Apr '16 3 000 10 920 8 000 9 360 2000 24 000 24 000 3192 84 472 24 000 3192 57 280 May '16 $ 3 000 14 175 8 000 12 150 2000 24 000 24 000 3360 90 685 24 000 3360 S 63 325 June '16 6 mos total $ 3 000 $ 18 000 17 325 $ 65 800 8 000 $ 48 000 14 850 $ 56 400 2 000 $ 12 000 24 000 $ 144 000 24 000 $ 144 000 4 368 $ 20 118 97 543 $ 508 318 24 000 $ 144 000 4 368 $ 20 118 $ 69 175 $ 344 200 $ $ $ Equipment payment - January Equipment payment - February Dividends - March Minimum Monthly Cash Budget 50 000 30 000 12 000 15 000 $ Cash Budget $ $ $ Jan '16 15 000 104 200 119 200 Feb '16 15 000 106 132 121 132 Mar '16 15 344 112 300 127 644 Apr '16 15 529 134 328 149 857 May '16 June '16 6 mos total $ 15 887 $ 15 571 $ 92 331 1 71 315 214 572 $ 842 847 187 202 230 143 $ 935 178 43 200 50 000 50 000 43 968 51 820 30 000 50 515 52 600 61 690 57 280 76 306 63 325 87 847 69 175 $ $ 363 526 344 200 Cash balance, beginning Add collections from customers Total cash available Less disbursements: Cash disbursements for merchandise purch. Cash disbursements for operating expenses Equipment purchases Dividends Total cash disbursements Excess of receipts over disbursements Financing Borrowing-note Repayments-note Total financing Cash balance, ending 143 200 (24 000) 125 788 (4 656) 12 000 115 115 12 529 118 970 30 887 139 631 47 571 157 022 $ 73 121 $ 799 726 135 452 39 000 20 000 3 000 62 000 (62 000) 39 000 15 000 20 000 24 656 3 000 15529 (15000) (15000) 15 887 (32 000) (32 000) 15571 (15000) $ (15000) $ 58 121 5 $ $ $ $ $ $ 144 764 Budgeted Income Statement $ Sales, net Cost of goods sold: Gross margin Total operating expenses Net Income Jan '16 100 000 $ 40 000 60 000 $ 77 150 (17 150) $ Feb '16 Mar '16 114 000 $ 120 000 $ 45 600 49 440 68 400 $ 70 560 $ 79 068 79 400 (10 668) $ (8 840) $ Apr '16 156 000 65 520 90 480 8 4 472 6008 May '16 June '16 $ 202 500 $ 247 500 $ 7 7 868 97 020 $ $ 124 632 $ 150 480 $ 90 685 97 543 $ $ 33 947 $ 52 937 S Total 940 000 375 448 564 552 508 318 56 234 Budgeted Balance Sheet 6/30/2016 $ Assets Current Assets: Cash Accounts receivable Supplies Merchandise Inventory Plant and Equipment: Buildings and Equipment Accumulated Depreciation Total assets 58 121 121 275 2 000 31 752 $ 213 148 1 130 000 550 475 $ $ 579 525 792 673 $ 53 978 Liabilities and Equity Accounts payable Capital stock Retained earnings Total liabilities and equity 200 000 367 045 567 045 621 023 $ Napoleon, Inc. Sales Budget For the 6 mos ending June '16 Budged unit sales Selling price per unit Total Sales Nov '15 11 250 10.00 112 500 Dec '15 11 600 10,00 116 000 Jan 16 10 000 10,00 100 000 Feb '16 11 400 10,00 114 000 Mar '16 12 000 10,00 120 000 Apr '16 15 600 10,00 156 000 May '16 18 000 11,25 202 500 June '16 6mos total 22 000 89 000 $ 11,25 $ 247 500 $ 940 000 $ $ $ $ 112 500 $ $ $ $ $ $ $ $ S Cash Sales % Credit Sales % 30% 70% 33 750 $ $ $ $ $ $ Cash Sales Credit Sales Total Sales 34 800 81 200 116 000 30 000 70 000 100 000 34 200 79 800 114 000 36 000 84 000 120 000 46 800 109 200 156 000 60 750 $ 74 250 1 41 750 173 250 202 500 $ 247 500 $ 282 000 658 000 $ 940 000 112 500 $ $ $ $ $ $ Current month A/R Collections 1 month prior A/R Collections 2 months prior A/R Collections Uncollectible 30% 50% 16% 4% Napoleon, Inc. Cash Collections For the 6 mos ending June '16 Current month cash Sales Current month A/R Collections 1 month prior A/R Collections 2 months prior A/R Collections Total cash collections Jan 16 30 000 21 000 40 600 12 600 104 2005 Feb '16 34 200 23 940 35 000 12 992 106 132 Mar '16 36 000 25 200 39 900 11 200 112 300 Apr '16 46 800 32 760 42 000 12 768 134 328 May '16 60 750 42 525 54 600 13 440 $ 171 315 June 16 6 mos total 74 250 282 000 51 975 $ 197 400 70 875 $ 282 975 17 472 $ 80 472 $ 214 572 $ 842 847 $ $ $ Bad Debt Expense 3 150 3 248 2 800 31923 360 4368 20 118 Desired ending inventory % 40% Napoleon, Inc. Purchase Budget For the 6 mos ending June '16 Budged unit sales Add desired ending inventory Total needs Less Beginning Inventory Required Purchases Nov '15 11 250 4 640 15 890 Dec '15 11 600 4 000 15 600 (4 640 10 960 Jan '16 10 000 4560 14 560 (4000) 10 560 Feb '16 11 400 4 800 16 200 (4560) 11 640 Mar '16 12 000 6 240 18 240 (4 800) 13 440 Apr '16 15 600 7 200 22 800 (6 240) 16 560 May '16 18 000 8 800 26 800 (7 200) 19 600 June '16 22 000 7200 29 200 (8 800) 20 400 6 mos total 89 0001 38 800 127 800 (35 600) 92 200 Cost per unit Purchases $ $ 4,00 43 840 $ $ 4,00 42 240 $ $ 4,00 46 560 $ $ 4,20 $ 56 448 $ 4,20 $ 69 552 $ 4,41 $ 4,41 86 436 $ 89 964 391 2001 % Paid in Month of Purchase % Paid in Month after Purchase 40% 60% Napoleon, Inc. Schedule of Budgeted Cash Disbursements for Merchandise Purchases For the 6 mos ending June 16 $ Cash purchases 1 month prior A/P Collections wash disbursements for merchandise purch. Jan '16 16 896 $ 26 304 43 200 $ Feb '16 18 624 $ 2 5 344 43 968 $ Mar '16 Apr '16 May '16 22 579 $ 27 821 $ 34 574 27 936 33 869 41 731 50 515 $ 61 690 76 306 June '16 6mos total 35 986 $ 156 480 5 1 862 $ 207 046 87 847 269 698 $ Fixed Operating expenses: Salaries and Wages Rent Supplies Expense Other - Overhead Other - Depreciation Variable Operating Expenses: 3 000 Sales Commissions, % of Revenue 8 000 Other Variable Cash Expenses, % of Revenue 2 000 24 000 24 000 Napoleon, Inc. Operating Expense Budget For the 6 mos ending June '16 $ $ Salaries and Wages Sales Commissions Rent Other Variable Cash Expenses Supplies Expense Other - Overhead Other - Depreciation Bad Debt Expense Total operating expenses Depreciation and noncash items Bad Debt Expense Cash disbursements for operating expenses Jan '16 3 000 7 000 8 000 6 000 2 000 24 000 24 000 3 150 77 150 24 000 3 150 50 000 Feb '16 3 000 7 980 8 000 6 840 2000 24 000 24 000 3248 79 068 24 000 3 248 51 820 Mar '16 3 000 $ 8 400 8 000 7 200 2 000 24 000 24 000 2 800 79 400 24 000 2 800 52 600 $ Apr '16 3 000 10 920 8 000 9 360 2000 24 000 24 000 3192 84 472 24 000 3192 57 280 May '16 $ 3 000 14 175 8 000 12 150 2000 24 000 24 000 3360 90 685 24 000 3360 S 63 325 June '16 6 mos total $ 3 000 $ 18 000 17 325 $ 65 800 8 000 $ 48 000 14 850 $ 56 400 2 000 $ 12 000 24 000 $ 144 000 24 000 $ 144 000 4 368 $ 20 118 97 543 $ 508 318 24 000 $ 144 000 4 368 $ 20 118 $ 69 175 $ 344 200 $ $ $ Equipment payment - January Equipment payment - February Dividends - March Minimum Monthly Cash Budget 50 000 30 000 12 000 15 000 $ Cash Budget $ $ $ Jan '16 15 000 104 200 119 200 Feb '16 15 000 106 132 121 132 Mar '16 15 344 112 300 127 644 Apr '16 15 529 134 328 149 857 May '16 June '16 6 mos total $ 15 887 $ 15 571 $ 92 331 1 71 315 214 572 $ 842 847 187 202 230 143 $ 935 178 43 200 50 000 50 000 43 968 51 820 30 000 50 515 52 600 61 690 57 280 76 306 63 325 87 847 69 175 $ $ 363 526 344 200 Cash balance, beginning Add collections from customers Total cash available Less disbursements: Cash disbursements for merchandise purch. Cash disbursements for operating expenses Equipment purchases Dividends Total cash disbursements Excess of receipts over disbursements Financing Borrowing-note Repayments-note Total financing Cash balance, ending 143 200 (24 000) 125 788 (4 656) 12 000 115 115 12 529 118 970 30 887 139 631 47 571 157 022 $ 73 121 $ 799 726 135 452 39 000 20 000 3 000 62 000 (62 000) 39 000 15 000 20 000 24 656 3 000 15529 (15000) (15000) 15 887 (32 000) (32 000) 15571 (15000) $ (15000) $ 58 121 5 $ $ $ $ $ $ 144 764 Budgeted Income Statement $ Sales, net Cost of goods sold: Gross margin Total operating expenses Net Income Jan '16 100 000 $ 40 000 60 000 $ 77 150 (17 150) $ Feb '16 Mar '16 114 000 $ 120 000 $ 45 600 49 440 68 400 $ 70 560 $ 79 068 79 400 (10 668) $ (8 840) $ Apr '16 156 000 65 520 90 480 8 4 472 6008 May '16 June '16 $ 202 500 $ 247 500 $ 7 7 868 97 020 $ $ 124 632 $ 150 480 $ 90 685 97 543 $ $ 33 947 $ 52 937 S Total 940 000 375 448 564 552 508 318 56 234 Budgeted Balance Sheet 6/30/2016 $ Assets Current Assets: Cash Accounts receivable Supplies Merchandise Inventory Plant and Equipment: Buildings and Equipment Accumulated Depreciation Total assets 58 121 121 275 2 000 31 752 $ 213 148 1 130 000 550 475 $ $ 579 525 792 673 $ 53 978 Liabilities and Equity Accounts payable Capital stock Retained earnings Total liabilities and equity 200 000 367 045 567 045 621 023 $