

Answered step by step
Verified Expert Solution
Question
1 Approved Answer
Please help with Exercise 1, this is MATLAB programming. EXAMPLE 2: Display a histogram of the Daphne Island beak size data Create a new cell
Please help with Exercise 1, this is MATLAB programming.
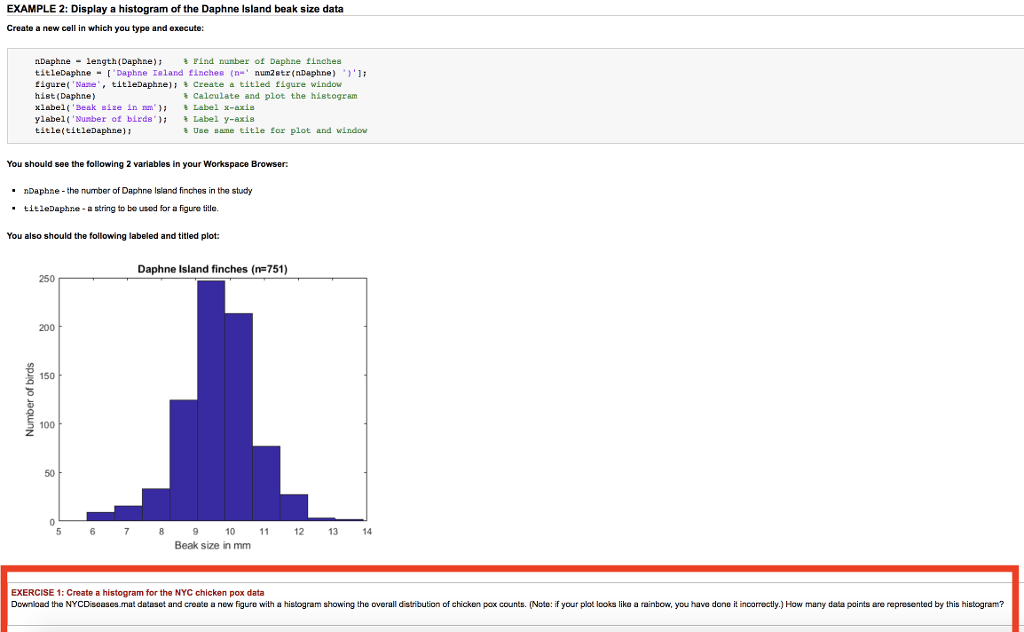
EXAMPLE 2: Display a histogram of the Daphne Island beak size data Create a new cell in which you type and execute: nDaphne-length (Daphne); % rnd number of Daphne finches titleDaphne [Daphne Island inches (n-um2str (nDaphne)'1 figure( , Nane', titleDaphne); % create a titled figure window hiet (Daphne) x1abel( 'Beak Bize in lun'); % Label x-axis ylabel('Number of birds'); % Label y-axis title(titleDaphne) : % Calculate and plot the histogram Use tane title for plot and window You should see the following 2 variables in your Workspace Browser nDaphne-the number of Daphne Island finches in the study titleDaphne -a string to bo used for a figuro titlo You also should the following labeled and titled plot Daphne Island finches (n751) 250 200 150 100 50 10 12 13 14 Beak size in mm EXERCISE 1: Create a histogram for the NYC chicken pox data Downloed the NYCDiseases mat dataset and create a new figure with a histogram showing the overall distribution of chicken pax counts. (Noto: if your plot looks like a rainbow, you have done it incorrectly.) How many data points are represented by this histogramStep by Step Solution
There are 3 Steps involved in it
Step: 1

Get Instant Access to Expert-Tailored Solutions
See step-by-step solutions with expert insights and AI powered tools for academic success
Step: 2

Step: 3
Ace Your Homework with AI
Get the answers you need in no time with our AI-driven, step-by-step assistance
Get Started
Postgresql 10 Administration Cookbook Over 5 Effective Recipes For Database Management And Maintenance In Postgresql 10
Authors: Simon Riggs ,Gianni Ciolli
4th Edition
1788474929, 978-1788474924