Answered step by step
Verified Expert Solution
Link Copied!

Question

1 Approved Answer

(PLEASE HELP WITH FORMULAS) it doesnt need to be all i just need to understand whats going on. thanks! .The market share and sales forecast

  1. (PLEASE HELP WITH FORMULAS) it doesnt need to be all i just need to understand whats going on. thanks! .The market share and sales forecast will be based on the following data set:

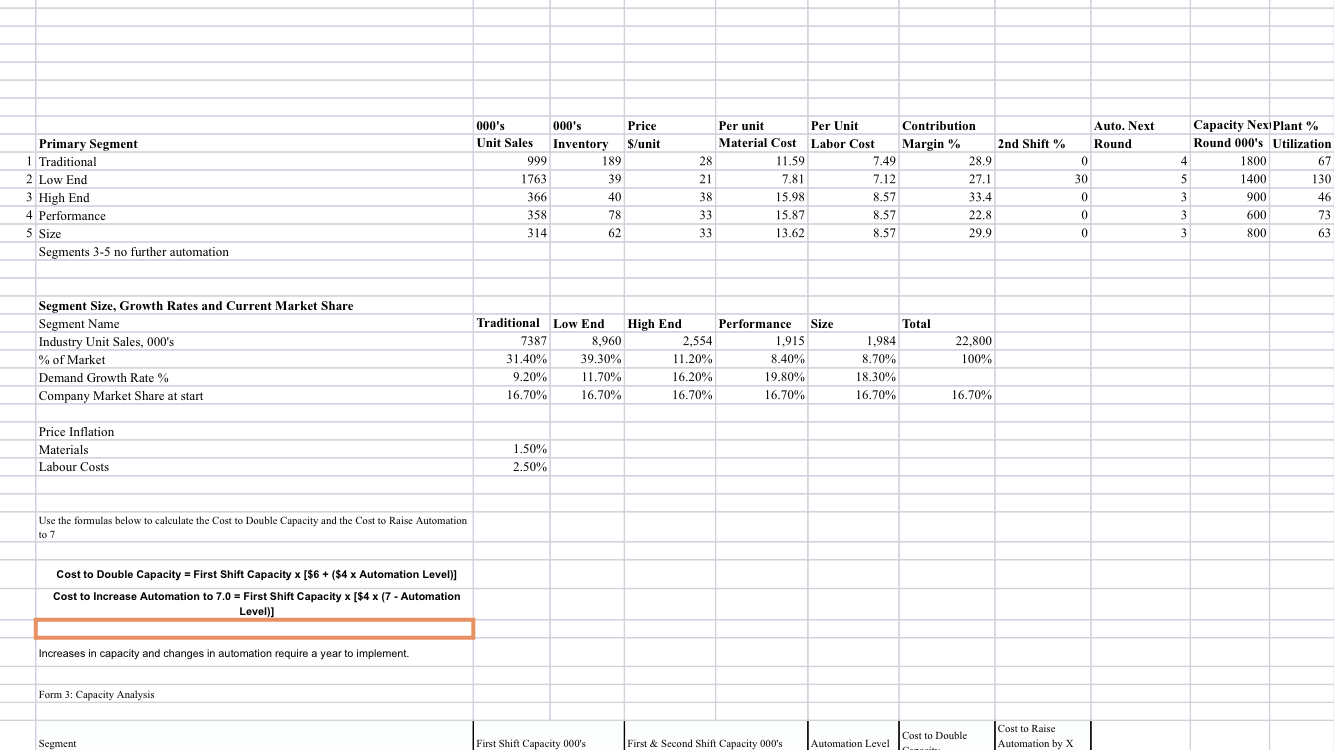
Five sensor market segments with growth rates and unit sales of different sizes

Pricing ranges for each sensor segment but given to start. Assume that inflation runs 1.5% on sales prices

Market share forecast analysis with probability outcomes to be donedoesnt

Operating parameters for evaluation:

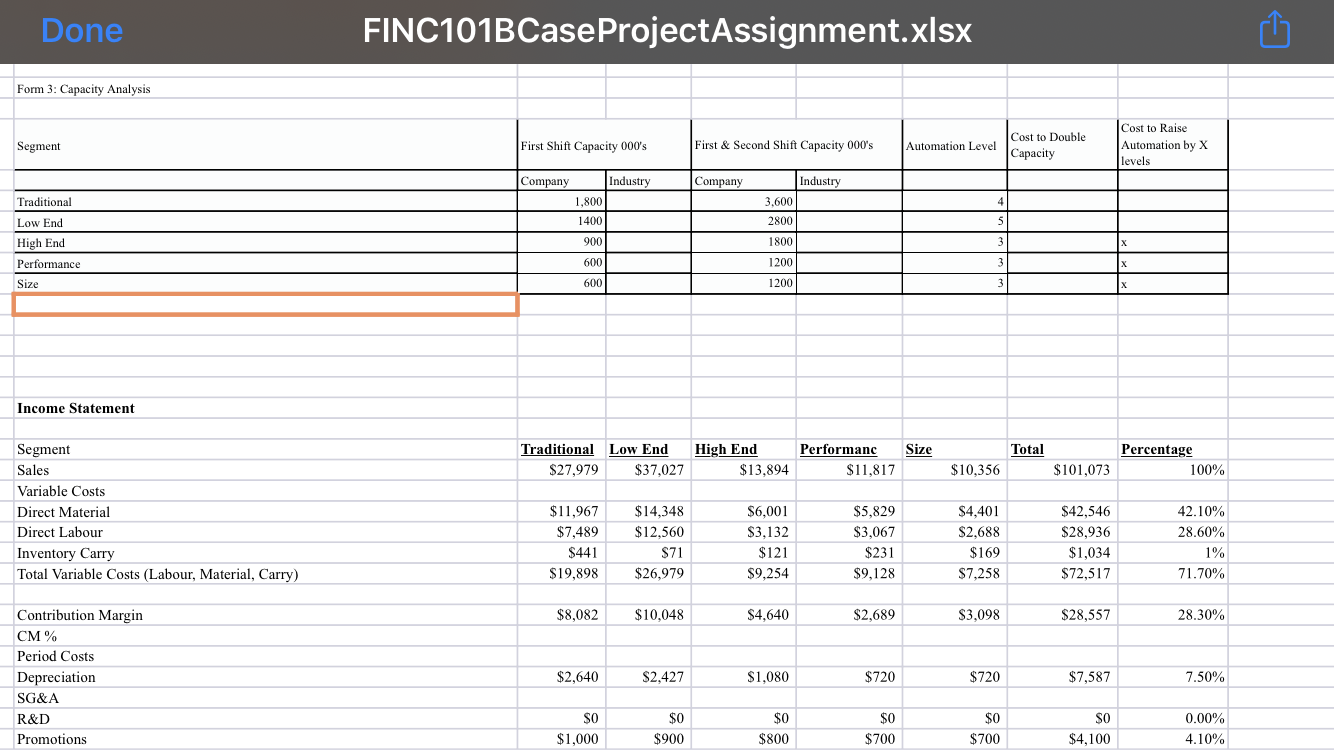
  1. Project expansions based on market growth and existing capacity of the 5 production lines

Step costs of expansion capacity

Automation costs of capacity

CCA/FCF/NPV of potential capacity expansion/addition

Labour and material cost forecasts, labour shift use once exceeding 100% first shift capacity, additional capacity has no additional overhead but labour rates are 150%

  1. WACC

Determine the appropriate debt costs based on risk rating and ratio analysis from market rates

Determine the appropriate cost of equity based on risk analysis, CAPM and debt and return premiums

  1. Valuation Analysis
  1. Utilize multiple methods of valuation based on FCF, normalized earnings and FCF, multiples of earnings, cap rates, P/E or P/CF, horizon values and DCF, liquidation value

Background of the Industry

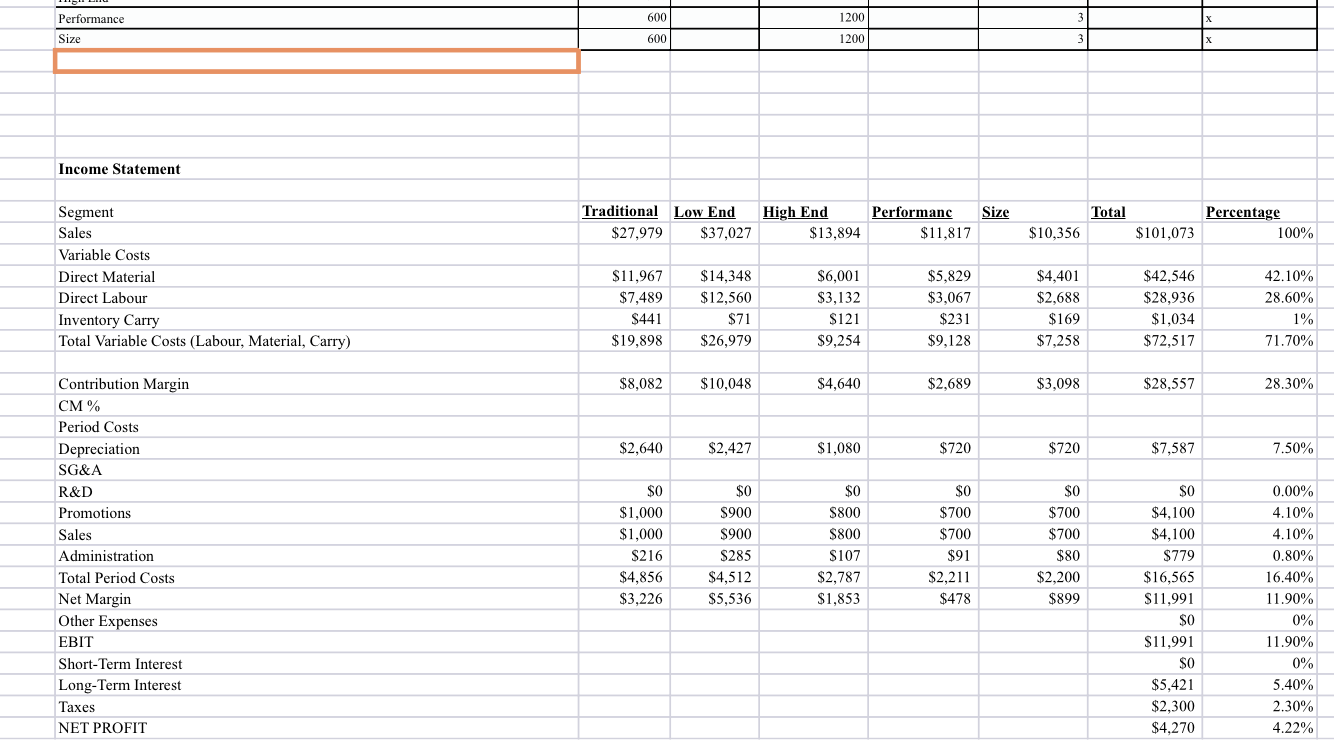
The company is in the business of manufacturing sensors in five different markets for such things as cell phones, elevators, doors, monitoring etc. Each sensor has specific size, performance and MTBF requirements and different price points in a competitive market. Although the characteristics change every year, we will be assuming no change in the sensor design as we cannot model the changes and costs without a full simulation. The company has existing production and capacity with starting performance data to use for forecasting purposes prices, material costs, labour, inflation.

As the market segments grow, eventually capacity utilization will max out and you will need to purchase additional capacity. Unused capacity in sectors can be sold off and the funds used for other lines if the segment never reached full capacity. Automation is also an issue as some segments are slower growing but margins get squeezed due to labour, material and pricing decrease pressures. You can determine whether this is beneficial by analyzing the costs of automation versus the cost savings and CCA PVTS analysis. However, capacity expansion and automation require one year to install and test before production so you need to plan for that in the budgeting and forecasting of market shares, units, capacity and future sales with the one year delay required.

We will be ignoring R&D costs in this forecast as again, we need additional time and data that we dont have at this point.

Pricing Sensors

The first decision the you must make is to price each product. Prices in all segments will increase at 1.5% per year. This puts pressure on companies to improve their cost structures due to competition and inflation of labour and materials versus scale. If you increase your capacity, assume you can offset the increases of material cost increase of 1.5% but labour still increases at 2.5% per hour but automation decreases labour costs as below.

With respect to SG&A, your income statements indicate a 8.88% of sales, so plan on using more, up to 12% as capacity grows

Capacity

First-shift capacity is defined as the number of units that can be produced on an assembly line in a single year with a daily eight-hour shift. An assembly line can produce up to twice its first-shift capacity with a second shift. An assembly line with a capacity of 2,000,000 units per year could produce 4,000,000 units with a second shift. However, second-shift labor costs are 50% higher than the first shift.

Each new unit of capacity costs $6.00 for the floor space plus $4.00 multiplied by the automation rating. Increases in capacity require a full year to take effect increase it this year, use it next year. We will assume a starting automation level of the following and a maximum 6 over the time. This will only apply to Traditional and Low-end segments to simplify things.

Capacity can be sold at the beginning of the year for $0.50 on the dollar value of the original investment. You can replace the capacity in later years, but you have to pay full price. If you sell capacity for less than its depreciated value, you lose money, which is reflected as a write-off on your income statement. If you sell capacity for more than its depreciated value, you make a gain on the sale. This will be reflected as recapture income (a negative write-off) on the income statement.

For each point of change in automation, up or down, the company is charged $4.00 per unit of capacity. For example, if a line has a capacity of 1,000,000 units, the cost of changing the automation level from 5.0 to 6.0 would be $4,000,000.

Automation

As automation levels increase, the number of labor hours required to produce each unit falls. The lowest automation rating is 1.0; the highest rating is 10.0.

At an automation rating of 1.0, labor costs are highest. Each additional point of automation decreases labor costs approximately 10%. At a rating of 10.0, labor costs fall about 90%. We will limit it to 7 for Traditional and Low End segments. No automation for the other three sectors.

Labor costs increase each year because of an annual raise in the workers contract of 2.5%/hr.

Despite its attractiveness, two factors should be considered before raising automation:

  1. is expensive: At $4.00 per point of automation, raising automation from 3.0 to 7.0 costs $16.00 per unit of capacity;

Changes in automation require a full year to take effect change it this year, use it next year.

Depreciation is also an issue. Assume that you will use Class 43 going forward and make adjustments to your FFS. Tax rate will be 35%

  1. the capital needed to expand assets, particularly plant and equipment. Capital can be acquired through: Current Debt, Stock Issues, Bond Issues (Long Term Debt), Profits (cash/retained earnings)
  2. a dividend policy that maximizes the return to shareholders.
  3. the Accounts Payable policy and Accounts Receivable policy.
  4. the financial structure of the firm and its relationship between debt and equity.

Bonds

All bonds are 10-year notes. Your company pays a 2% brokerage fee for issuing bonds. Adjust your rate to reflect issue costs. Bondholders will lend total amounts up to 80% of the value of your plant and equipment (the Production Departments capacity and automation).

When issuing new bonds, the interest rate will be a spread over the Government of Canada 10 year current debt interest rates based on your bond credit rating of B. Bonds are retired in the order they were issued. The oldest bonds retire first. There are no brokerage fees for bonds that are allowed to mature to their due date.

Currently, there is interest based on the current long term debt of $41.7 Million at 13% but you will adjust this going forward to more realistic rates based on your research.

When Bonds Come Due

Assume as an example that the face value of the bond is $1,000,000 and due end of 2024. The $1,000,000 repayment is acknowledged in your reports. Your annual reports would reflect an increase in current debt of $1,000,000 offset by a decrease in long term debt of $1,000,000. The 2024 report will list the bond because you are making decisions on January 1, 2024, when the bond still exists. Your 2025 report would show a $1,000,000 increase in current debt and the bond no longer appears. Or you may have sufficient cash to pay off directly or refinance.

Stock

Stock issue transactions take place at the current market price. Your company pays a 5% brokerage fee for issuing stock. New stock issues are limited to 10% of your companys outstanding shares in that year.

Stock price is driven by book value, the last two years earnings per share (EPS) and the last two years annual dividend. Book value is equity divided by shares outstanding. EPS is calculated by dividing net profit by shares outstanding.

The dividend amount of money paid per share to stockholders each year is subject to company policy. If you cannot use profits to grow the company, idle assets will accumulate but you can pay dividends and you can retire stock. The amount cannot exceed 5% of your outstanding shares per year. You are charged a 1% brokerage fee to retire stock.

Worst Case/Best Case/Base Case use Chapter 11 Tool Kit xlsx for reference and use. Also Chapter 5 Toolkit for FFS

You can enter sales forecasts and production schedules that develop worst-case/best-case scenarios and base case by expected probability weighting or other. Here is an example:

You generate a pessimistic forecast of 1,200,000 for your Traditional product, which predicts in the worst case monthly sales of 100,000 units. As a matter of policy, your management team might decide that manufacturing an additional three months worth of inventory, or 300,000 units, is an acceptable risk when compared to the potential reward of making extra sales.

In the Marketing page, enter the worst case forecast of 1,200 in the Your Sales Forecast cell. In the Production page, enter the best case of 1,500 for the Production Schedule (if inventory remains from the previous year, be sure to subtract that from the 1,500). At the end of the year, in the worst case you will have sold 1,200,000 units and have 300,000 units in inventory. In the best case you will have sold 1,500,000 units and have zero inventory.

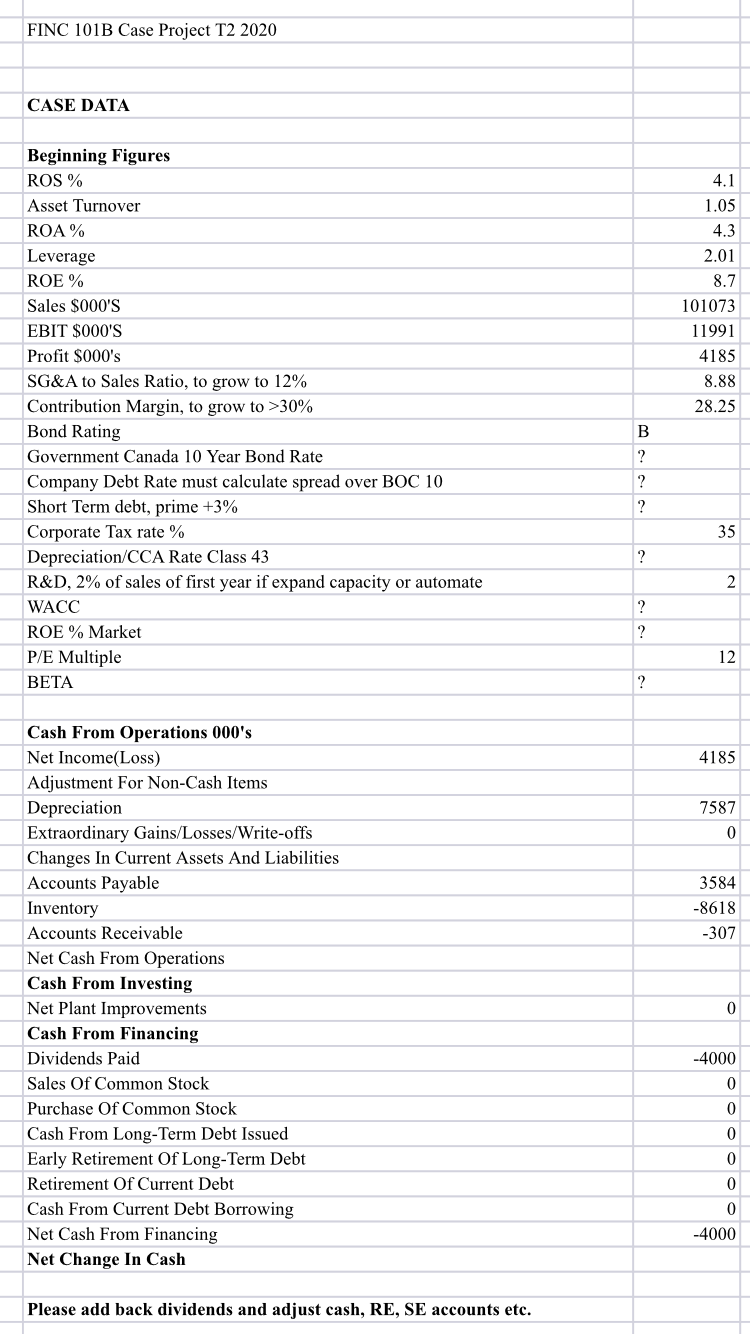
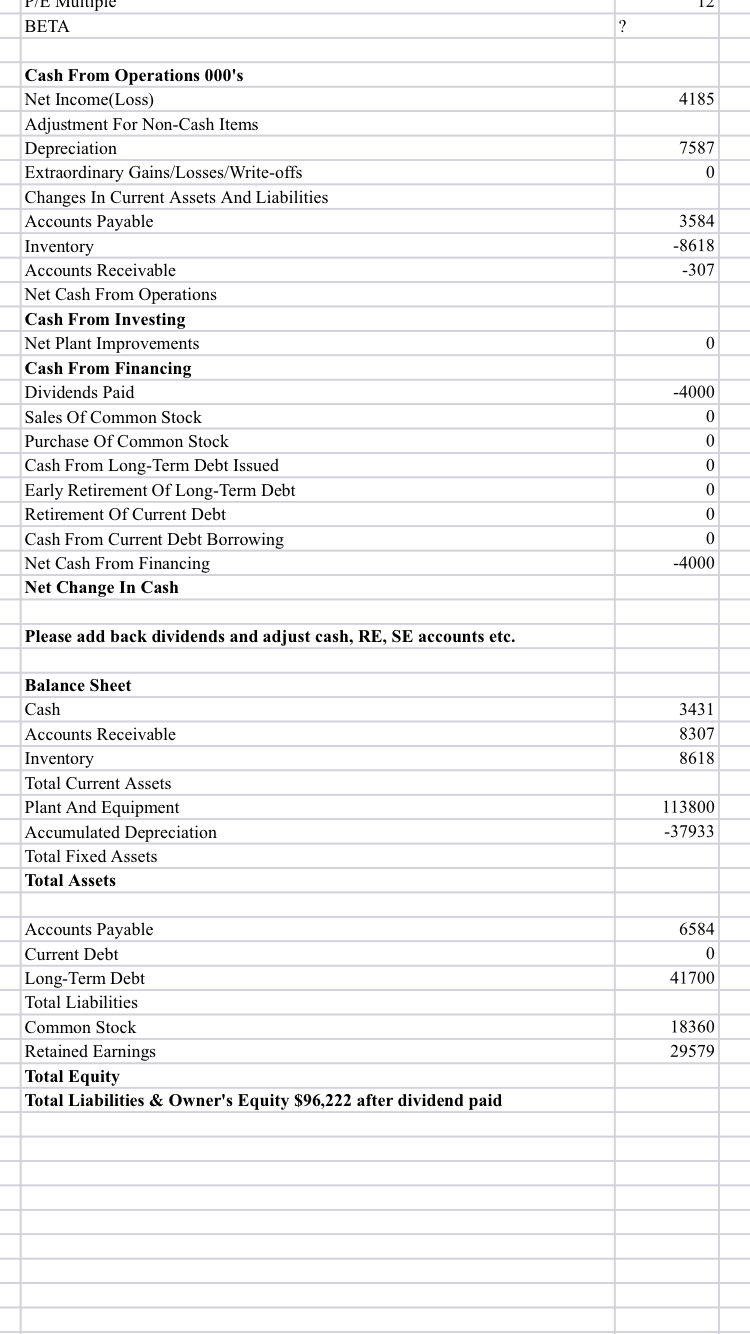
We will assume a constant P/E ratio at this point to generate stock prices for purposes of issuing or buying back stock. We will adjust for no dividends at this point so add back the 4,000,000 already paid back to the proper adjustment accounts and remove the dividend paid below:

Relevant Data:

Company

Closing Price

Change

Shares Outstanding

Market Cap

Book Value

EPS

Dividend

Yield

P/E

WHOAMI

$34.25

$0.00

2,000,000

$68m

$23.97

$2.09

$2.00

5.8%

16.37

image text in transcribedimage text in transcribedimage text in transcribedimage text in transcribedimage text in transcribed

FINC 101B Case Project T2 2020 CASE DATA 4.1 1.05 4.3 2.01 8.7 101073 11991 4185 8.88 28.25 Beginning Figures ROS % Asset Turnover ROA% Leverage ROE % Sales $000'S EBIT $000'S Profit $000's SG&A to Sales Ratio, to grow to 12% Contribution Margin, to grow to >30% Bond Rating Government Canada 10 Year Bond Rate Company Debt Rate must calculate spread over BOC 10 Short Term debt, prime +3% Corporate Tax rate % Depreciation/CCA Rate Class 43 R&D, 2% of sales of first year if expand capacity or automate WACC ROE % Market P/E Multiple BETA B ? ? ? 35 ? 2 ? ? 12 ? 4185 7587 0 3584 -8618 -307 Cash From Operations 000's Net Income(Loss) Adjustment For Non-Cash Items Depreciation Extraordinary Gains/Losses/Write-offs Changes In Current Assets And Liabilities Accounts Payable Inventory Accounts Receivable Net Cash From Operations Cash From Investing Net Plant Improvements Cash From Financing Dividends Paid Sales Of Common Stock Purchase Of Common Stock Cash From Long-Term Debt Issued Early Retirement Of Long-Term Debt Retirement Of Current Debt Cash From Current Debt Borrowing Net Cash From Financing Net Change In Cash 0 -4000 0 0 0 0 0 0 -4000 Please add back dividends and adjust cash, RE, SE accounts etc. P/E Multiple BETA 12 ? 4185 7587 0 3584 -8618 -307 Cash From Operations 000's Net Income(Loss) Adjustment For Non-Cash Items Depreciation Extraordinary Gains/Losses/Write-offs Changes In Current Assets And Liabilities Accounts Payable Inventory Accounts Receivable Net Cash From Operations Cash From Investing Net Plant Improvements Cash From Financing Dividends Paid Sales Of Common Stock Purchase Of Common Stock Cash From Long-Term Debt Issued Early Retirement Of Long-Term Debt Retirement Of Current Debt Cash From Current Debt Borrowing Net Cash From Financing Net Change In Cash 0 -4000 0 0 0 0 0 0 -4000 Please add back dividends and adjust cash, RE, SE accounts etc. Balance Sheet Cash 3431 8307 8618 Accounts Receivable Inventory Total Current Assets Plant And Equipment Accumulated Depreciation Total Fixed Assets Total Assets 113800 -37933 6584 0 41700 Accounts Payable Current Debt Long-Term Debt Total Liabilities Common Stock Retained Earnings Total Equity Total Liabilities & Owner's Equity $96,222 after dividend paid 18360 29579 Auto. Next Round 7.49 Primary Segment 1 Traditional 2 Low End 3 High End 4 Performance 5 Size Segments 3-5 no further automation 000's 000's Price Unit Sales Inventory S/unit 999 189 1763 39 366 40 358 78 314 62 Per unit Per Unit Contribution Material Cost Labor Cost Margin % 2nd Shift % 28 11.59 28.9 21 7.81 7.12 27.1 38 15.98 8.57 33.4 33 15.87 8.57 22.8 33 13.62 8.57 29.9 0 30 0 4 5 3 Capacity NexiPlant % Round 000's Utilization 1800 67 1400 130 900 46 600 73 800 63 3 0 0 Total Segment Size, Growth Rates and Current Market Share Segment Name Industry Unit Sales, 000's % of Market Demand Growth Rate % Company Market Share at start Traditional 7387 31.40% 9.20% 16.70% Low End 8,960 39.30% 11.70% 16.70% High End Performance Size 2,554 1,915 11.20% 8.40% 16.20% 19.80% 16.70% 16.70% 22,800 100% 1.984 8.70% 18.30% 16.70% 16.70% Price Inflation Materials Labour Costs 1.50% 2.50% Use the formulas below to calculate the Cost to Double Capacity and the Cost to Raise Automation to 7 Cost to Double Capacity = First Shift Capacity x [$6+ ($4 x Automation Level)] Cost to Increase Automation to 7.0 = First Shift Capacity x [$4 x (7 - Automation Level)] Increases in capacity and changes in automation require a year to implement. Form 3: Capacity Analysis Cost to Double Cost to Raise Automation by X Segment First Shift Capacity 000's First & Second Shift Capacity 000's Automation Level Done FINC101BCase ProjectAssignment.xlsx Form 3: Capacity Analysis Segment First Shift Capacity 000's First & Second Shift Capacity 000's Automation Level Cost to Double Capacity Cost to Raise Automation by X levels Industry Company Industry Traditional Company 1,800 1400 3.600 Low End 2800 900 High End Performance Size 600 1800 1200 1200 600 Income Statement Size Total Traditional Low End $27,979 $37,027 High End $13.894 Performanc $11,817 Percentage 100% $10,356 $101,073 Segment Sales Variable Costs Direct Material Direct Labour Inventory Carry Total Variable Costs (Labour, Material, Carry) $11.967 $7,489 $441 $19,898 $14,348 $12,560 $71 $26,979 $6,001 $3,132 $121 $9,254 $5,829 $3,067 $231 $9,128 $4,401 $2,688 $169 $7,258 $42,546 $28,936 $1,034 $72,517 42.10% 28.60% 1% 71.70% $8,082 $10,048 $4,640 $2,689 $3,098 $28,557 28.30% Contribution Margin CM% Period Costs Depreciation SG&A R&D Promotions $2,640 $2,427 $1,080 $720 $720 $7,587 7.50% SO $1,000 $0 $900 $0 $800 $0 $700 $0 $700 SO $4,100 0.00% 4.10% 600 Performance Size 1200 1200 600 Income Statement Size Traditional Low End $27,979 $37,027 High End $13,894 Performanc $11,817 Total $101,073 Percentage 100% $10,356 Segment Sales Variable Costs Direct Material Direct Labour Inventory Carry Total Variable Costs (Labour, Material, Carry) $11,967 $7,489 S441 $19,898 $14,348 $12,560 $71 $26,979 $6,001 $3,132 $121 $9,254 $5,829 $3,067 $231 $9,128 $4,401 $2,688 $169 $7,258 $42,546 $28,936 $1,034 $72,517 42.10% 28.60% 1% 71.70% $8,082 $10,048 $4,640 $2,689 $3,098 $28,557 28.30% $2,640 $2,427 $1,080 $720 $720 $7,587 7.50% SO $0 SO SO SO Contribution Margin CM% Period Costs Depreciation SG&A R&D Promotions Sales Administration Total Period Costs Net Margin Other Expenses EBIT Short-Term Interest Long-Term Interest Taxes NET PROFIT $1,000 $1,000 S216 $4,856 $3,226 $900 $900 $285 $4,512 $5,536 $0 S800 $800 $107 $2,787 $1,853 $700 $700 $91 $2,211 $478 $700 $700 $80 $2,200 $899 $4,100 $4,100 $779 $16,565 $11,991 $0 $11,991 SO $5,421 $2,300 $4,270 0.00% 4.10% 4.10% 0.80% 16.40% 11.90% 0% 11.90% 0% 5.40% 2.30% 4.22% FINC 101B Case Project T2 2020 CASE DATA 4.1 1.05 4.3 2.01 8.7 101073 11991 4185 8.88 28.25 Beginning Figures ROS % Asset Turnover ROA% Leverage ROE % Sales $000'S EBIT $000'S Profit $000's SG&A to Sales Ratio, to grow to 12% Contribution Margin, to grow to >30% Bond Rating Government Canada 10 Year Bond Rate Company Debt Rate must calculate spread over BOC 10 Short Term debt, prime +3% Corporate Tax rate % Depreciation/CCA Rate Class 43 R&D, 2% of sales of first year if expand capacity or automate WACC ROE % Market P/E Multiple BETA B ? ? ? 35 ? 2 ? ? 12 ? 4185 7587 0 3584 -8618 -307 Cash From Operations 000's Net Income(Loss) Adjustment For Non-Cash Items Depreciation Extraordinary Gains/Losses/Write-offs Changes In Current Assets And Liabilities Accounts Payable Inventory Accounts Receivable Net Cash From Operations Cash From Investing Net Plant Improvements Cash From Financing Dividends Paid Sales Of Common Stock Purchase Of Common Stock Cash From Long-Term Debt Issued Early Retirement Of Long-Term Debt Retirement Of Current Debt Cash From Current Debt Borrowing Net Cash From Financing Net Change In Cash 0 -4000 0 0 0 0 0 0 -4000 Please add back dividends and adjust cash, RE, SE accounts etc. P/E Multiple BETA 12 ? 4185 7587 0 3584 -8618 -307 Cash From Operations 000's Net Income(Loss) Adjustment For Non-Cash Items Depreciation Extraordinary Gains/Losses/Write-offs Changes In Current Assets And Liabilities Accounts Payable Inventory Accounts Receivable Net Cash From Operations Cash From Investing Net Plant Improvements Cash From Financing Dividends Paid Sales Of Common Stock Purchase Of Common Stock Cash From Long-Term Debt Issued Early Retirement Of Long-Term Debt Retirement Of Current Debt Cash From Current Debt Borrowing Net Cash From Financing Net Change In Cash 0 -4000 0 0 0 0 0 0 -4000 Please add back dividends and adjust cash, RE, SE accounts etc. Balance Sheet Cash 3431 8307 8618 Accounts Receivable Inventory Total Current Assets Plant And Equipment Accumulated Depreciation Total Fixed Assets Total Assets 113800 -37933 6584 0 41700 Accounts Payable Current Debt Long-Term Debt Total Liabilities Common Stock Retained Earnings Total Equity Total Liabilities & Owner's Equity $96,222 after dividend paid 18360 29579 Auto. Next Round 7.49 Primary Segment 1 Traditional 2 Low End 3 High End 4 Performance 5 Size Segments 3-5 no further automation 000's 000's Price Unit Sales Inventory S/unit 999 189 1763 39 366 40 358 78 314 62 Per unit Per Unit Contribution Material Cost Labor Cost Margin % 2nd Shift % 28 11.59 28.9 21 7.81 7.12 27.1 38 15.98 8.57 33.4 33 15.87 8.57 22.8 33 13.62 8.57 29.9 0 30 0 4 5 3 Capacity NexiPlant % Round 000's Utilization 1800 67 1400 130 900 46 600 73 800 63 3 0 0 Total Segment Size, Growth Rates and Current Market Share Segment Name Industry Unit Sales, 000's % of Market Demand Growth Rate % Company Market Share at start Traditional 7387 31.40% 9.20% 16.70% Low End 8,960 39.30% 11.70% 16.70% High End Performance Size 2,554 1,915 11.20% 8.40% 16.20% 19.80% 16.70% 16.70% 22,800 100% 1.984 8.70% 18.30% 16.70% 16.70% Price Inflation Materials Labour Costs 1.50% 2.50% Use the formulas below to calculate the Cost to Double Capacity and the Cost to Raise Automation to 7 Cost to Double Capacity = First Shift Capacity x [$6+ ($4 x Automation Level)] Cost to Increase Automation to 7.0 = First Shift Capacity x [$4 x (7 - Automation Level)] Increases in capacity and changes in automation require a year to implement. Form 3: Capacity Analysis Cost to Double Cost to Raise Automation by X Segment First Shift Capacity 000's First & Second Shift Capacity 000's Automation Level Done FINC101BCase ProjectAssignment.xlsx Form 3: Capacity Analysis Segment First Shift Capacity 000's First & Second Shift Capacity 000's Automation Level Cost to Double Capacity Cost to Raise Automation by X levels Industry Company Industry Traditional Company 1,800 1400 3.600 Low End 2800 900 High End Performance Size 600 1800 1200 1200 600 Income Statement Size Total Traditional Low End $27,979 $37,027 High End $13.894 Performanc $11,817 Percentage 100% $10,356 $101,073 Segment Sales Variable Costs Direct Material Direct Labour Inventory Carry Total Variable Costs (Labour, Material, Carry) $11.967 $7,489 $441 $19,898 $14,348 $12,560 $71 $26,979 $6,001 $3,132 $121 $9,254 $5,829 $3,067 $231 $9,128 $4,401 $2,688 $169 $7,258 $42,546 $28,936 $1,034 $72,517 42.10% 28.60% 1% 71.70% $8,082 $10,048 $4,640 $2,689 $3,098 $28,557 28.30% Contribution Margin CM% Period Costs Depreciation SG&A R&D Promotions $2,640 $2,427 $1,080 $720 $720 $7,587 7.50% SO $1,000 $0 $900 $0 $800 $0 $700 $0 $700 SO $4,100 0.00% 4.10% 600 Performance Size 1200 1200 600 Income Statement Size Traditional Low End $27,979 $37,027 High End $13,894 Performanc $11,817 Total $101,073 Percentage 100% $10,356 Segment Sales Variable Costs Direct Material Direct Labour Inventory Carry Total Variable Costs (Labour, Material, Carry) $11,967 $7,489 S441 $19,898 $14,348 $12,560 $71 $26,979 $6,001 $3,132 $121 $9,254 $5,829 $3,067 $231 $9,128 $4,401 $2,688 $169 $7,258 $42,546 $28,936 $1,034 $72,517 42.10% 28.60% 1% 71.70% $8,082 $10,048 $4,640 $2,689 $3,098 $28,557 28.30% $2,640 $2,427 $1,080 $720 $720 $7,587 7.50% SO $0 SO SO SO Contribution Margin CM% Period Costs Depreciation SG&A R&D Promotions Sales Administration Total Period Costs Net Margin Other Expenses EBIT Short-Term Interest Long-Term Interest Taxes NET PROFIT $1,000 $1,000 S216 $4,856 $3,226 $900 $900 $285 $4,512 $5,536 $0 S800 $800 $107 $2,787 $1,853 $700 $700 $91 $2,211 $478 $700 $700 $80 $2,200 $899 $4,100 $4,100 $779 $16,565 $11,991 $0 $11,991 SO $5,421 $2,300 $4,270 0.00% 4.10% 4.10% 0.80% 16.40% 11.90% 0% 11.90% 0% 5.40% 2.30% 4.22%

Step by Step Solution

There are 3 Steps involved in it

Step: 1

blur-text-image

Get Instant Access to Expert-Tailored Solutions

See step-by-step solutions with expert insights and AI powered tools for academic success

Step: 2

blur-text-image

Step: 3

blur-text-image

Ace Your Homework with AI

Get the answers you need in no time with our AI-driven, step-by-step assistance

Get Started

Recommended Textbook for

Auditing A Complete Guide Practical Tools For Self Assessment

Authors: Gerardus Blokdyk

1st Edition

0655424571, 978-0655424574

More Books

Students also viewed these Accounting questions

Question

Describe what is the mission of DreamHome database.

Answered: 1 week ago