PLEASE HELP WITH MY STATISTICS LAB This lab is on Central Limit Theorem, & the Sampling Distribution of the Mean. This is ALL the relevant
PLEASE HELP WITH MY STATISTICS LAB
This lab is on Central Limit Theorem, & the Sampling Distribution of the Mean. This is ALL the relevant information given, there is NO Data needed for the lab. The questions are answered using the program Jamovi, which i put down bellow to download. The worksheet has questions and steps that you answer using the program (you don't submit nothing on the program, you are simply using it for statistical calculations).
Please if a tutor can at least try to help me out I urgently need help please!!.
This is the link you can use to download the program https://www.jamovi.org/
Here is the worksheet.
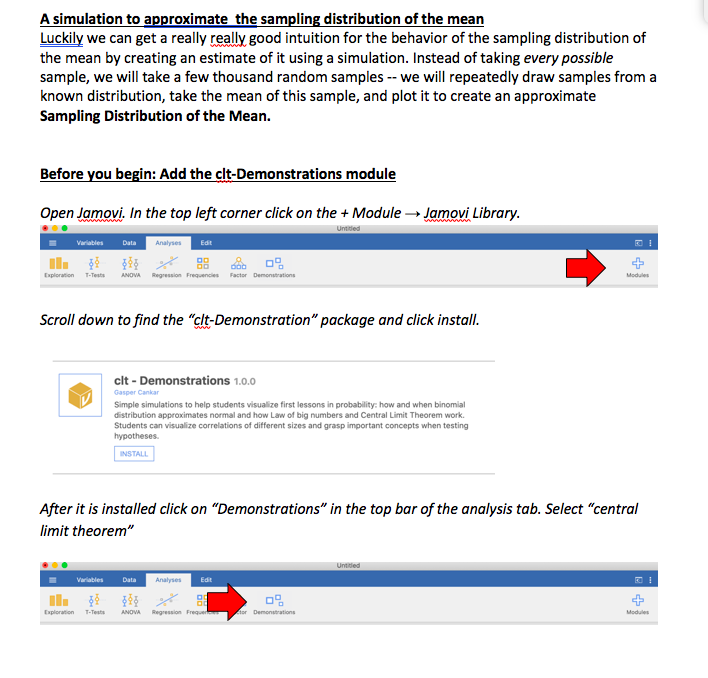
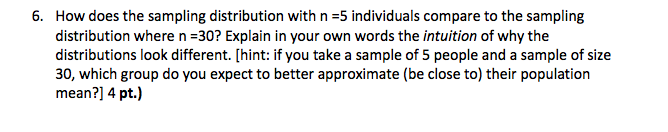
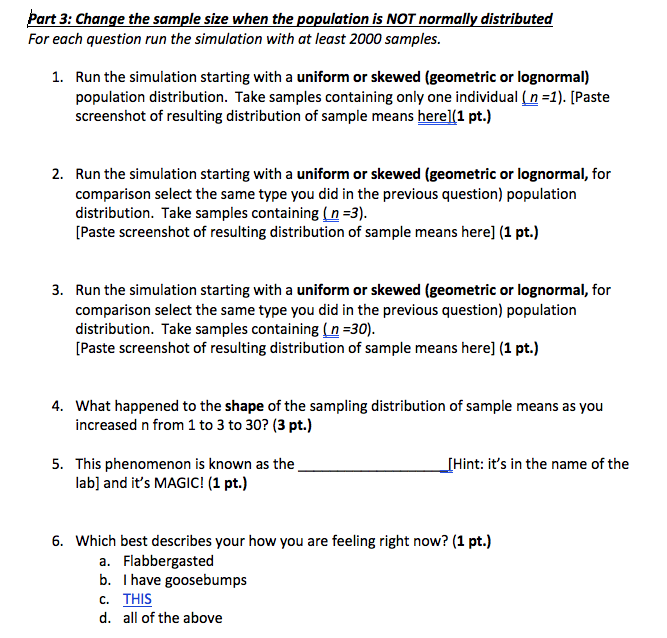
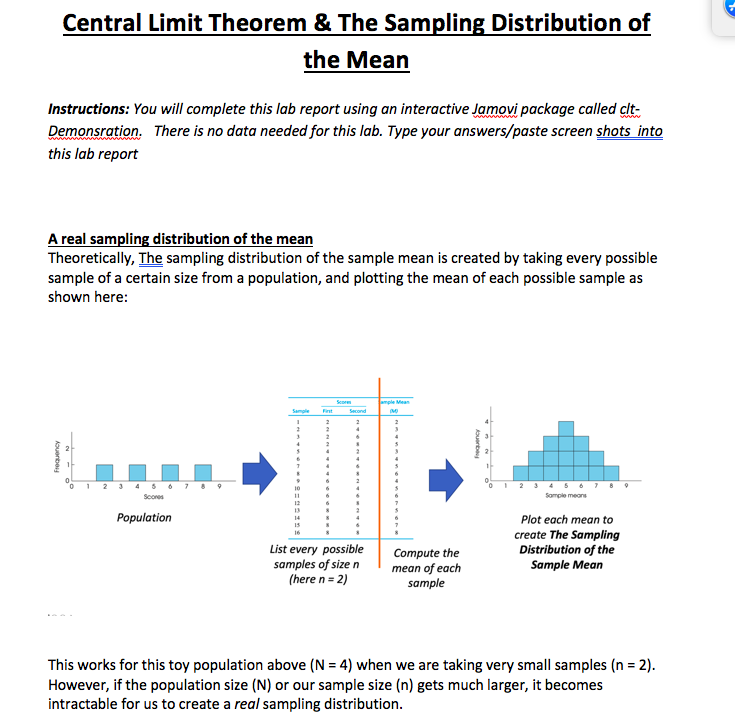
Central Limit Theorem & The Sampling Distribution of the Mean Instructions: You will complete this lab report using an interactive Jamovi package called clt- Demonsration. There is no data needed for this lab. Type your answers/paste screen shots into this lab report A real sampling distribution of the mean Theoretically, The sampling distribution of the sample mean is created by taking every possible sample of a certain size from a population, and plotting the mean of each possible sample as shown here: emply Mean First Second Froquincy Population Plot each mean to create The Sampling List every possible Compute the Distribution of the samples of size n mean of each Sample Mean (here n = 2) sample This works for this toy population above (N = 4) when we are taking very small samples (n = 2). However, if the population size (N) or our sample size (n) gets much larger, it becomes intractable for us to create a real sampling distribution.A simulation to approximate the sampling distribution of the mean Luckily we can get a really really good intuition for the behavior of the sampling distribution of the mean by creating an estimate of it using a simulation. Instead of taking every possible sample, we will take a few thousand random samples -- we will repeatedly draw samples from a known distribution, take the mean of this sample, and plot it to create an approximate Sampling Distribution of the Mean. Before you begin: Add the clt-Demonstrations module Open Jamovi. In the top left corner click on the + Module - Jamovi Library. .. . Untitled Variables Data Analyses II. + Exploration T-Tents ANOVA Factor prutrations Moduler Scroll down to find the "clt-Demonstration" package and click install. clt - Demonstrations 1.0.0 Simple simulations to help students visualize first lessons in probability: how and when binomial distribution approximates normal and how Law of big numbers and Central Limit Theorem work. Students can visualize correlations of different sizes and grasp important concepts when testing hypotheses. INSTALL After it is installed click on "Demonstrations" in the top bar of the analysis tab. Select "central limit theorem* Untiled Variables Data Analyses II Exploration T-Tents ANDVA Regression Frequent Demonstrations ModulesPart 2: Change the sample size when the population is normally distributed For each question run the simulation taking samples from a normally distributed population (source) distribution. Take at least 2000 samples. 1. Run the simulation with samples that contain only one individual ( n =1). [Paste screenshot of resulting distribution of sample means here] (1 pt.) 2. Run the simulation with a sample that contains five individuals ( n =5). [Paste screenshot of resulting distribution of sample means here](1 pt.) 3. Run the simulation with a sample that contains fifteen individuals ( n =1 5). [Paste screenshot of resulting distribution of sample means here] (1 pt.) 4. Run the simulation with a sample that contains thirty individuals (n=30). [Paste screenshot of resulting distribution of sample means here] (1 pt.) 5. The resulting sampling distributions of samples means are all approximately normal in shape, but what do you notice about the variability (spread) of each sampling distribution as you increase your sample size (as n incrementally increase from 1 to 30)? Be specific by consulting the table at the top of the right panel. (4 pt.)6. How does the sampling distribution with n =5 individuals compare to the sampling distribution where n =30? Explain in your own words the intuition of why the distributions look different. [hint: if you take a sample of 5 people and a sample of size 30, which group do you expect to better approximate (be close to) their population mean?] 4 pt.)Part 3: Change the sample size when the population is NOT normally distributed For each question run the simulation with at least 2000 samples. 1. Run the simulation starting with a uniform or skewed (geometric or lognormal) population distribution. Take samples containing only one individual ( n =1). [Paste screenshot of resulting distribution of sample means here](1 pt.) 2. Run the simulation starting with a uniform or skewed (geometric or lognormal, for comparison select the same type you did in the previous question) population distribution. Take samples containing ( n =3). [Paste screenshot of resulting distribution of sample means here] (1 pt.) 3. Run the simulation starting with a uniform or skewed (geometric or lognormal, for comparison select the same type you did in the previous question) population distribution. Take samples containing ( n =30). [Paste screenshot of resulting distribution of sample means here] (1 pt.) 4. What happened to the shape of the sampling distribution of sample means as you increased n from 1 to 3 to 30? (3 pt.) 5. This phenomenon is known as the [Hint: it's in the name of the lab] and it's MAGIC! (1 pt.) 6. Which best describes your how you are feeling right now? (1 pt.) a. Flabbergasted b. I have goosebumps C. THIS d. all of the above
Step by Step Solution
There are 3 Steps involved in it
Step: 1
Get Instant Access to Expert-Tailored Solutions
See step-by-step solutions with expert insights and AI powered tools for academic success
Step: 2
Step: 3
Ace Your Homework with AI
Get the answers you need in no time with our AI-driven, step-by-step assistance