Answered step by step
Verified Expert Solution
Question
1 Approved Answer
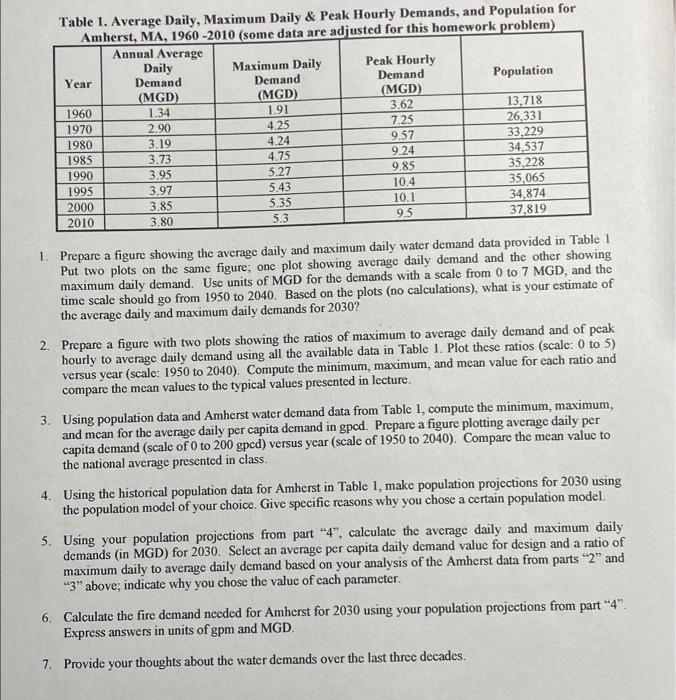
please help with problems 4-5 Table 1. Average Daily, Maximum Daily & Peak Hourly Demands, and Population for Amherst, MA, 1960 -2010 (some data are
please help with problems 4-5 
Table 1. Average Daily, Maximum Daily & Peak Hourly Demands, and Population for Amherst, MA, 1960 -2010 (some data are adjusted for this homework problem) Annual Average Daily Maximum Daily Peak Hourly Year Demand Demand Demand Population (MGD) (MGD (MGD) 1960 1.34 1.91 3.62 13,718 1970 2.90 4.25 7.25 26,331 1980 3.19 4.24 9.57 33.229 1985 3.73 4.75 9.24 34,537 1990 3.95 5.27 9.85 35,228 1995 3.97 5.43 10.4 35,065 2000 3.85 5.35 10.1 34,874 2010 95 3.80 5.3 37,819 1. Prepare a figure showing the average daily and maximum daily water demand data provided in Table 1 Put two plots on the same figure, one plot showing average daily demand and the other showing maximum daily demand. Use units of MGD for the demands with a scale from 0 to 7 MGD, and the time scale should go from 1950 to 2040. Based on the plots (no calculations), what is your estimate of the average daily and maximum daily demands for 2030? 2. Prepare a figure with two plots showing the ratios of maximum to average daily demand and of peak hourly to average daily demand using all the available data in Table 1. Plot these ratios (scale: 0 to 5) versus year (scale: 1950 to 2040). Compute the minimum, maximum, and mean value for each ratio and compare the mean values to the typical values presented in lecture. 3. Using population data and Amherst water demand data from Table 1, compute the minimum, maximum, and mean for the average daily per capita demand in gpod. Prepare a figure plotting average daily per capita demand (scale of 0 to 200 gpcd) versus year (scale of 1950 to 2040). Compare the mean value to the national average presented in class. 4. Using the historical population data for Amherst in Table 1, make population projections for 2030 using the population model of your choice. Give specific reasons why you chose a certain population model. 5. Using your population projections from part "4", calculate the average daily and maximum daily demands (in MGD) for 2030. Select an average per capita daily demand value for design and a ratio of maximum daily to average daily demand based on your analysis of the Amherst data from parts "2" and "3" above; indicate why you chose the value of each parameter. 6. Calculate the fire demand needed for Amherst for 2030 using your population projections from part "-4". Express answers in units of gpm and MGD. 7. Provide your thoughts about the water demands over the last three decades. Table 1. Average Daily, Maximum Daily & Peak Hourly Demands, and Population for Amherst, MA, 1960 -2010 (some data are adjusted for this homework problem) Annual Average Daily Maximum Daily Peak Hourly Year Demand Demand Demand Population (MGD) (MGD (MGD) 1960 1.34 1.91 3.62 13,718 1970 2.90 4.25 7.25 26,331 1980 3.19 4.24 9.57 33.229 1985 3.73 4.75 9.24 34,537 1990 3.95 5.27 9.85 35,228 1995 3.97 5.43 10.4 35,065 2000 3.85 5.35 10.1 34,874 2010 95 3.80 5.3 37,819 1. Prepare a figure showing the average daily and maximum daily water demand data provided in Table 1 Put two plots on the same figure, one plot showing average daily demand and the other showing maximum daily demand. Use units of MGD for the demands with a scale from 0 to 7 MGD, and the time scale should go from 1950 to 2040. Based on the plots (no calculations), what is your estimate of the average daily and maximum daily demands for 2030? 2. Prepare a figure with two plots showing the ratios of maximum to average daily demand and of peak hourly to average daily demand using all the available data in Table 1. Plot these ratios (scale: 0 to 5) versus year (scale: 1950 to 2040). Compute the minimum, maximum, and mean value for each ratio and compare the mean values to the typical values presented in lecture. 3. Using population data and Amherst water demand data from Table 1, compute the minimum, maximum, and mean for the average daily per capita demand in gpod. Prepare a figure plotting average daily per capita demand (scale of 0 to 200 gpcd) versus year (scale of 1950 to 2040). Compare the mean value to the national average presented in class. 4. Using the historical population data for Amherst in Table 1, make population projections for 2030 using the population model of your choice. Give specific reasons why you chose a certain population model. 5. Using your population projections from part "4", calculate the average daily and maximum daily demands (in MGD) for 2030. Select an average per capita daily demand value for design and a ratio of maximum daily to average daily demand based on your analysis of the Amherst data from parts "2" and "3" above; indicate why you chose the value of each parameter. 6. Calculate the fire demand needed for Amherst for 2030 using your population projections from part "-4". Express answers in units of gpm and MGD. 7. Provide your thoughts about the water demands over the last three decades 
Step by Step Solution
There are 3 Steps involved in it
Step: 1

Get Instant Access to Expert-Tailored Solutions
See step-by-step solutions with expert insights and AI powered tools for academic success
Step: 2

Step: 3

Ace Your Homework with AI
Get the answers you need in no time with our AI-driven, step-by-step assistance
Get Started


