Please help with requirements 1, 2. If you can please show work so I can understand calculations as well, thanks!
This is the actual questions now!

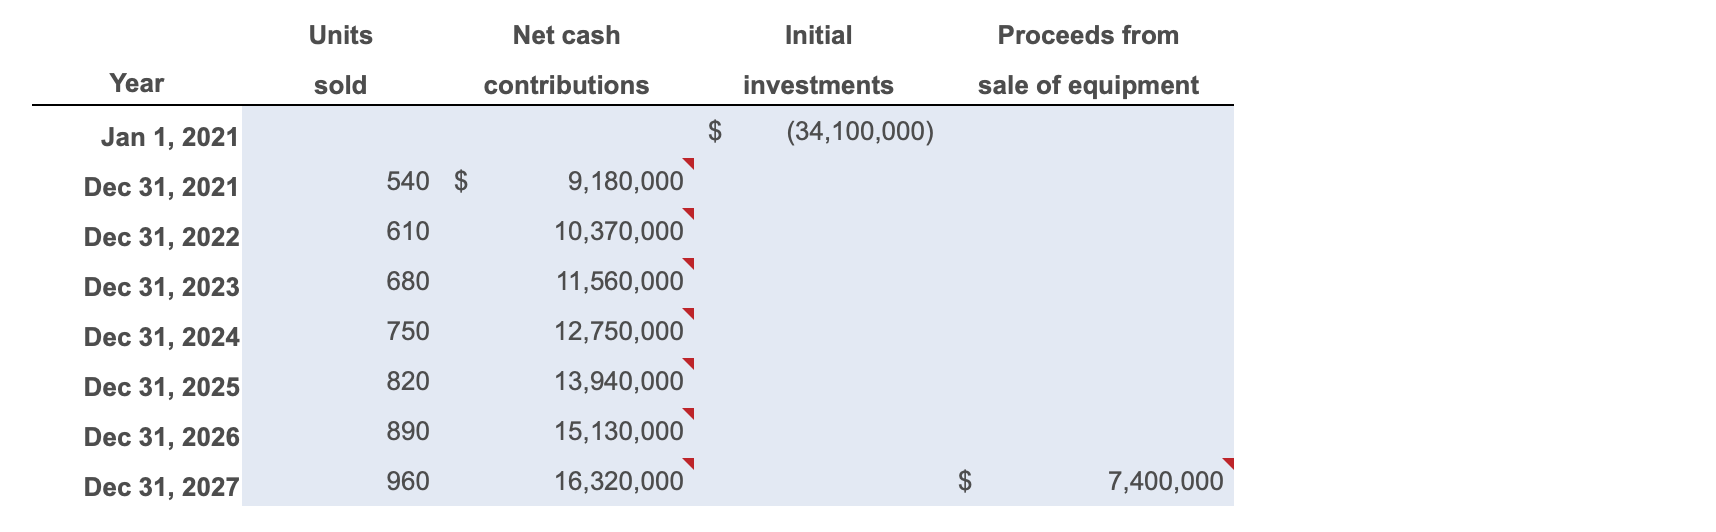
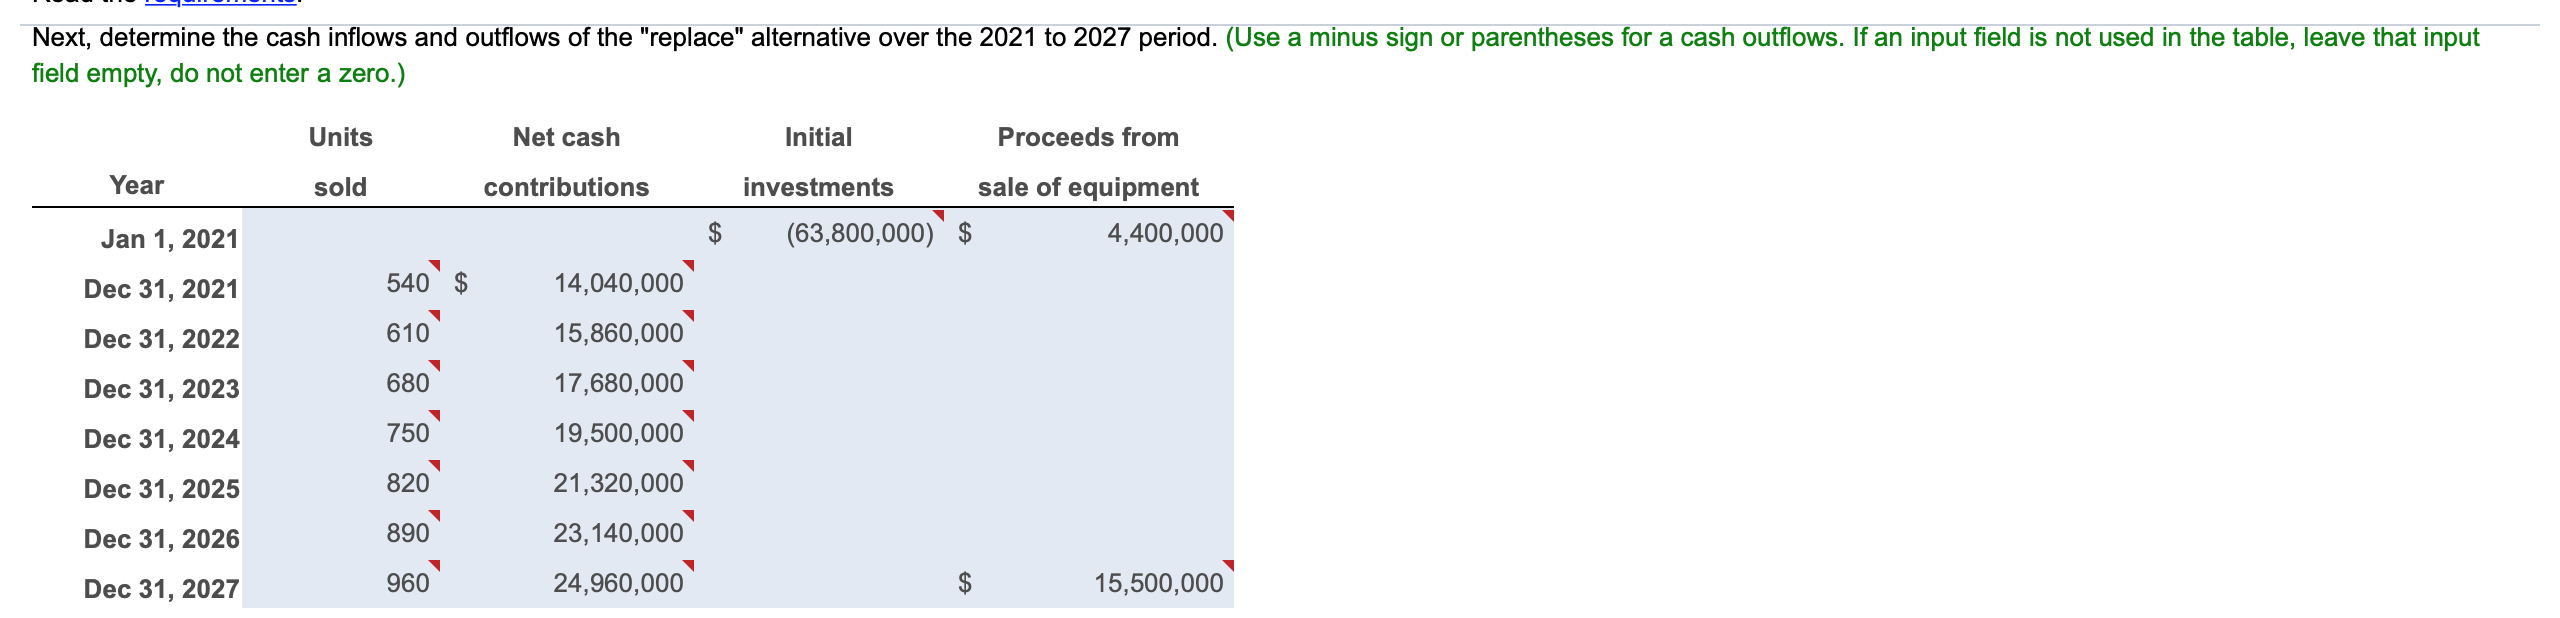

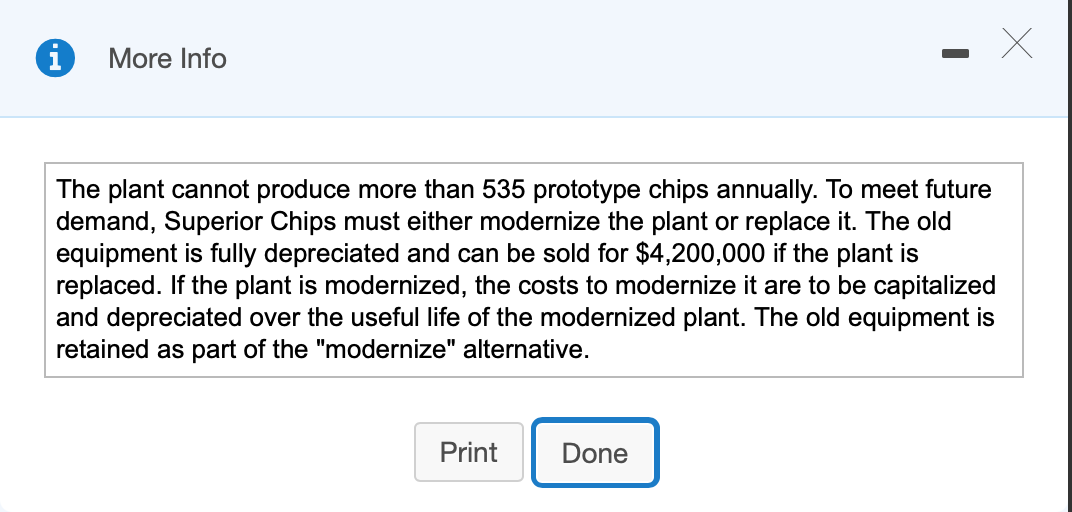
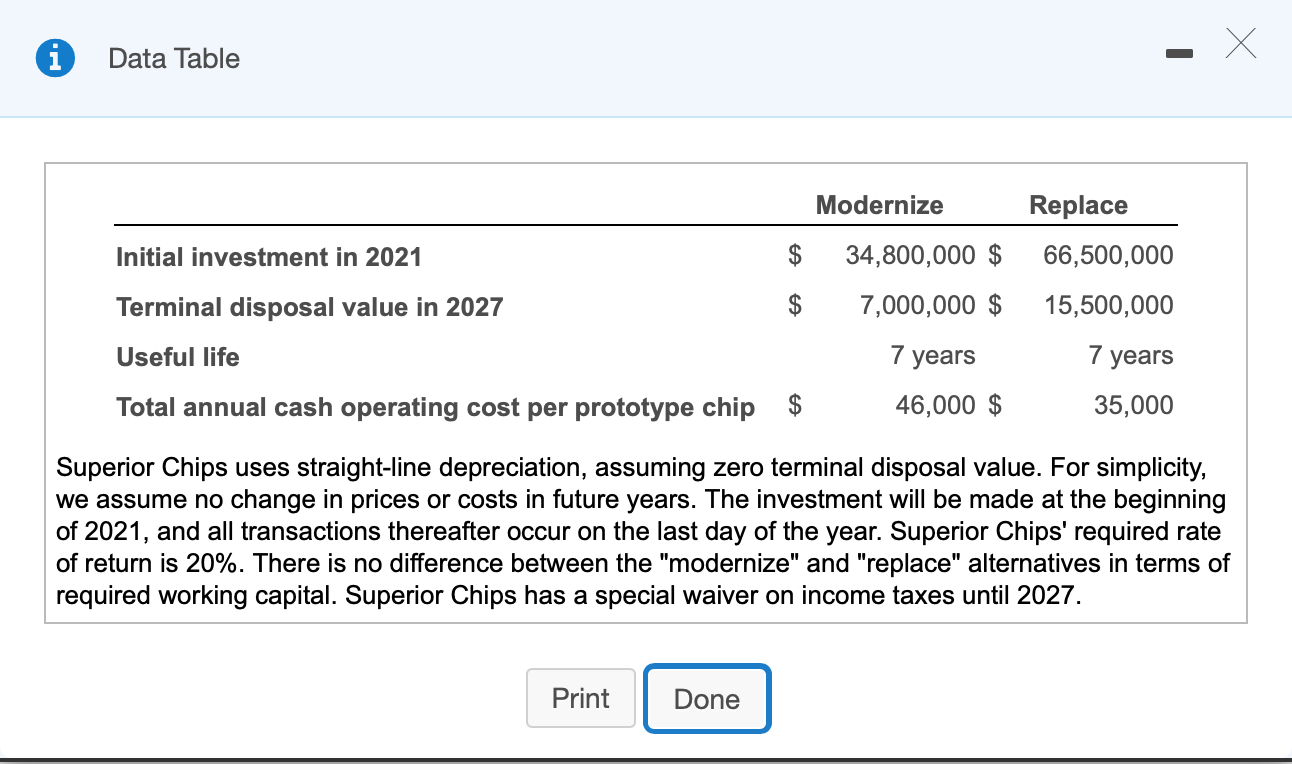
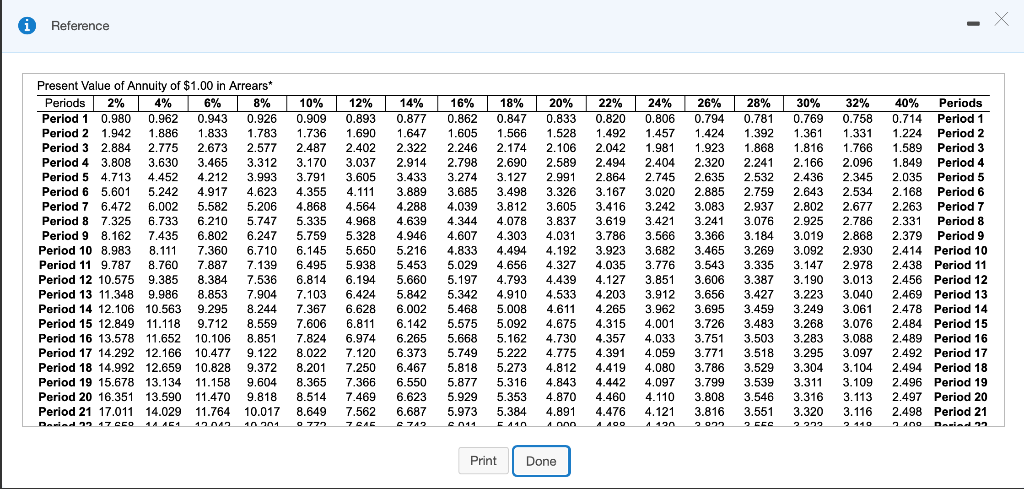
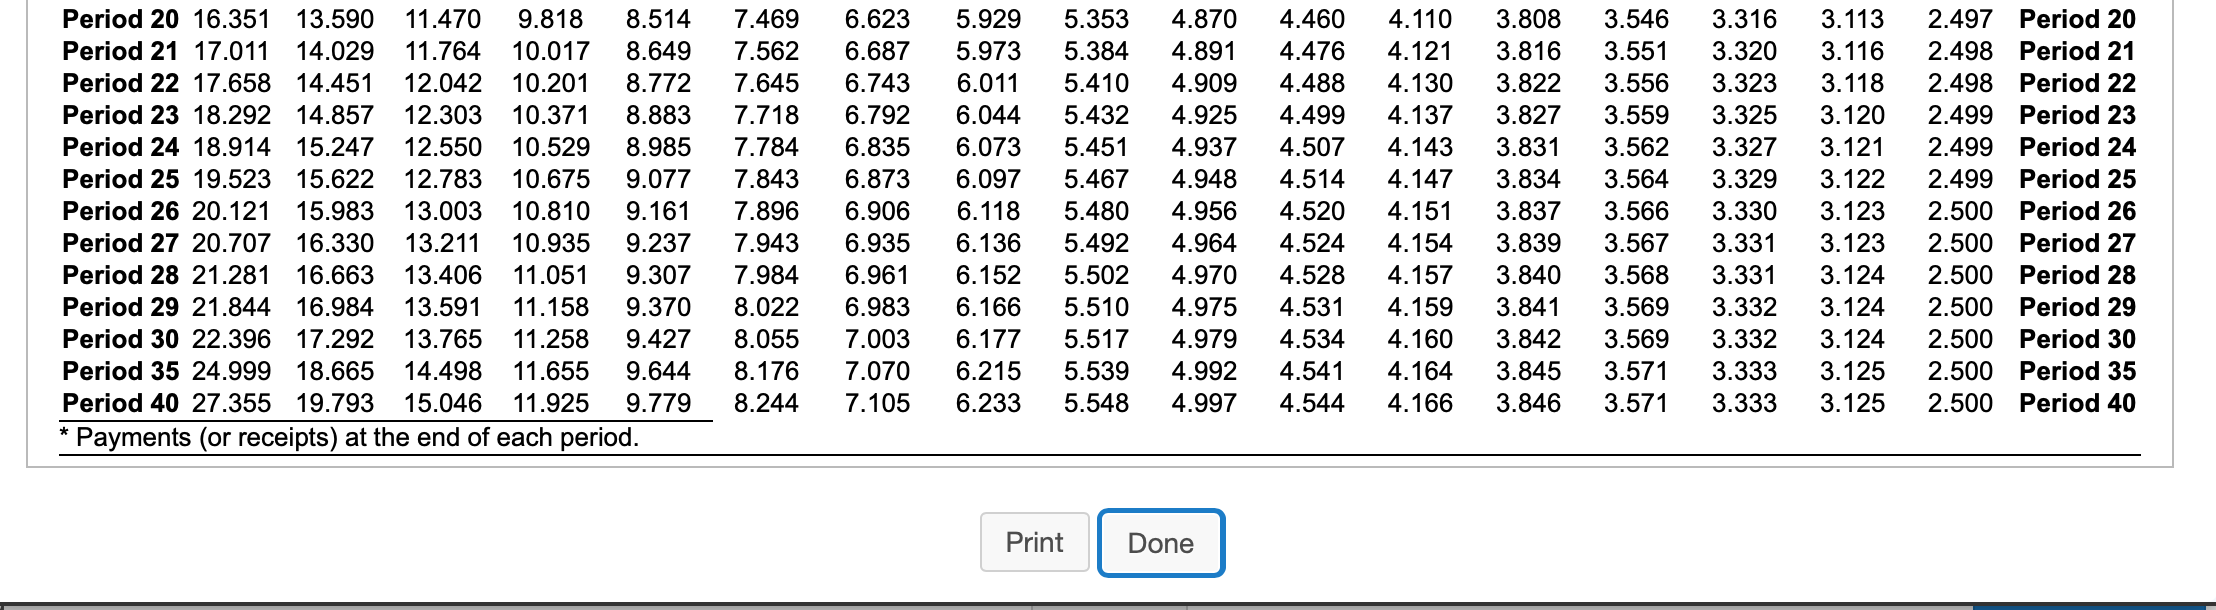
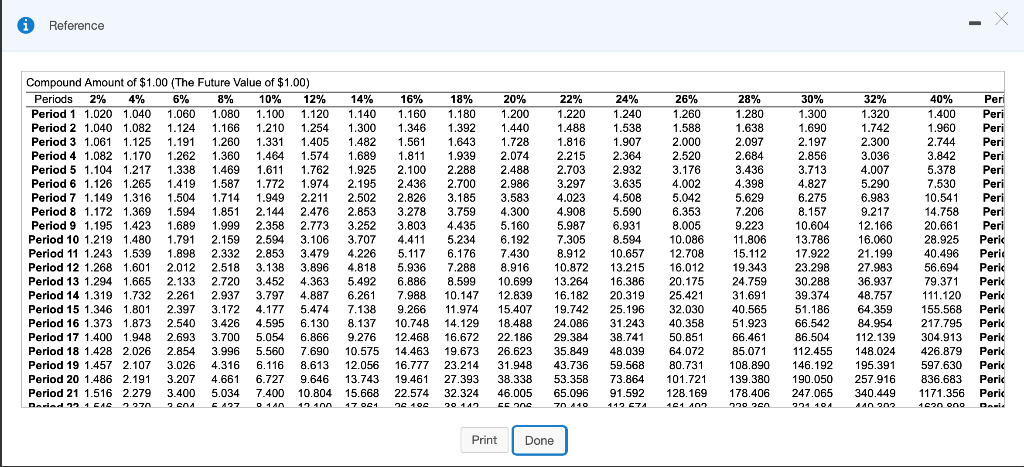
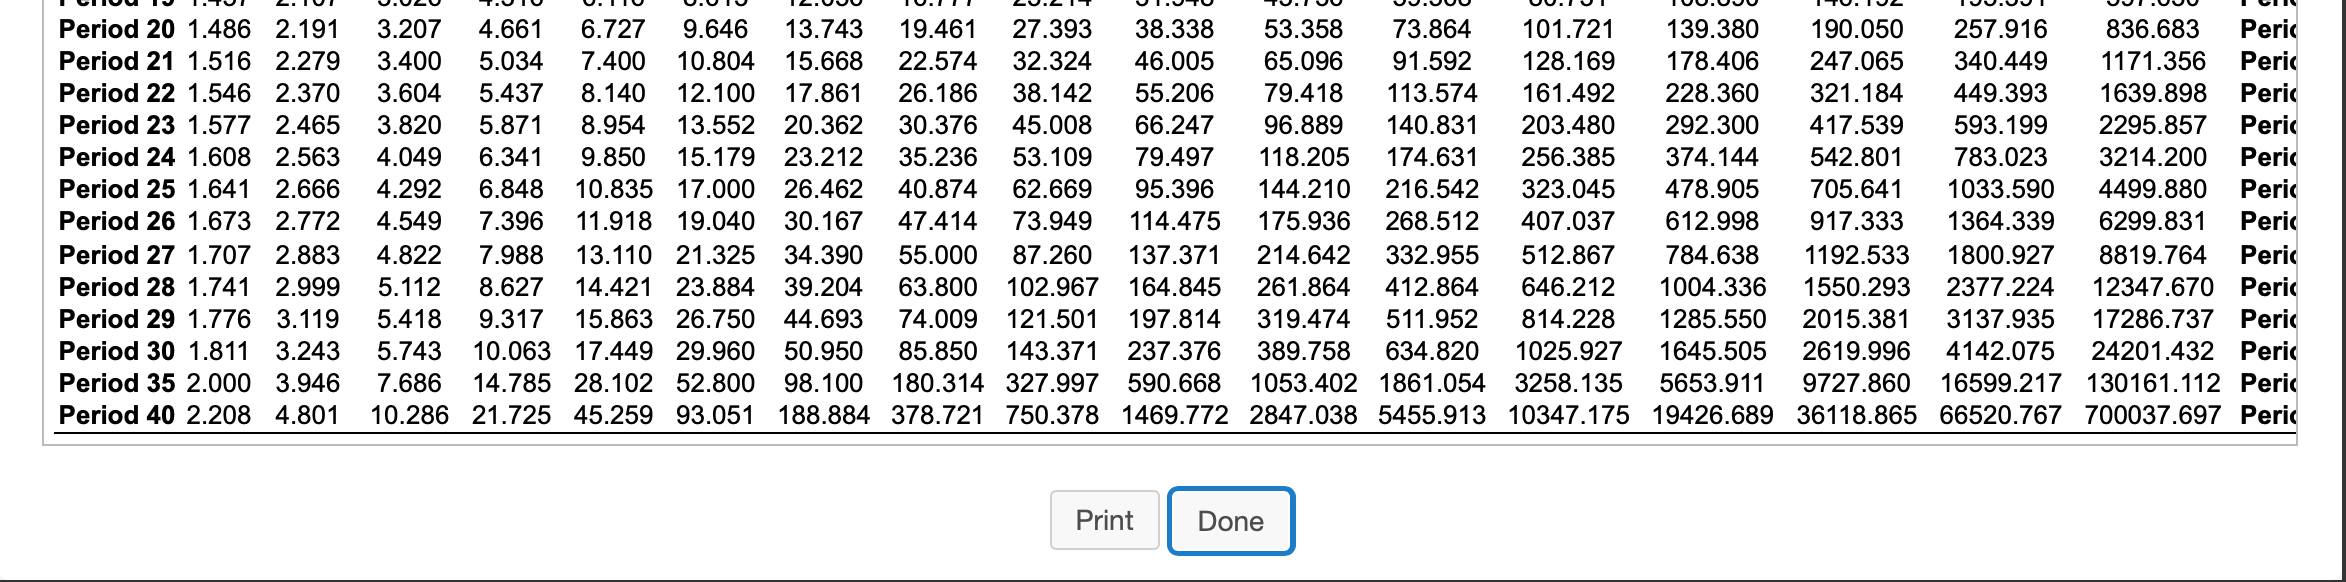
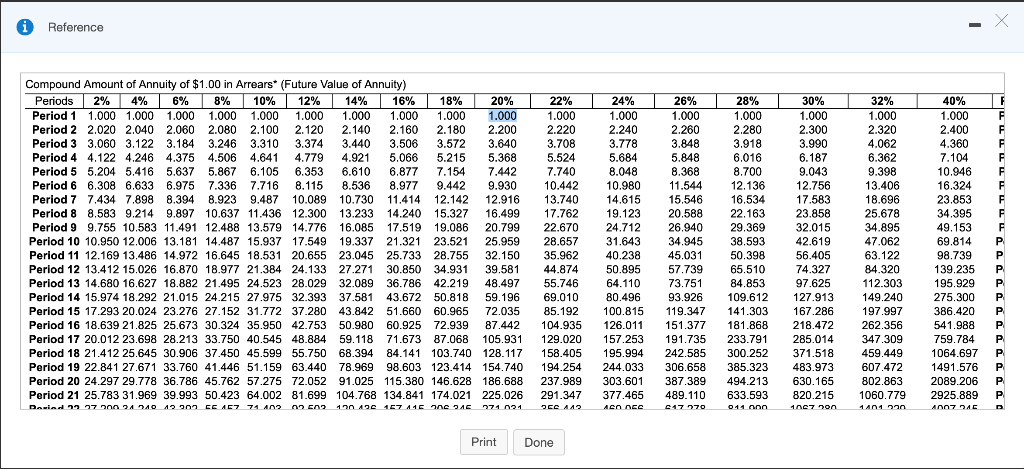
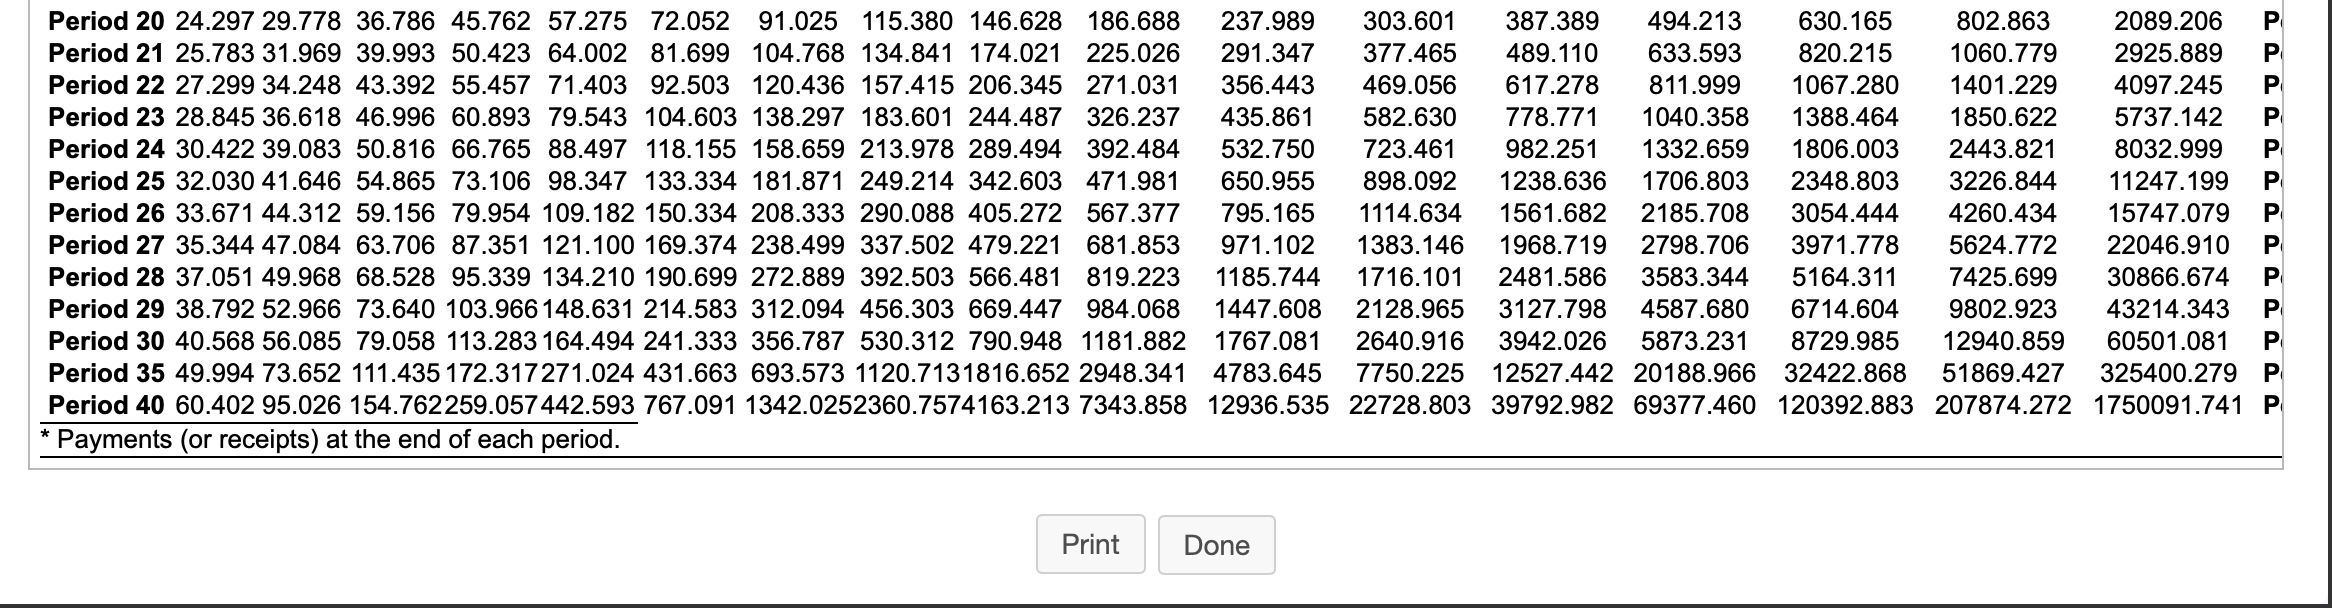
Superior Chips is a manufacturer of prototype chips based in Dublin, Ireland. Next year, in 2021, Superior Chips expects to deliver 555 prototype chips at an average price of $62,000. Superior Chips' marketing vice president forecasts growth of 70 prototype chips per year through 2027. That is, demand will be 555 in 2021, 625 in 2022, 695 in 2023, and so on. (Click the icon to view additional information.) The following data on the two options are available: Click the icon to view the data on the two options available and additional information.) Present Value of $1 table Present Value of Annuity of $1 table Future Value of $1 table Future Value of Annuity of $1 table Read the requirements. X More Info - The plant cannot produce more than 535 prototype chips annually. To meet future demand, Superior Chips must either modernize the plant or replace it. The old equipment is fully depreciated and can be sold for $4,200,000 if the plant is replaced. If the plant is modernized, the costs to modernize it are to be capitalized and depreciated over the useful life of the modernized plant. The old equipment is retained as part of the "modernize" alternative. Print Done X Data Table - Modernize Replace 66,500,000 Initial investment in 2021 $ 34,800,000 $ 7,000,000 $ Terminal disposal value in 2027 15,500,000 Useful life 7 years 7 years Total annual cash operating cost per prototype chip $ 46,000 $ 35,000 Superior Chips uses straight-line depreciation, assuming zero terminal disposal value. For simplicity, we assume no change in prices or costs in future years. The investment will be made at the beginning of 2021, and all transactions thereafter occur on the last day of the year. Superior Chips' required rate of return is 20%. There is no difference between the "modernize" and "replace" alternatives in terms of required working capital. Superior Chips has a special waiver on income taxes until 2027. Print Done 0 X Reference Present Value of $1 Periods 2% Period 1 0.980 Period 2 0.961 Period 3 0.942 Period 4 0.924 Period 5 0.906 Period 6 0.888 Period 7 0.871 Period 8 0.853 Period 9 0.837 Period 10 0.820 Period 11 0.804 Period 12 0.788 Period 13 0.773 Period 14 0.758 Period 15 0.743 Period 16 0.728 Period 17 0.714 Period 18 0.700 Period 19 0.686 Period 20 0.673 Period 21 0.660 Deiad C17 4% 0.962 0.925 0.889 0.855 0.822 0.790 0.760 0.731 0.703 0.676 0.650 0.625 0.601 0.577 0.555 0.534 0.513 0.494 0.475 0.456 0.439 6% 0.943 0.890 0.840 0.792 0.747 0.705 0.665 0.627 0.592 0.558 0.527 0.497 0.469 0.442 0.417 0.394 0.371 0.350 0.331 0.312 0.294 8% 0.926 0.857 0.794 0.735 0.681 0.630 0.583 0.540 0.500 0.463 0.429 0.397 0.368 0.340 0.315 0.292 0.270 0.250 0.232 0.215 0.199 n 104 10% 0.909 0.826 0.751 0.683 0.621 0.564 0.513 0.467 0.424 0.386 0.350 0.319 0.290 0.263 0.239 0.218 0.198 0.180 0.164 0.149 0.135 A473 12% 0.893 0.797 0.712 0.636 0.567 0.507 0.452 0.404 0.361 0.322 0.287 0.257 0.229 0.205 0.183 0.163 0.146 0.130 0.116 0.104 0.093 nn02 14% 0.877 0.769 0.675 0.592 0.519 0.456 0.400 0.351 0.308 0.270 0.237 0.208 0.182 0.160 0.140 0.123 0.108 0.095 0.083 0.073 0.064 ACC 16% 0.862 0.743 0.641 0.552 0.476 0.410 0.354 0.305 0.263 0.227 0.195 0.168 0.145 0.125 0.108 0.093 0.080 0.069 0.060 0.051 0.044 nn20 18% 0.847 0.718 0.609 0.516 0.437 0.370 0.314 0.266 0.225 0.191 0.162 0.137 0.116 0.099 0.084 0.071 0.060 0.051 0.043 0.037 0.031 nane 20% 0.833 0.694 0.579 0.482 0.402 0.335 0.279 0.233 0.194 0.162 0.135 0.112 0.093 0.078 0.065 0.054 0.045 0.038 0.031 0.026 0.022 A010 22% 0.820 0.672 0.551 0.451 0.370 0.303 0.249 0.204 0.167 0.137 0.112 0.092 0.075 0.062 0.051 0.042 0.034 0.028 0.023 0.019 0.015 n04 24% 0.806 0.650 0.524 0.423 0.341 0.275 0.222 0.179 0.144 0.116 0.094 0.076 0.061 0.049 0.040 0.032 0.026 0.021 0.017 0.014 0.011 A Ann 26% 0.794 0.630 0.500 0.397 0.315 0.250 0.198 0.157 0.125 0.099 0.079 0.062 0.050 0.039 0.031 0.025 0.020 0.016 0.012 0.010 0.008 non 28% 0.781 0.610 0.477 0.373 0.291 0.227 0.178 0.139 0.108 0.085 0.066 0.052 0.040 0.032 0.025 0.019 0.015 0.012 0.009 0.007 0.006 004 30% 0.769 0.592 0.455 0.350 0.269 0.207 0.159 0.123 0.094 0.073 0.056 0.043 0.033 0.025 0.020 0.015 0.012 0.009 0.007 0.005 0.004 0002 32% 0.758 0.574 0.435 0.329 0.250 0.189 0.143 0.108 0.082 0.062 0.047 0.036 0.027 0.021 0.016 0.012 0.009 0.007 0.005 0.004 0.003 non 40% Periods 0.714 Period 1 0.510 Period 2 0.364 Period 3 0.260 Period 4 0.186 Period 5 0.133 Period 6 0.095 Period 7 0.068 Period 8 0.048 Period 9 0.035 Period 10 0.025 Period 11 0.018 Period 12 0.013 Period 13 0.009 Period 14 0.006 Period 15 0.005 Period 16 0.003 Period 17 0.002 Period 18 0.002 Period 19 0.001 Period 20 0.001 Period 21 AA David Print Done Period 20 0.673 Period 21 0.660 Period 22 0.647 Period 23 0.634 Period 24 0.622 Period 25 0.610 Period 26 0.598 Period 27 0.586 Period 28 0.574 Period 29 0.563 Period 30 0.552 Period 35 0.500 Period 40 0.453 0.456 0.439 0.422 0.406 0.390 0.375 0.361 0.347 0.333 0.321 0.308 0.253 0.208 0.312 0.294 0.278 0.262 0.247 0.233 0.220 0.207 0.196 0.185 0.174 0.130 0.097 0.215 0.199 0.184 0.170 0.158 0.146 0.135 0.125 0.116 0.107 0.099 0.068 0.046 0.149 0.135 0.123 0.112 0.102 0.092 0.084 0.076 0.069 0.063 0.057 0.036 0.022 0.104 0.093 0.083 0.074 0.066 0.059 0.053 0.047 0.042 0.037 0.033 0.019 0.011 0.073 0.064 0.056 0.049 0.043 0.038 0.033 0.029 0.026 0.022 0.020 0.010 0.005 0.051 0.044 0.038 0.033 0.028 0.024 0.021 0.018 0.016 0.014 0.012 0.006 0.003 0.037 0.031 0.026 0.022 0.019 0.016 0.014 0.011 0.010 0.008 0.007 0.003 0.001 0.026 0.022 0.018 0.015 0.013 0.010 0.009 0.007 0.006 0.005 0.004 0.002 0.001 0.019 0.015 0.013 0.010 0.008 0.007 0.006 0.005 0.004 0.003 0.003 0.001 0.000 0.014 0.011 0.009 0.007 0.006 0.005 0.004 0.003 0.002 0.002 0.002 0.001 0.000 0.010 0.008 0.006 0.005 0.004 0.003 0.002 0.002 0.002 0.001 0.001 0.000 0.000 0.007 0.006 0.004 0.003 0.003 0.002 0.002 0.001 0.001 0.001 0.001 0.000 0.000 0.005 0.004 0.003 0.002 0.002 0.001 0.001 0.001 0.001 0.000 0.000 0.000 0.000 0.004 0.003 0.002 0.002 0.001 0.001 0.001 0.001 0.000 0.000 0.000 0.000 0.000 0.001 Period 20 0.001 Period 21 0.001 Period 22 0.000 Period 23 0.000 Period 24 0.000 Period 25 0.000 Period 26 0.000 Period 27 0.000 Period 28 0.000 Period 29 0.000 Period 30 0.000 Period 35 0.000 Period 40 Print Done i Reference 14% Present Value of Annuity of $1.00 in Arrears* Periods 2% 4% 6% 8% Period 1 0.980 0.962 0.943 0.926 Period 2 1.942 1.886 1.833 1.783 Period 3 2.884 2.775 2.673 2.577 Period 4 3.808 3.630 3.465 3.312 Period 5 4.713 4.452 4.212 3.993 Period 6 5.601 5.242 4.917 4.623 Period 7 6.472 6.002 5.582 5.206 Period 8 7.325 6.733 6.210 5.747 Period 9 8.162 7.435 6.802 6.247 Period 10 8.983 8.111 7.360 6.710 Period 11 9.787 8.760 7.887 7.139 Period 12 10.575 9.385 8.384 7.536 Period 13 11.348 9.986 8.853 7.904 Period 14 12.106 10.563 9.295 8.244 Period 15 12.849 11.118 9.712 8.559 Period 16 13.578 11.652 10.106 8.851 Period 17 14.292 12.166 10.477 9.122 Period 18 14.992 12.659 10.828 9.372 Period 19 15.678 13.134 11.158 9.604 Period 20 16.351 13.590 11.470 9.818 Period 21 17.011 14.029 11.764 10.017 Davied 22 17 CEO 14461 10% 12% 0.909 0.893 1.736 1.690 2.487 2.402 3.170 3.037 3.791 3.605 4.355 4.111 4.868 4.564 5.335 4.968 5.759 5.328 6.145 5.650 6.495 5.938 6.814 6.194 7.103 6.424 7.367 6.628 7.606 6.811 7.824 6.974 8.022 7.120 8.201 7.250 8.365 7.366 8.514 7.469 8.649 7.562 077) 7 64: 0.877 1.647 2.322 2.914 3.433 3.889 4.288 4.639 4.946 5.216 5.453 5.660 5.842 6.002 6.142 6.265 6.373 6.467 6.550 6.623 6.687 C 16% 0.862 1.605 2.246 2.798 3.274 3.685 4.039 4.344 4.607 4.833 5.029 5.197 5.342 5.468 5.575 5.668 5.749 5.818 5.877 5.929 5.973 18% 0.847 1.566 2.174 2.690 3.127 3.498 3.812 4.078 4.303 4.494 4.656 4.793 4.910 5.008 5.092 5.162 5.222 5.273 5.316 5.353 5.384 C110 20% 0.833 1.528 2.106 2.589 2.991 3.326 3.605 3.837 4.031 4.192 4.327 4.439 4.533 4.611 4.675 4.730 4.775 4.812 4.843 4.870 4.891 22% 0.820 1.492 2.042 2.494 2.864 3.167 3.416 3.619 3.786 3.923 4.035 4.127 4.203 4.265 4.315 4.357 4.391 4.419 4.442 4.460 4.476 4 400 24% 0.806 1.457 1.981 2.404 2.745 3.020 3.242 3.421 3.566 3.682 3.776 3.851 3.912 3.962 4.001 4.033 4.059 4.080 4.097 4.110 4.121 1420 26% 0.794 1.424 1.923 2.320 2.635 2.885 3.083 3.241 3.366 3.465 3.543 3.606 3.656 3.695 3.726 3.751 3.771 3.786 3.799 3.808 3.816 28% 0.781 1.392 1.868 2.241 2.532 2.759 2.937 3.076 3.184 3.269 3.335 3.387 3.427 3.459 3.483 3.503 3.518 3.529 3.539 3.546 3.551 2 CEC 30% 0.769 1.361 1.816 2.166 2.436 2.643 2.802 2.925 3.019 3.092 3.147 3.190 3.223 3.249 3.268 3.283 3.295 3.304 3.311 3.316 3.320 32% 0.758 1.331 1.766 2.096 2.345 2.534 2.677 2.786 2.868 2.930 2.978 3.013 3.040 3.061 3.076 3.088 3.097 3.104 3.109 3.113 3.116 3110 40% Periods 0.714 Period 1 1.224 Period 2 1.589 Period 3 1.849 Period 4 2.035 Period 5 2.168 Period 6 2.263 Period 7 2.331 Period 8 2.379 Period 9 2.414 Period 10 2.438 Period 11 2.456 Period 12 2.469 Period 13 2.478 Period 14 2.484 Period 15 2.489 Period 16 2.492 Period 17 2.494 Period 18 2.496 Period 19 2.497 Period 20 2.498 Period 21 Davind en 44 2017 100 Print Done Period 20 16.351 13.590 11.470 9.818 8.514 Period 21 17.011 14.029 11.764 10.017 8.649 Period 22 17.658 14.451 12.042 10.201 8.772 Period 23 18.292 14.857 12.303 10.371 8.883 Period 24 18.914 15.247 12.550 10.529 8.985 Period 25 19.523 15.622 12.783 10.675 9.077 Period 26 20.121 15.983 13.003 10.810 9.161 Period 27 20.707 16.330 13.211 10.935 9.237 Period 28 21.281 16.663 13.406 11.051 9.307 Period 29 21.844 16.984 13.591 11.158 9.370 Period 30 22.396 17.292 13.765 11.258 9.427 Period 35 24.999 18.665 14.498 11.655 9.644 Period 40 27.355 19.793 15.046 11.925 9.779 Payments (or receipts) at the end of each period. 7.469 7.562 7.645 7.718 7.784 7.843 7.896 7.943 7.984 8.022 8.055 8.176 8.244 6.623 6.687 6.743 6.792 6.835 6.873 6.906 6.935 6.961 6.983 7.003 7.070 7.105 5.929 5.973 6.011 6.044 6.073 6.097 6.118 6.136 6.152 6.166 6.177 6.215 6.233 5.353 5.384 5.410 5.432 5.451 5.467 5.480 5.492 5.502 5.510 5.517 5.539 5.548 4.870 4.891 4.909 4.925 4.937 4.948 4.956 4.964 4.970 4.975 4.979 4.992 4.997 4.460 4.476 4.488 4.499 4.507 4.514 4.520 4.524 4.528 4.531 4.534 4.541 4.544 4.110 4.121 4.130 4.137 4.143 4.147 4.151 4.154 4.157 4.159 4.160 4.164 4.166 3.808 3.816 3.822 3.827 3.831 3.834 3.837 3.839 3.840 3.841 3.842 3.845 3.846 3.546 3.551 3.556 3.559 3.562 3.564 3.566 3.567 3.568 3.569 3.569 3.571 3.571 3.316 3.320 3.323 3.325 3.327 3.329 3.330 3.331 3.331 3.332 3.332 3.333 3.333 3.113 3.116 3.118 3.120 3.121 3.122 3.123 3.123 3.124 3.124 3.124 3.125 3.125 2.497 Period 20 2.498 Period 21 2.498 Period 22 2.499 Period 23 2.499 Period 24 2.499 Period 25 2.500 Period 26 2.500 Period 27 2.500 Period 28 2.500 Period 29 2.500 Period 30 2.500 Period 35 2.500 Period 40 Print Done Reference Compound Amount of $1.00 (The Future Value of $1.00) Periods 2% 4% 6% 8% 10% 12% Period 1 1.020 1.040 1.060 1.080 1.100 1.120 Period 2 1.040 1.082 1.124 1.166 1.210 1.254 Period 3 1.061 1.125 1.191 1.260 1.331 1.405 Period 4 1.082 1.170 1.262 1.360 1.464 1.574 Period 5 1.104 1.217 1.338 1.469 1.611 1.762 Period 6 1.126 1.265 1.419 1.587 1.772 1.974 Period 7 1.149 1.316 1.504 1.714 1.949 2.211 Period 8 1.172 1.369 1.594 1.851 2.144 2.476 Period 9 1.195 1.423 1.689 1.999 2.358 2.773 Period 10 1.219 1.480 1.791 2.159 2.594 3.106 Period 11 1.243 1.539 1.898 2.332 2.853 3.479 Period 12 1.268 1.601 2.012 2.518 3.138 3.896 Period 13 1.294 1.665 2.133 2.720 3.452 4.363 Period 14 1.319 1.732 2.261 2.937 3.797 4.887 Period 15 1.346 1.801 2.397 3.172 4.177 5.474 Period 16 1.373 1.873 2.540 3.426 4.595 6.130 Period 17 1.400 1.948 2.693 3.700 5.054 6.866 Period 18 1.428 2.026 2.854 3.996 5.560 7.690 Period 19 1.457 2.107 3.026 4.316 6.116 8.613 Period 20 1.486 2.191 3.207 4.661 6.727 9.646 Period 21 1.516 2.279 3.400 5.034 7.400 10.804 Davind 21 CAC 7270 CAA C427 O AN 47100 14% 1.140 1.300 1.482 1.689 1.925 2.195 2.502 2.853 3.252 3.707 4.226 4.818 5.492 6.261 7.138 8.137 9.276 10.575 12.056 13.743 15.668 17 OR 16% 1.160 1.346 1.561 1.811 2.100 2.436 2.826 3.278 3.803 4.411 5.117 5.936 6.886 7.988 9.266 10.748 12.468 14.463 16.777 19.461 22.574 20 40C 18% 1.180 1.392 1.643 1.939 2.288 2.700 3.185 3.759 4.435 5.234 6.176 7.288 8.599 10.147 11.974 14.129 16.672 19.673 23.214 27.393 32.324 20% 1.200 1.440 1.728 2.074 2.488 2.986 3.583 4.300 5.160 6.192 7.430 8.916 10.699 12.839 15,407 18.488 22.186 26.623 31.948 38.338 46.005 CC 200 22% 1.220 1.488 1.816 2.215 2.703 3.297 4.023 4.908 5.987 7.305 8.912 10.872 13.264 16.182 19.742 24.086 29.384 35.849 43.736 53.358 65.096 70 440 24% 1.240 1.538 1.907 2.364 2.932 3.635 4.508 5.590 6.931 8.594 10.657 13.215 16.386 20.319 25.196 31.243 38.741 48.039 59.568 73.864 91.592 112 CZA 26% 1.260 1.588 2.000 2.520 3.176 4.002 5.042 6.353 8.005 10.086 12.708 16.012 20.175 25.421 32.030 40.358 50.851 64.072 80.731 101.721 128.169 101 28% 1.280 1.638 2.097 2.684 3.436 4.398 5.629 7.206 9.223 11.806 15.112 19.343 24.759 31.691 40.565 51.923 66.461 85.071 108.890 139.380 178.406 20 en 30% 1.300 1.690 2.197 2.856 3.713 4.827 6.275 8.157 10.604 13.786 17.922 23.298 30.288 39.374 51.186 66.542 86.504 112.455 146.192 190.050 247.065 971 404 32% 1.320 1.742 2.300 3.036 4.007 5.290 6.983 9.217 12.166 16.060 21.199 27.983 36.937 48.757 64.359 84.954 112.139 148.024 195.391 257.916 340.449 4192 40% Peri 1.400 Peri 1.960 Peri 2.744 Peri 3.842 Peri 5.378 Peri 7.530 Peri 10.541 Peri 14.758 Peri 20.661 Peri 28.925 Peric 40.496 Peric 56.694 Peric 79.371 Peric 111.120 Peric 155.568 Peri 217.795 Peric 304.913 Peric 426.879 Peric 597.630 Peric 836,683 Peric 1171.356 Peric 4020 000 2011 Print Done Period 20 1.486 2.191 Period 21 1.516 2.279 Period 22 1.546 2.370 Period 23 1.577 2.465 Period 24 1.608 2.563 Period 25 1.641 2.666 Period 26 1.673 2.772 Period 27 1.707 2.883 Period 28 1.741 2.999 Period 29 1.776 3.119 Period 30 1.811 3.243 Period 35 2.000 3.946 Period 40 2.208 4.801 3.207 4.661 6.727 9.646 13.743 19.461 27.393 38.338 53.358 73.864 101.721 139.380 190.050 257.916 836.683 Peric 3.400 5.034 7.400 10.804 15.668 22.574 32.324 46.005 65.096 91.592 128.169 178.406 247.065 340.449 1171.356 Peric 3.604 5.437 8.140 12.100 17.861 26.186 38.142 55.206 79.418 113.574 161.492 228.360 321.184 449.393 1639.898 Peric 3.820 5.871 8.954 13.552 20.362 30.376 45.008 66.247 96.889 140.831 203.480 292.300 417.539 593.199 2295.857 Peric 4.049 6.341 9.850 15.179 23.212 35.236 53.109 79.497 118.205 174.631 256.385 374.144 542.801 783.023 3214.200 Peric 4.292 6.848 10.835 17.000 26.462 40.874 62.669 95.396 144.210 216.542 323.045 478.905 705.641 1033.590 4499.880 Peric 4.549 7.396 11.918 19.040 30.167 47.414 73.949 114.475 175.936 268.512 407.037 612.998 917.333 1364.339 6299.831 Peric 4.822 7.988 13.110 21.325 34.390 55.000 87.260 137.371 214.642 332.955 512.867 784.638 1192.533 1800.927 8819.764 Peric 5.112 8.627 14.421 23.884 39.204 63.800 102.967 164.845 261.864 412.864 646.212 1004.336 1550.293 2377.224 12347.670 Peric 5.418 9.317 15.863 26.750 44.693 74.009 121.501 197.814 319.474 511.952 814.228 1285.550 2015.381 3137.935 17286.737 Peric 5.743 10.063 17.449 29.960 50.950 85.850 143.371 237.376 389.758 634.820 1025.927 1645.505 2619.996 4142.075 24201.432 Peric 7.686 14.785 28.102 52.800 98.100 180.314 327.997 590.668 1053.402 1861.054 3258.135 5653.911 9727.860 16599.217 130161.112 Peric 10.286 21.725 45.259 93.051 188.884 378.721 750.378 1469.772 2847.038 5455.913 10347.175 19426.689 36118.865 66520.767 700037.697 Peric Print Done X Reference F 8.115 Compound Amount of Annuity of $1.00 in Arrears* (Future Value of Annuity) Periods 2% 4% 6% 8% 10% 12% 14% 16% 18% 20% Period 1 1.000 1.000 1.000 1.000 1.000 1.000 1.000 1.000 1.000 1.000 Period 2 2.020 2.040 2.060 2.080 2.100 2.120 2.140 2.160 2.180 2.200 Period 3 3.060 3.122 3.184 3.246 3.310 3.374 3.440 3.506 3.572 3.640 Period 4 4.122 4.246 4.375 4.506 4.641 4.779 4.921 5.066 5.215 5.368 Period 5 5.204 5.416 5.637 5.867 6.105 6.353 6.610 6.877 7.154 7.442 Period 6 6.308 6.633 6.975 7.336 7.716 8.536 8.977 9.442 9.930 Period 7 7.434 7.898 8.394 8.923 9.487 10.089 10.730 11.414 12.142 12.916 Period 8 8.583 9.214 9.897 10.637 11.436 12.300 13.233 14.240 15.327 16.499 Period 9 9.755 10.583 11.491 12.488 13.579 14.776 16.085 17.519 19.086 20.799 Period 10 10.950 12.006 13.181 14.487 15.937 17.549 19.337 21.321 23.521 25.959 Period 11 12.169 13.486 14.972 16.645 18.531 20.655 23.045 25.733 28.755 32.150 Period 12 13.412 15.026 16.870 18.977 21.384 24.133 27.271 30.850 34.931 39.581 Period 13 14.680 16.627 18.882 21.495 24.523 28.029 32.089 36.786 42.219 48.497 Period 14 15.974 18.292 21.015 24.215 27.975 32.393 37.581 43.672 50.818 59.196 Period 15 17.293 20.024 23.276 27.152 31.772 37.280 43.842 51.660 51.660 60.965 72.035 Period 16 18.639 21.825 25.673 30.324 35.950 42.753 50.980 60.925 72.939 87.442 Period 17 20.012 23.698 28.213 33.750 40.545 48.884 59.118 71.673 87.068 105.931 Period 18 21.412 25.645 30.906 37.450 45.599 55.750 68.394 84.141 103.740 128.117 Period 19 22.841 27.671 33.760 41.446 51.159 63.440 78.969 98.603 123.414 154.740 Period 20 24.297 29.778 36.786 45.762 57.275 72.052 91.025 115.380 146.628 186.688 Period 21 25.783 31.969 39.993 50.423 64.002 81.699 104.768 134.841 174.021 225.026 Dorind 17 77 20 21 210 12 207 CC 167 71 402 00 02 170 120 167 16 nc C 215 271 021 22% 1.000 2.220 3.708 5.524 7.740 10.442 13.740 17.762 22.670 28.657 35.962 44.874 55.746 69.010 85.192 104.935 129.020 158.405 194.254 237.989 291.347 250 142 24% 1.000 2.240 3.778 5.684 8.048 10.980 14.615 19.123 24.712 31.643 40.238 50.895 64.110 80.496 100.815 126.011 157.253 195.994 244.033 303.601 377.465 AC NEC 26% 1.000 2.260 3.848 5.848 8.368 11.544 15.546 20.588 26.940 34.945 45.031 57.739 73.751 93.926 119.347 151.377 191.735 242.585 306.658 387.389 489.110 28% 1.000 2.280 3.918 6.016 8.700 12.136 16.534 22.163 29.369 38.593 50.398 65,510 84.853 109.612 141.303 181.868 233.791 300.252 385.323 494.213 633.593 011 nnn 30% 1.000 2.300 3.990 6.187 9.043 12.756 17.583 23.858 32.015 42.619 56.405 74.327 97.625 127.913 167.286 218.472 285.014 371.518 483.973 630.165 820.215 1007 on 32% 1.000 2.320 4.062 6.362 9.398 13.406 18.696 25.678 34.895 47.062 63.122 84.320 112.303 149.240 197.997 262.356 347.309 459.449 607.472 802.863 1060.779 40% 1.000 2.400 4.360 7.104 10.946 16.324 23.853 34.395 49.153 69.814 98.739 139.235 195.929 275.300 386.420 541.988 759.784 1064.697 1491.576 2089.206 2925.889 A107 10 F F F F F F F F F P P P P P P P P P P P P E47 4A04 Print Done Period 20 24.297 29.778 36.786 45.762 57.275 72.052 91.025 115.380 146.628 186.688 237.989 303.601 387.389 494.213 630.165 802.863 2089.206 P Period 21 25.783 31.969 39.993 50.423 64.002 81.699 104.768 134.841 174.021 225.026 291.347 377.465 489.110 633.593 820.215 1060.779 2925.889 P Period 22 27.299 34.248 43.392 55.457 71.403 92.503 120.436 157.415 206.345 271.031 356.443 469.056 617.278 811.999 1067.280 1401.229 4097.245 P Period 23 28.845 36.618 46.996 60.893 79.543 104.603 138.297 183.601 244.487 326.237 435.861 582.630 778.771 1040.358 1388.464 1850.622 5737.142 P Period 24 30.422 39.083 50.816 66.765 88.497 118.155 158.659 213.978 289.494 392.484 532.750 723.461 982.251 1332.659 1806.003 2443.821 8032.999 P Period 25 32.030 41.646 54.865 73.106 98.347 133.334 181.871 249.214 342.603 471.981 650.955 898.092 1238.636 1706.803 2348.803 3226.844 11247.199 P Period 26 33.671 44.312 59.156 79.954 109.182 150.334 208.333 290.088 405.272 567.377 795.165 1114.634 1561.682 2185.708 3054.444 4260.434 15747.079 P Period 27 35.344 47.084 63.706 87.351 121.100 169.374 238.499 337.502 479.221 681.853 971.102 1383.146 1968.719 2798.706 3971.778 5624.772 22046.910 P Period 28 37.051 49.968 68.528 95.339 134.210 190.699 272.889 392.503 566.481 819.223 1185.744 1716.101 2481.586 3583.344 5164.311 7425.699 30866.674 P Period 29 38.792 52.966 73.640 103.966 148.631 214.583 312.094 456.303 669.447 984.068 1447.608 2128.965 3127.798 4587.680 6714.604 9802.923 43214.343 P Period 30 40.568 56.085 79.058 113.283 164.494 241.333 356.787 530.312 790.948 1181.882 1767.081 2640.916 3942.026 5873.231 8729.985 12940.859 60501.081 P Period 35 49.994 73.652 111.435 172.317271.024 431.663 693.573 1120.7131816.652 2948.341 4783.645 7750.225 12527.442 20188.966 32422.868 51869.427 325400.279 P Period 40 60.402 95.026 154.762259.057442.593 767.091 1342.0252360.7574163.213 7343.858 12936.535 22728.803 39792.982 69377.460 120392.883 207874.272 1750091.741 P Payments (or receipts) at the end of each period. Onani anaan Print Done i X Requirements 1. Calculate the cash inflows and outflows of the "modernize" and "replace" alternatives over the 2021 - 2027 period. 2. Calculate payback period for the "modernize" and "replace" alternatives. 3. Calculate net present value of the "modernize" and "replace" alternatives. 4. What factors should Green Chips consider in choosing between the alternatives? Print Done Requirement 1. Calculate the cash inflows and outflows of the "modernize" and "replace" alternatives over the 2021 - 2027 period. First, determine the cash inflows and outflows of the "modernize" alternative over the 2021 to 2027 period. (Use a minus sign or parentheses for a cash outflows. If an input field is not used in the table, leave that input field empty, do not enter a zero.) Units Net cash Initial Proceeds from Year sold contributions investments sale of equipment Jan 1, 2021 (34,100,000) Dec 31, 2021 540 $ 610 Dec 31, 2022 Dec 31, 2023 680 Dec 31, 2024 750 9,180,000 10,370,000 11,560,000 12,750,000 13,940,000 15,130,000 16,320,000 Dec 31, 2025 820 Dec 31, 2026 890 Dec 31, 2027 960 7,400,000 Next, determine the cash inflows and outflows of the "replace" alternative over the 2021 to 2027 period. (Use a minus sign or parentheses for a cash outflows. If an input field is not used in the table, leave that input field empty, do not enter a zero.) Units Net cash Year sold contributions Initial Proceeds from investments sale of equipment (63,800,000) $ 4,400,000 Jan 1, 2021 Dec 31, 2021 540 $ Dec 31, 2022 610 Dec 31, 2023 680 750 Dec 31, 2024 Dec 31, 2025 14,040,000 15,860,000 17,680,000 19,500,000 21,320,000 23,140,000 24,960,000 820 Dec 31, 2026 890 Dec 31, 2027 960 $ 15,500,000 Superior Chips is a manufacturer of prototype chips based in Dublin, Ireland. Next year, in 2021, Superior Chips expects to deliver 555 prototype chips at an average price of $62,000. Superior Chips' marketing vice president forecasts growth of 70 prototype chips per year through 2027. That is, demand will be 555 in 2021, 625 in 2022, 695 in 2023, and so on. (Click the icon to view additional information.) The following data on the two options are available: Click the icon to view the data on the two options available and additional information.) Present Value of $1 table Present Value of Annuity of $1 table Future Value of $1 table Future Value of Annuity of $1 table Read the requirements. X More Info - The plant cannot produce more than 535 prototype chips annually. To meet future demand, Superior Chips must either modernize the plant or replace it. The old equipment is fully depreciated and can be sold for $4,200,000 if the plant is replaced. If the plant is modernized, the costs to modernize it are to be capitalized and depreciated over the useful life of the modernized plant. The old equipment is retained as part of the "modernize" alternative. Print Done X Data Table - Modernize Replace 66,500,000 Initial investment in 2021 $ 34,800,000 $ 7,000,000 $ Terminal disposal value in 2027 15,500,000 Useful life 7 years 7 years Total annual cash operating cost per prototype chip $ 46,000 $ 35,000 Superior Chips uses straight-line depreciation, assuming zero terminal disposal value. For simplicity, we assume no change in prices or costs in future years. The investment will be made at the beginning of 2021, and all transactions thereafter occur on the last day of the year. Superior Chips' required rate of return is 20%. There is no difference between the "modernize" and "replace" alternatives in terms of required working capital. Superior Chips has a special waiver on income taxes until 2027. Print Done 0 X Reference Present Value of $1 Periods 2% Period 1 0.980 Period 2 0.961 Period 3 0.942 Period 4 0.924 Period 5 0.906 Period 6 0.888 Period 7 0.871 Period 8 0.853 Period 9 0.837 Period 10 0.820 Period 11 0.804 Period 12 0.788 Period 13 0.773 Period 14 0.758 Period 15 0.743 Period 16 0.728 Period 17 0.714 Period 18 0.700 Period 19 0.686 Period 20 0.673 Period 21 0.660 Deiad C17 4% 0.962 0.925 0.889 0.855 0.822 0.790 0.760 0.731 0.703 0.676 0.650 0.625 0.601 0.577 0.555 0.534 0.513 0.494 0.475 0.456 0.439 6% 0.943 0.890 0.840 0.792 0.747 0.705 0.665 0.627 0.592 0.558 0.527 0.497 0.469 0.442 0.417 0.394 0.371 0.350 0.331 0.312 0.294 8% 0.926 0.857 0.794 0.735 0.681 0.630 0.583 0.540 0.500 0.463 0.429 0.397 0.368 0.340 0.315 0.292 0.270 0.250 0.232 0.215 0.199 n 104 10% 0.909 0.826 0.751 0.683 0.621 0.564 0.513 0.467 0.424 0.386 0.350 0.319 0.290 0.263 0.239 0.218 0.198 0.180 0.164 0.149 0.135 A473 12% 0.893 0.797 0.712 0.636 0.567 0.507 0.452 0.404 0.361 0.322 0.287 0.257 0.229 0.205 0.183 0.163 0.146 0.130 0.116 0.104 0.093 nn02 14% 0.877 0.769 0.675 0.592 0.519 0.456 0.400 0.351 0.308 0.270 0.237 0.208 0.182 0.160 0.140 0.123 0.108 0.095 0.083 0.073 0.064 ACC 16% 0.862 0.743 0.641 0.552 0.476 0.410 0.354 0.305 0.263 0.227 0.195 0.168 0.145 0.125 0.108 0.093 0.080 0.069 0.060 0.051 0.044 nn20 18% 0.847 0.718 0.609 0.516 0.437 0.370 0.314 0.266 0.225 0.191 0.162 0.137 0.116 0.099 0.084 0.071 0.060 0.051 0.043 0.037 0.031 nane 20% 0.833 0.694 0.579 0.482 0.402 0.335 0.279 0.233 0.194 0.162 0.135 0.112 0.093 0.078 0.065 0.054 0.045 0.038 0.031 0.026 0.022 A010 22% 0.820 0.672 0.551 0.451 0.370 0.303 0.249 0.204 0.167 0.137 0.112 0.092 0.075 0.062 0.051 0.042 0.034 0.028 0.023 0.019 0.015 n04 24% 0.806 0.650 0.524 0.423 0.341 0.275 0.222 0.179 0.144 0.116 0.094 0.076 0.061 0.049 0.040 0.032 0.026 0.021 0.017 0.014 0.011 A Ann 26% 0.794 0.630 0.500 0.397 0.315 0.250 0.198 0.157 0.125 0.099 0.079 0.062 0.050 0.039 0.031 0.025 0.020 0.016 0.012 0.010 0.008 non 28% 0.781 0.610 0.477 0.373 0.291 0.227 0.178 0.139 0.108 0.085 0.066 0.052 0.040 0.032 0.025 0.019 0.015 0.012 0.009 0.007 0.006 004 30% 0.769 0.592 0.455 0.350 0.269 0.207 0.159 0.123 0.094 0.073 0.056 0.043 0.033 0.025 0.020 0.015 0.012 0.009 0.007 0.005 0.004 0002 32% 0.758 0.574 0.435 0.329 0.250 0.189 0.143 0.108 0.082 0.062 0.047 0.036 0.027 0.021 0.016 0.012 0.009 0.007 0.005 0.004 0.003 non 40% Periods 0.714 Period 1 0.510 Period 2 0.364 Period 3 0.260 Period 4 0.186 Period 5 0.133 Period 6 0.095 Period 7 0.068 Period 8 0.048 Period 9 0.035 Period 10 0.025 Period 11 0.018 Period 12 0.013 Period 13 0.009 Period 14 0.006 Period 15 0.005 Period 16 0.003 Period 17 0.002 Period 18 0.002 Period 19 0.001 Period 20 0.001 Period 21 AA David Print Done Period 20 0.673 Period 21 0.660 Period 22 0.647 Period 23 0.634 Period 24 0.622 Period 25 0.610 Period 26 0.598 Period 27 0.586 Period 28 0.574 Period 29 0.563 Period 30 0.552 Period 35 0.500 Period 40 0.453 0.456 0.439 0.422 0.406 0.390 0.375 0.361 0.347 0.333 0.321 0.308 0.253 0.208 0.312 0.294 0.278 0.262 0.247 0.233 0.220 0.207 0.196 0.185 0.174 0.130 0.097 0.215 0.199 0.184 0.170 0.158 0.146 0.135 0.125 0.116 0.107 0.099 0.068 0.046 0.149 0.135 0.123 0.112 0.102 0.092 0.084 0.076 0.069 0.063 0.057 0.036 0.022 0.104 0.093 0.083 0.074 0.066 0.059 0.053 0.047 0.042 0.037 0.033 0.019 0.011 0.073 0.064 0.056 0.049 0.043 0.038 0.033 0.029 0.026 0.022 0.020 0.010 0.005 0.051 0.044 0.038 0.033 0.028 0.024 0.021 0.018 0.016 0.014 0.012 0.006 0.003 0.037 0.031 0.026 0.022 0.019 0.016 0.014 0.011 0.010 0.008 0.007 0.003 0.001 0.026 0.022 0.018 0.015 0.013 0.010 0.009 0.007 0.006 0.005 0.004 0.002 0.001 0.019 0.015 0.013 0.010 0.008 0.007 0.006 0.005 0.004 0.003 0.003 0.001 0.000 0.014 0.011 0.009 0.007 0.006 0.005 0.004 0.003 0.002 0.002 0.002 0.001 0.000 0.010 0.008 0.006 0.005 0.004 0.003 0.002 0.002 0.002 0.001 0.001 0.000 0.000 0.007 0.006 0.004 0.003 0.003 0.002 0.002 0.001 0.001 0.001 0.001 0.000 0.000 0.005 0.004 0.003 0.002 0.002 0.001 0.001 0.001 0.001 0.000 0.000 0.000 0.000 0.004 0.003 0.002 0.002 0.001 0.001 0.001 0.001 0.000 0.000 0.000 0.000 0.000 0.001 Period 20 0.001 Period 21 0.001 Period 22 0.000 Period 23 0.000 Period 24 0.000 Period 25 0.000 Period 26 0.000 Period 27 0.000 Period 28 0.000 Period 29 0.000 Period 30 0.000 Period 35 0.000 Period 40 Print Done i Reference 14% Present Value of Annuity of $1.00 in Arrears* Periods 2% 4% 6% 8% Period 1 0.980 0.962 0.943 0.926 Period 2 1.942 1.886 1.833 1.783 Period 3 2.884 2.775 2.673 2.577 Period 4 3.808 3.630 3.465 3.312 Period 5 4.713 4.452 4.212 3.993 Period 6 5.601 5.242 4.917 4.623 Period 7 6.472 6.002 5.582 5.206 Period 8 7.325 6.733 6.210 5.747 Period 9 8.162 7.435 6.802 6.247 Period 10 8.983 8.111 7.360 6.710 Period 11 9.787 8.760 7.887 7.139 Period 12 10.575 9.385 8.384 7.536 Period 13 11.348 9.986 8.853 7.904 Period 14 12.106 10.563 9.295 8.244 Period 15 12.849 11.118 9.712 8.559 Period 16 13.578 11.652 10.106 8.851 Period 17 14.292 12.166 10.477 9.122 Period 18 14.992 12.659 10.828 9.372 Period 19 15.678 13.134 11.158 9.604 Period 20 16.351 13.590 11.470 9.818 Period 21 17.011 14.029 11.764 10.017 Davied 22 17 CEO 14461 10% 12% 0.909 0.893 1.736 1.690 2.487 2.402 3.170 3.037 3.791 3.605 4.355 4.111 4.868 4.564 5.335 4.968 5.759 5.328 6.145 5.650 6.495 5.938 6.814 6.194 7.103 6.424 7.367 6.628 7.606 6.811 7.824 6.974 8.022 7.120 8.201 7.250 8.365 7.366 8.514 7.469 8.649 7.562 077) 7 64: 0.877 1.647 2.322 2.914 3.433 3.889 4.288 4.639 4.946 5.216 5.453 5.660 5.842 6.002 6.142 6.265 6.373 6.467 6.550 6.623 6.687 C 16% 0.862 1.605 2.246 2.798 3.274 3.685 4.039 4.344 4.607 4.833 5.029 5.197 5.342 5.468 5.575 5.668 5.749 5.818 5.877 5.929 5.973 18% 0.847 1.566 2.174 2.690 3.127 3.498 3.812 4.078 4.303 4.494 4.656 4.793 4.910 5.008 5.092 5.162 5.222 5.273 5.316 5.353 5.384 C110 20% 0.833 1.528 2.106 2.589 2.991 3.326 3.605 3.837 4.031 4.192 4.327 4.439 4.533 4.611 4.675 4.730 4.775 4.812 4.843 4.870 4.891 22% 0.820 1.492 2.042 2.494 2.864 3.167 3.416 3.619 3.786 3.923 4.035 4.127 4.203 4.265 4.315 4.357 4.391 4.419 4.442 4.460 4.476 4 400 24% 0.806 1.457 1.981 2.404 2.745 3.020 3.242 3.421 3.566 3.682 3.776 3.851 3.912 3.962 4.001 4.033 4.059 4.080 4.097 4.110 4.121 1420 26% 0.794 1.424 1.923 2.320 2.635 2.885 3.083 3.241 3.366 3.465 3.543 3.606 3.656 3.695 3.726 3.751 3.771 3.786 3.799 3.808 3.816 28% 0.781 1.392 1.868 2.241 2.532 2.759 2.937 3.076 3.184 3.269 3.335 3.387 3.427 3.459 3.483 3.503 3.518 3.529 3.539 3.546 3.551 2 CEC 30% 0.769 1.361 1.816 2.166 2.436 2.643 2.802 2.925 3.019 3.092 3.147 3.190 3.223 3.249 3.268 3.283 3.295 3.304 3.311 3.316 3.320 32% 0.758 1.331 1.766 2.096 2.345 2.534 2.677 2.786 2.868 2.930 2.978 3.013 3.040 3.061 3.076 3.088 3.097 3.104 3.109 3.113 3.116 3110 40% Periods 0.714 Period 1 1.224 Period 2 1.589 Period 3 1.849 Period 4 2.035 Period 5 2.168 Period 6 2.263 Period 7 2.331 Period 8 2.379 Period 9 2.414 Period 10 2.438 Period 11 2.456 Period 12 2.469 Period 13 2.478 Period 14 2.484 Period 15 2.489 Period 16 2.492 Period 17 2.494 Period 18 2.496 Period 19 2.497 Period 20 2.498 Period 21 Davind en 44 2017 100 Print Done Period 20 16.351 13.590 11.470 9.818 8.514 Period 21 17.011 14.029 11.764 10.017 8.649 Period 22 17.658 14.451 12.042 10.201 8.772 Period 23 18.292 14.857 12.303 10.371 8.883 Period 24 18.914 15.247 12.550 10.529 8.985 Period 25 19.523 15.622 12.783 10.675 9.077 Period 26 20.121 15.983 13.003 10.810 9.161 Period 27 20.707 16.330 13.211 10.935 9.237 Period 28 21.281 16.663 13.406 11.051 9.307 Period 29 21.844 16.984 13.591 11.158 9.370 Period 30 22.396 17.292 13.765 11.258 9.427 Period 35 24.999 18.665 14.498 11.655 9.644 Period 40 27.355 19.793 15.046 11.925 9.779 Payments (or receipts) at the end of each period. 7.469 7.562 7.645 7.718 7.784 7.843 7.896 7.943 7.984 8.022 8.055 8.176 8.244 6.623 6.687 6.743 6.792 6.835 6.873 6.906 6.935 6.961 6.983 7.003 7.070 7.105 5.929 5.973 6.011 6.044 6.073 6.097 6.118 6.136 6.152 6.166 6.177 6.215 6.233 5.353 5.384 5.410 5.432 5.451 5.467 5.480 5.492 5.502 5.510 5.517 5.539 5.548 4.870 4.891 4.909 4.925 4.937 4.948 4.956 4.964 4.970 4.975 4.979 4.992 4.997 4.460 4.476 4.488 4.499 4.507 4.514 4.520 4.524 4.528 4.531 4.534 4.541 4.544 4.110 4.121 4.130 4.137 4.143 4.147 4.151 4.154 4.157 4.159 4.160 4.164 4.166 3.808 3.816 3.822 3.827 3.831 3.834 3.837 3.839 3.840 3.841 3.842 3.845 3.846 3.546 3.551 3.556 3.559 3.562 3.564 3.566 3.567 3.568 3.569 3.569 3.571 3.571 3.316 3.320 3.323 3.325 3.327 3.329 3.330 3.331 3.331 3.332 3.332 3.333 3.333 3.113 3.116 3.118 3.120 3.121 3.122 3.123 3.123 3.124 3.124 3.124 3.125 3.125 2.497 Period 20 2.498 Period 21 2.498 Period 22 2.499 Period 23 2.499 Period 24 2.499 Period 25 2.500 Period 26 2.500 Period 27 2.500 Period 28 2.500 Period 29 2.500 Period 30 2.500 Period 35 2.500 Period 40 Print Done Reference Compound Amount of $1.00 (The Future Value of $1.00) Periods 2% 4% 6% 8% 10% 12% Period 1 1.020 1.040 1.060 1.080 1.100 1.120 Period 2 1.040 1.082 1.124 1.166 1.210 1.254 Period 3 1.061 1.125 1.191 1.260 1.331 1.405 Period 4 1.082 1.170 1.262 1.360 1.464 1.574 Period 5 1.104 1.217 1.338 1.469 1.611 1.762 Period 6 1.126 1.265 1.419 1.587 1.772 1.974 Period 7 1.149 1.316 1.504 1.714 1.949 2.211 Period 8 1.172 1.369 1.594 1.851 2.144 2.476 Period 9 1.195 1.423 1.689 1.999 2.358 2.773 Period 10 1.219 1.480 1.791 2.159 2.594 3.106 Period 11 1.243 1.539 1.898 2.332 2.853 3.479 Period 12 1.268 1.601 2.012 2.518 3.138 3.896 Period 13 1.294 1.665 2.133 2.720 3.452 4.363 Period 14 1.319 1.732 2.261 2.937 3.797 4.887 Period 15 1.346 1.801 2.397 3.172 4.177 5.474 Period 16 1.373 1.873 2.540 3.426 4.595 6.130 Period 17 1.400 1.948 2.693 3.700 5.054 6.866 Period 18 1.428 2.026 2.854 3.996 5.560 7.690 Period 19 1.457 2.107 3.026 4.316 6.116 8.613 Period 20 1.486 2.191 3.207 4.661 6.727 9.646 Period 21 1.516 2.279 3.400 5.034 7.400 10.804 Davind 21 CAC 7270 CAA C427 O AN 47100 14% 1.140 1.300 1.482 1.689 1.925 2.195 2.502 2.853 3.252 3.707 4.226 4.818 5.492 6.261 7.138 8.137 9.276 10.575 12.056 13.743 15.668 17 OR 16% 1.160 1.346 1.561 1.811 2.100 2.436 2.826 3.278 3.803 4.411 5.117 5.936 6.886 7.988 9.266 10.748 12.468 14.463 16.777 19.461 22.574 20 40C 18% 1.180 1.392 1.643 1.939 2.288 2.700 3.185 3.759 4.435 5.234 6.176 7.288 8.599 10.147 11.974 14.129 16.672 19.673 23.214 27.393 32.324 20% 1.200 1.440 1.728 2.074 2.488 2.986 3.583 4.300 5.160 6.192 7.430 8.916 10.699 12.839 15,407 18.488 22.186 26.623 31.948 38.338 46.005 CC 200 22% 1.220 1.488 1.816 2.215 2.703 3.297 4.023 4.908 5.987 7.305 8.912 10.872 13.264 16.182 19.742 24.086 29.384 35.849 43.736 53.358 65.096 70 440 24% 1.240 1.538 1.907 2.364 2.932 3.635 4.508 5.590 6.931 8.594 10.657 13.215 16.386 20.319 25.196 31.243 38.741 48.039 59.568 73.864 91.592 112 CZA 26% 1.260 1.588 2.000 2.520 3.176 4.002 5.042 6.353 8.005 10.086 12.708 16.012 20.175 25.421 32.030 40.358 50.851 64.072 80.731 101.721 128.169 101 28% 1.280 1.638 2.097 2.684 3.436 4.398 5.629 7.206 9.223 11.806 15.112 19.343 24.759 31.691 40.565 51.923 66.461 85.071 108.890 139.380 178.406 20 en 30% 1.300 1.690 2.197 2.856 3.713 4.827 6.275 8.157 10.604 13.786 17.922 23.298 30.288 39.374 51.186 66.542 86.504 112.455 146.192 190.050 247.065 971 404 32% 1.320 1.742 2.300 3.036 4.007 5.290 6.983 9.217 12.166 16.060 21.199 27.983 36.937 48.757 64.359 84.954 112.139 148.024 195.391 257.916 340.449 4192 40% Peri 1.400 Peri 1.960 Peri 2.744 Peri 3.842 Peri 5.378 Peri 7.530 Peri 10.541 Peri 14.758 Peri 20.661 Peri 28.925 Peric 40.496 Peric 56.694 Peric 79.371 Peric 111.120 Peric 155.568 Peri 217.795 Peric 304.913 Peric 426.879 Peric 597.630 Peric 836,683 Peric 1171.356 Peric 4020 000 2011 Print Done Period 20 1.486 2.191 Period 21 1.516 2.279 Period 22 1.546 2.370 Period 23 1.577 2.465 Period 24 1.608 2.563 Period 25 1.641 2.666 Period 26 1.673 2.772 Period 27 1.707 2.883 Period 28 1.741 2.999 Period 29 1.776 3.119 Period 30 1.811 3.243 Period 35 2.000 3.946 Period 40 2.208 4.801 3.207 4.661 6.727 9.646 13.743 19.461 27.393 38.338 53.358 73.864 101.721 139.380 190.050 257.916 836.683 Peric 3.400 5.034 7.400 10.804 15.668 22.574 32.324 46.005 65.096 91.592 128.169 178.406 247.065 340.449 1171.356 Peric 3.604 5.437 8.140 12.100 17.861 26.186 38.142 55.206 79.418 113.574 161.492 228.360 321.184 449.393 1639.898 Peric 3.820 5.871 8.954 13.552 20.362 30.376 45.008 66.247 96.889 140.831 203.480 292.300 417.539 593.199 2295.857 Peric 4.049 6.341 9.850 15.179 23.212 35.236 53.109 79.497 118.205 174.631 256.385 374.144 542.801 783.023 3214.200 Peric 4.292 6.848 10.835 17.000 26.462 40.874 62.669 95.396 144.210 216.542 323.045 478.905 705.641 1033.590 4499.880 Peric 4.549 7.396 11.918 19.040 30.167 47.414 73.949 114.475 175.936 268.512 407.037 612.998 917.333 1364.339 6299.831 Peric 4.822 7.988 13.110 21.325 34.390 55.000 87.260 137.371 214.642 332.955 512.867 784.638 1192.533 1800.927 8819.764 Peric 5.112 8.627 14.421 23.884 39.204 63.800 102.967 164.845 261.864 412.864 646.212 1004.336 1550.293 2377.224 12347.670 Peric 5.418 9.317 15.863 26.750 44.693 74.009 121.501 197.814 319.474 511.952 814.228 1285.550 2015.381 3137.935 17286.737 Peric 5.743 10.063 17.449 29.960 50.950 85.850 143.371 237.376 389.758 634.820 1025.927 1645.505 2619.996 4142.075 24201.432 Peric 7.686 14.785 28.102 52.800 98.100 180.314 327.997 590.668 1053.402 1861.054 3258.135 5653.911 9727.860 16599.217 130161.112 Peric 10.286 21.725 45.259 93.051 188.884 378.721 750.378 1469.772 2847.038 5455.913 10347.175 19426.689 36118.865 66520.767 700037.697 Peric Print Done X Reference F 8.115 Compound Amount of Annuity of $1.00 in Arrears* (Future Value of Annuity) Periods 2% 4% 6% 8% 10% 12% 14% 16% 18% 20% Period 1 1.000 1.000 1.000 1.000 1.000 1.000 1.000 1.000 1.000 1.000 Period 2 2.020 2.040 2.060 2.080 2.100 2.120 2.140 2.160 2.180 2.200 Period 3 3.060 3.122 3.184 3.246 3.310 3.374 3.440 3.506 3.572 3.640 Period 4 4.122 4.246 4.375 4.506 4.641 4.779 4.921 5.066 5.215 5.368 Period 5 5.204 5.416 5.637 5.867 6.105 6.353 6.610 6.877 7.154 7.442 Period 6 6.308 6.633 6.975 7.336 7.716 8.536 8.977 9.442 9.930 Period 7 7.434 7.898 8.394 8.923 9.487 10.089 10.730 11.414 12.142 12.916 Period 8 8.583 9.214 9.897 10.637 11.436 12.300 13.233 14.240 15.327 16.499 Period 9 9.755 10.583 11.491 12.488 13.579 14.776 16.085 17.519 19.086 20.799 Period 10 10.950 12.006 13.181 14.487 15.937 17.549 19.337 21.321 23.521 25.959 Period 11 12.169 13.486 14.972 16.645 18.531 20.655 23.045 25.733 28.755 32.150 Period 12 13.412 15.026 16.870 18.977 21.384 24.133 27.271 30.850 34.931 39.581 Period 13 14.680 16.627 18.882 21.495 24.523 28.029 32.089 36.786 42.219 48.497 Period 14 15.974 18.292 21.015 24.215 27.975 32.393 37.581 43.672 50.818 59.196 Period 15 17.293 20.024 23.276 27.152 31.772 37.280 43.842 51.660 51.660 60.965 72.035 Period 16 18.639 21.825 25.673 30.324 35.950 42.753 50.980 60.925 72.939 87.442 Period 17 20.012 23.698 28.213 33.750 40.545 48.884 59.118 71.673 87.068 105.931 Period 18 21.412 25.645 30.906 37.450 45.599 55.750 68.394 84.141 103.740 128.117 Period 19 22.841 27.671 33.760 41.446 51.159 63.440 78.969 98.603 123.414 154.740 Period 20 24.297 29.778 36.786 45.762 57.275 72.052 91.025 115.380 146.628 186.688 Period 21 25.783 31.969 39.993 50.423 64.002 81.699 104.768 134.841 174.021 225.026 Dorind 17 77 20 21 210 12 207 CC 167 71 402 00 02 170 120 167 16 nc C 215 271 021 22% 1.000 2.220 3.708 5.524 7.740 10.442 13.740 17.762 22.670 28.657 35.962 44.874 55.746 69.010 85.192 104.935 129.020 158.405 194.254 237.989 291.347 250 142 24% 1.000 2.240 3.778 5.684 8.048 10.980 14.615 19.123 24.712 31.643 40.238 50.895 64.110 80.496 100.815 126.011 157.253 195.994 244.033 303.601 377.465 AC NEC 26% 1.000 2.260 3.848 5.848 8.368 11.544 15.546 20.588 26.940 34.945 45.031 57.739 73.751 93.926 119.347 151.377 191.735 242.585 306.658 387.389 489.110 28% 1.000 2.280 3.918 6.016 8.700 12.136 16.534 22.163 29.369 38.593 50.398 65,510 84.853 109.612 141.303 181.868 233.791 300.252 385.323 494.213 633.593 011 nnn 30% 1.000 2.300 3.990 6.187 9.043 12.756 17.583 23.858 32.015 42.619 56.405 74.327 97.625 127.913 167.286 218.472 285.014 371.518 483.973 630.165 820.215 1007 on 32% 1.000 2.320 4.062 6.362 9.398 13.406 18.696 25.678 34.895 47.062 63.122 84.320 112.303 149.240 197.997 262.356 347.309 459.449 607.472 802.863 1060.779 40% 1.000 2.400 4.360 7.104 10.946 16.324 23.853 34.395 49.153 69.814 98.739 139.235 195.929 275.300 386.420 541.988 759.784 1064.697 1491.576 2089.206 2925.889 A107 10 F F F F F F F F F P P P P P P P P P P P P E47 4A04 Print Done Period 20 24.297 29.778 36.786 45.762 57.275 72.052 91.025 115.380 146.628 186.688 237.989 303.601 387.389 494.213 630.165 802.863 2089.206 P Period 21 25.783 31.969 39.993 50.423 64.002 81.699 104.768 134.841 174.021 225.026 291.347 377.465 489.110 633.593 820.215 1060.779 2925.889 P Period 22 27.299 34.248 43.392 55.457 71.403 92.503 120.436 157.415 206.345 271.031 356.443 469.056 617.278 811.999 1067.280 1401.229 4097.245 P Period 23 28.845 36.618 46.996 60.893 79.543 104.603 138.297 183.601 244.487 326.237 435.861 582.630 778.771 1040.358 1388.464 1850.622 5737.142 P Period 24 30.422 39.083 50.816 66.765 88.497 118.155 158.659 213.978 289.494 392.484 532.750 723.461 982.251 1332.659 1806.003 2443.821 8032.999 P Period 25 32.030 41.646 54.865 73.106 98.347 133.334 181.871 249.214 342.603 471.981 650.955 898.092 1238.636 1706.803 2348.803 3226.844 11247.199 P Period 26 33.671 44.312 59.156 79.954 109.182 150.334 208.333 290.088 405.272 567.377 795.165 1114.634 1561.682 2185.708 3054.444 4260.434 15747.079 P Period 27 35.344 47.084 63.706 87.351 121.100 169.374 238.499 337.502 479.221 681.853 971.102 1383.146 1968.719 2798.706 3971.778 5624.772 22046.910 P Period 28 37.051 49.968 68.528 95.339 134.210 190.699 272.889 392.503 566.481 819.223 1185.744 1716.101 2481.586 3583.344 5164.311 7425.699 30866.674 P Period 29 38.792 52.966 73.640 103.966 148.631 214.583 312.094 456.303 669.447 984.068 1447.608 2128.965 3127.798 4587.680 6714.604 9802.923 43214.343 P Period 30 40.568 56.085 79.058 113.283 164.494 241.333 356.787 530.312 790.948 1181.882 1767.081 2640.916 3942.026 5873.231 8729.985 12940.859 60501.081 P Period 35 49.994 73.652 111.435 172.317271.024 431.663 693.573 1120.7131816.652 2948.341 4783.645 7750.225 12527.442 20188.966 32422.868 51869.427 325400.279 P Period 40 60.402 95.026 154.762259.057442.593 767.091 1342.0252360.7574163.213 7343.858 12936.535 22728.803 39792.982 69377.460 120392.883 207874.272 1750091.741 P Payments (or receipts) at the end of each period. Onani anaan Print Done i X Requirements 1. Calculate the cash inflows and outflows of the "modernize" and "replace" alternatives over the 2021 - 2027 period. 2. Calculate payback period for the "modernize" and "replace" alternatives. 3. Calculate net present value of the "modernize" and "replace" alternatives. 4. What factors should Green Chips consider in choosing between the alternatives? Print Done Requirement 1. Calculate the cash inflows and outflows of the "modernize" and "replace" alternatives over the 2021 - 2027 period. First, determine the cash inflows and outflows of the "modernize" alternative over the 2021 to 2027 period. (Use a minus sign or parentheses for a cash outflows. If an input field is not used in the table, leave that input field empty, do not enter a zero.) Units Net cash Initial Proceeds from Year sold contributions investments sale of equipment Jan 1, 2021 (34,100,000) Dec 31, 2021 540 $ 610 Dec 31, 2022 Dec 31, 2023 680 Dec 31, 2024 750 9,180,000 10,370,000 11,560,000 12,750,000 13,940,000 15,130,000 16,320,000 Dec 31, 2025 820 Dec 31, 2026 890 Dec 31, 2027 960 7,400,000 Next, determine the cash inflows and outflows of the "replace" alternative over the 2021 to 2027 period. (Use a minus sign or parentheses for a cash outflows. If an input field is not used in the table, leave that input field empty, do not enter a zero.) Units Net cash Year sold contributions Initial Proceeds from investments sale of equipment (63,800,000) $ 4,400,000 Jan 1, 2021 Dec 31, 2021 540 $ Dec 31, 2022 610 Dec 31, 2023 680 750 Dec 31, 2024 Dec 31, 2025 14,040,000 15,860,000 17,680,000 19,500,000 21,320,000 23,140,000 24,960,000 820 Dec 31, 2026 890 Dec 31, 2027 960 $ 15,500,000


