Please help with statistics and probability questions
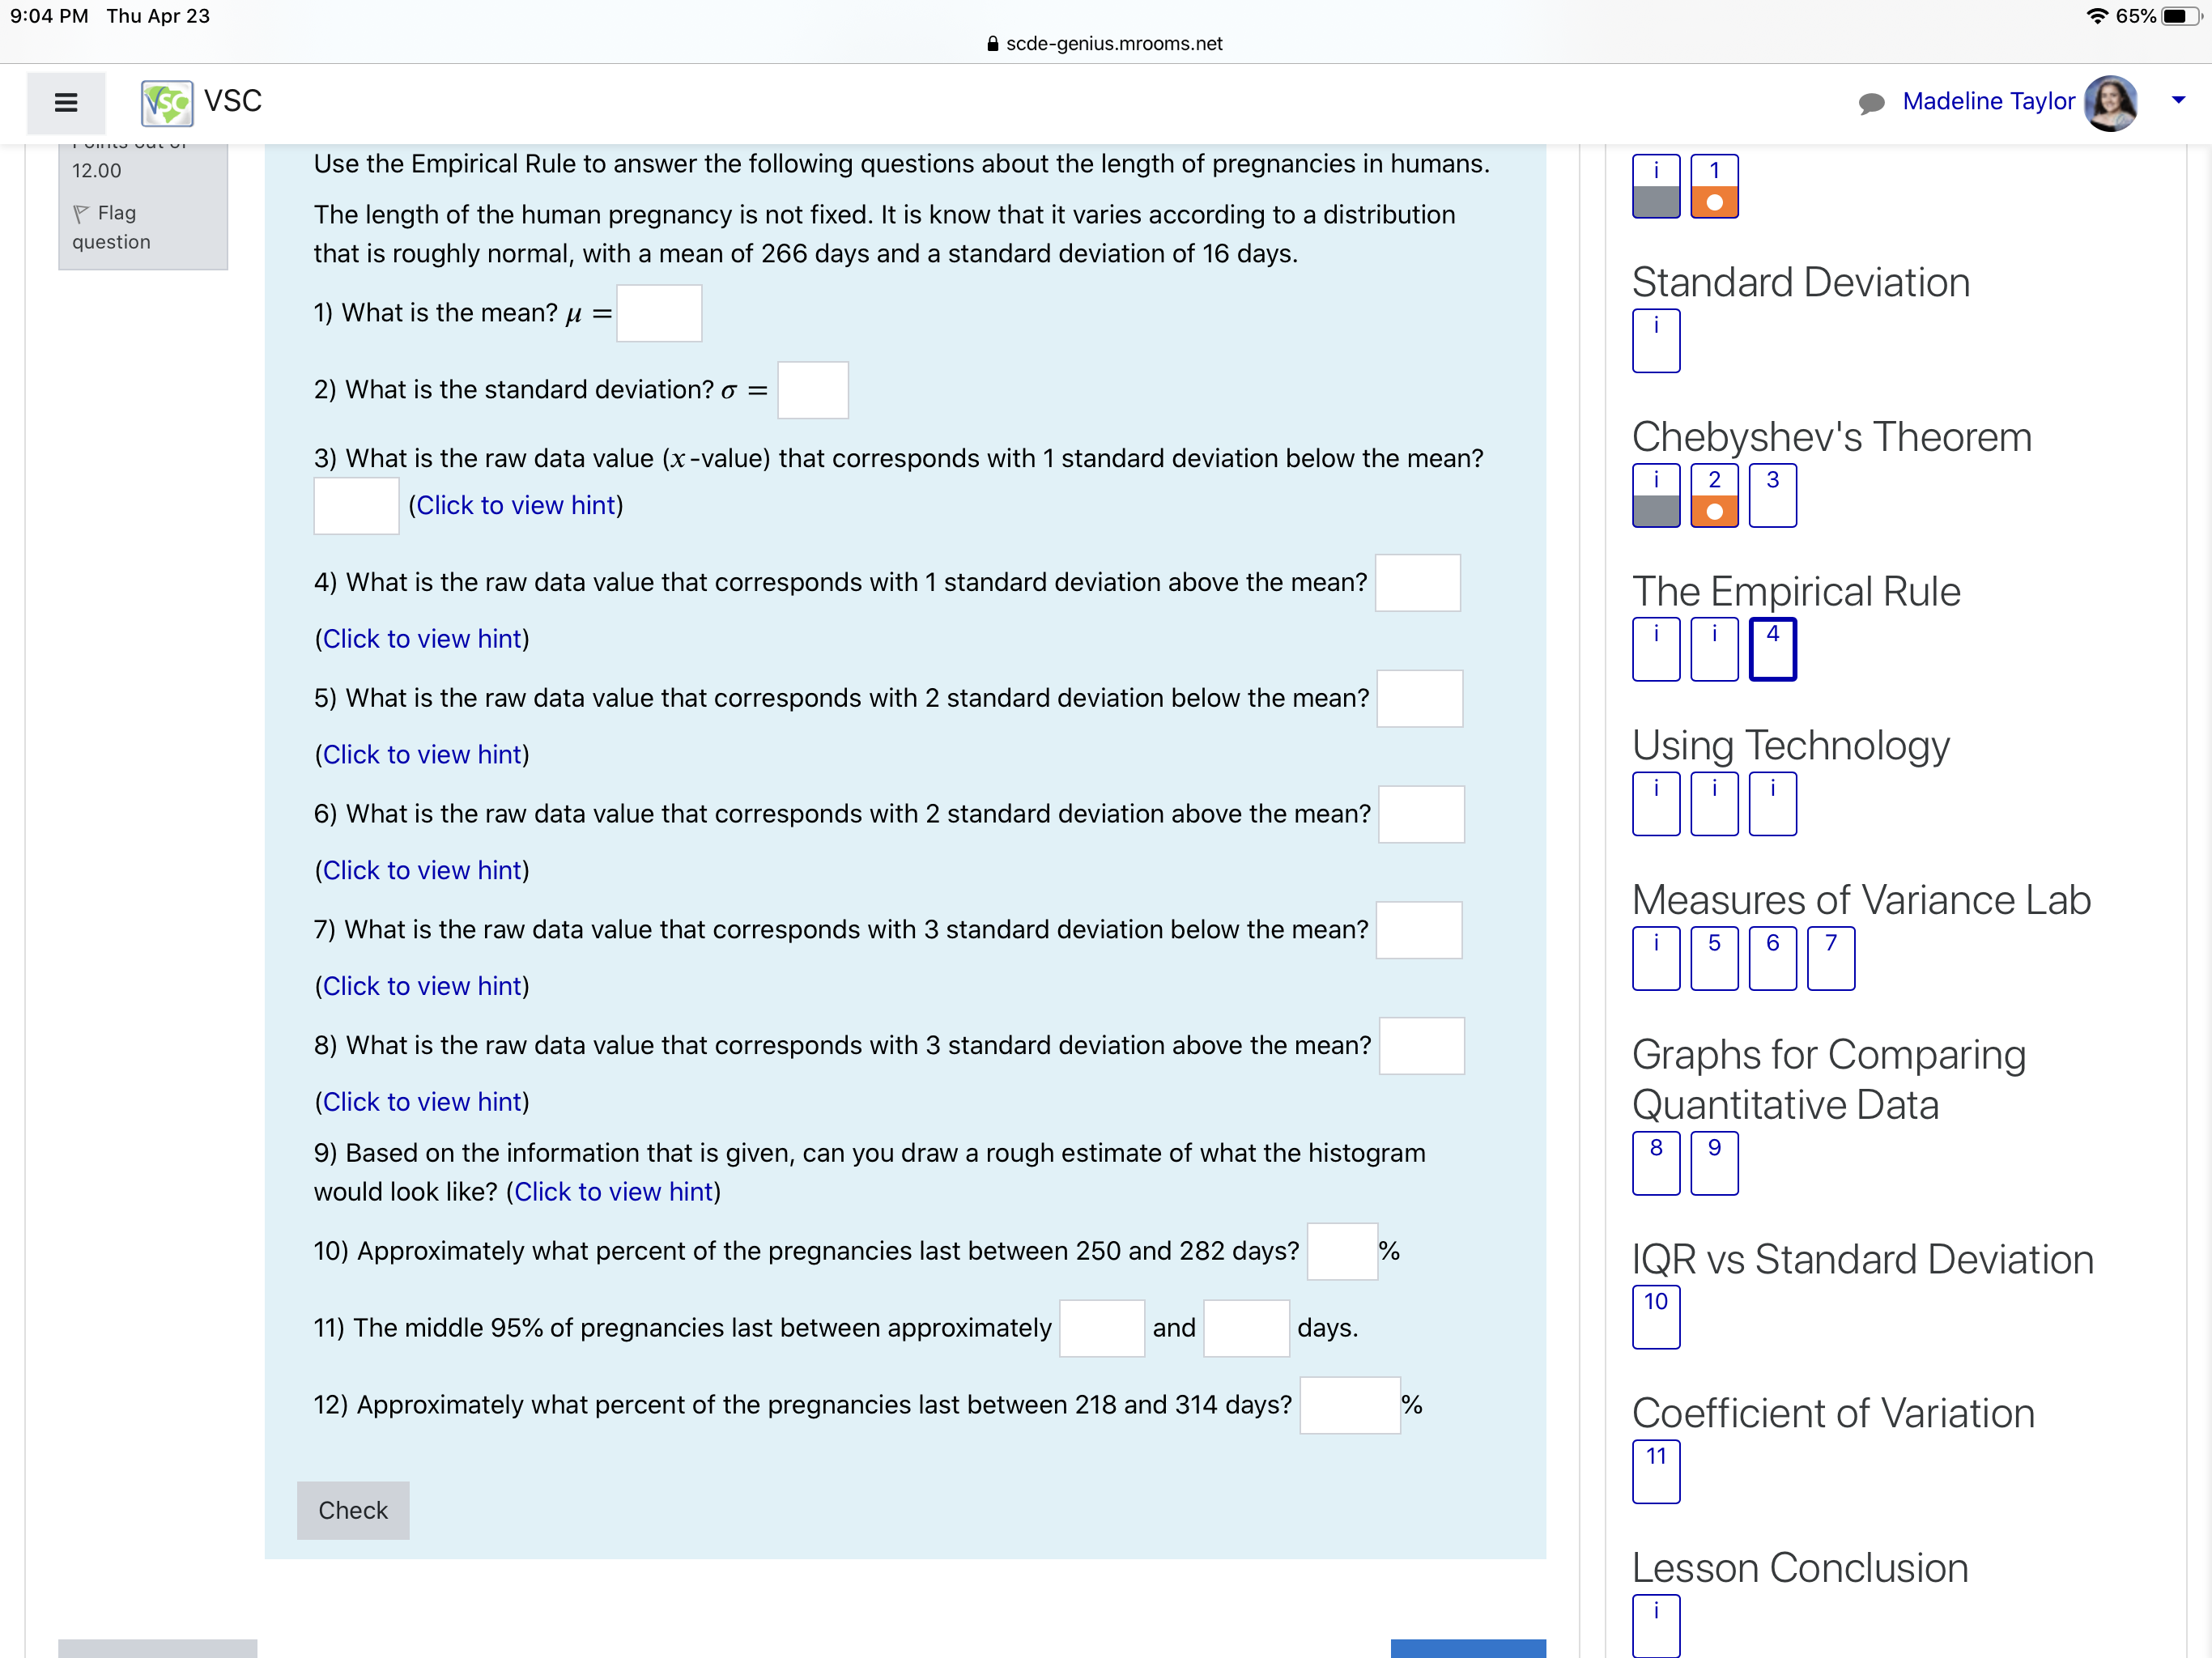
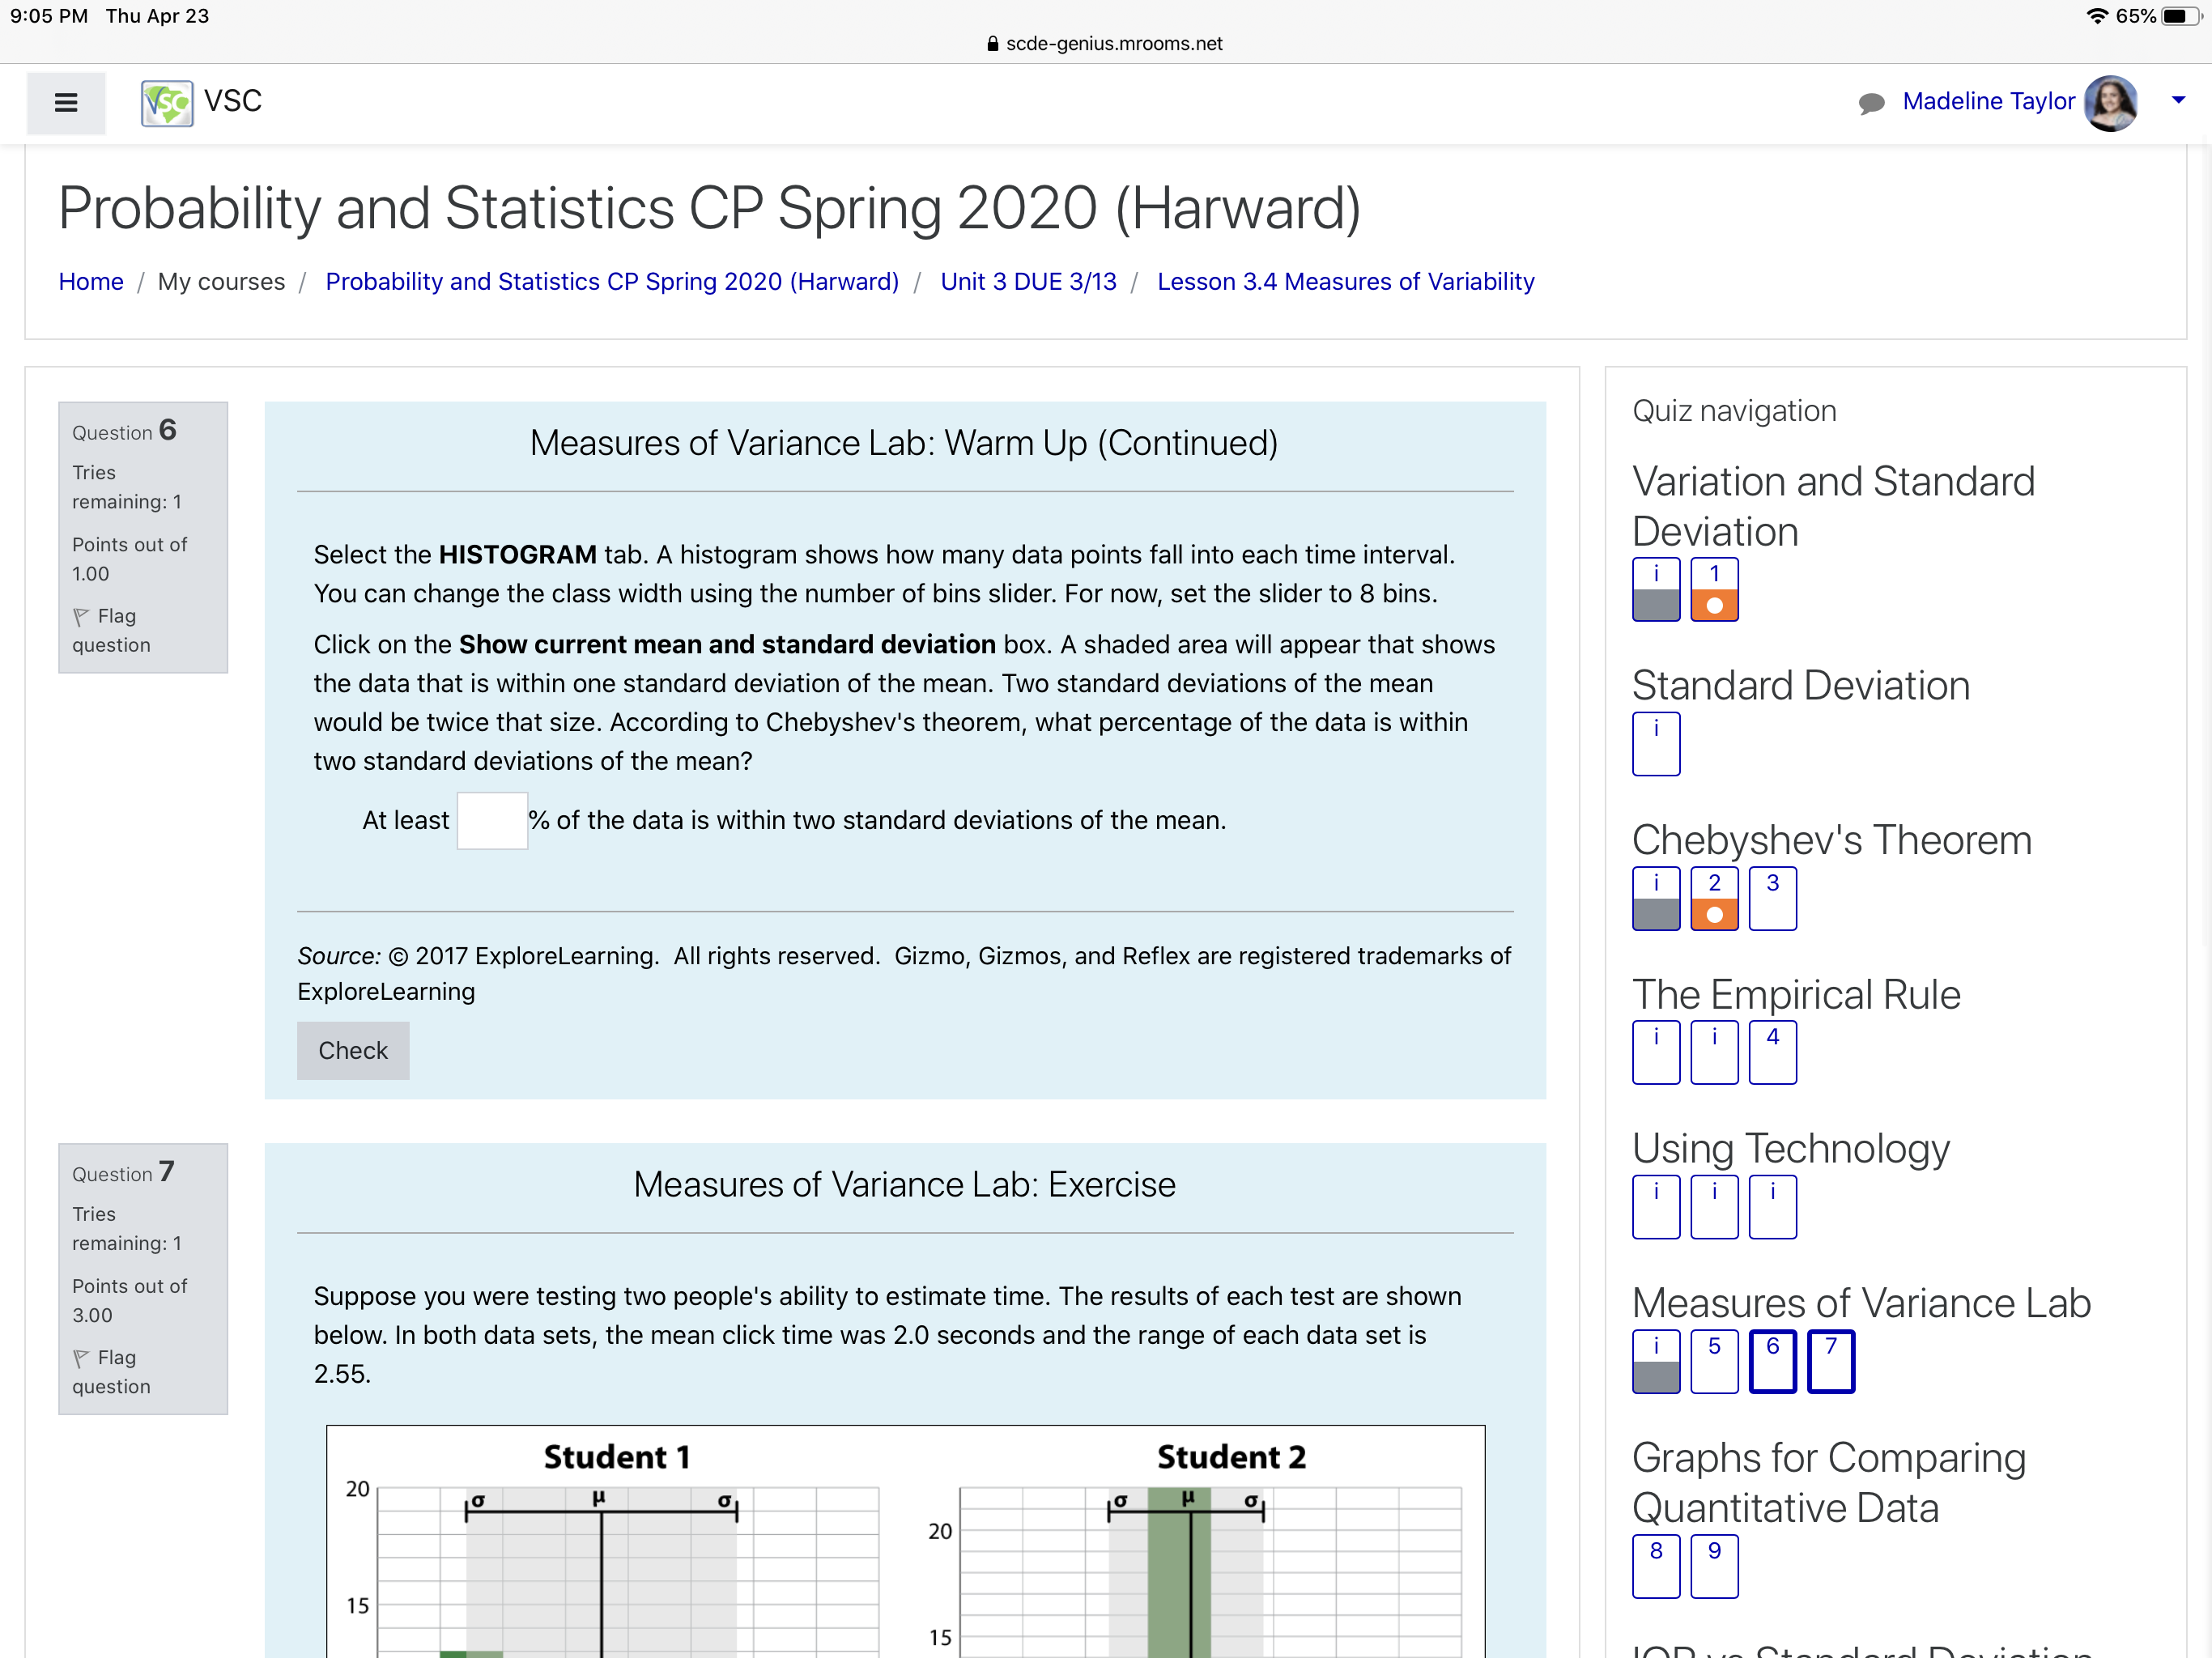
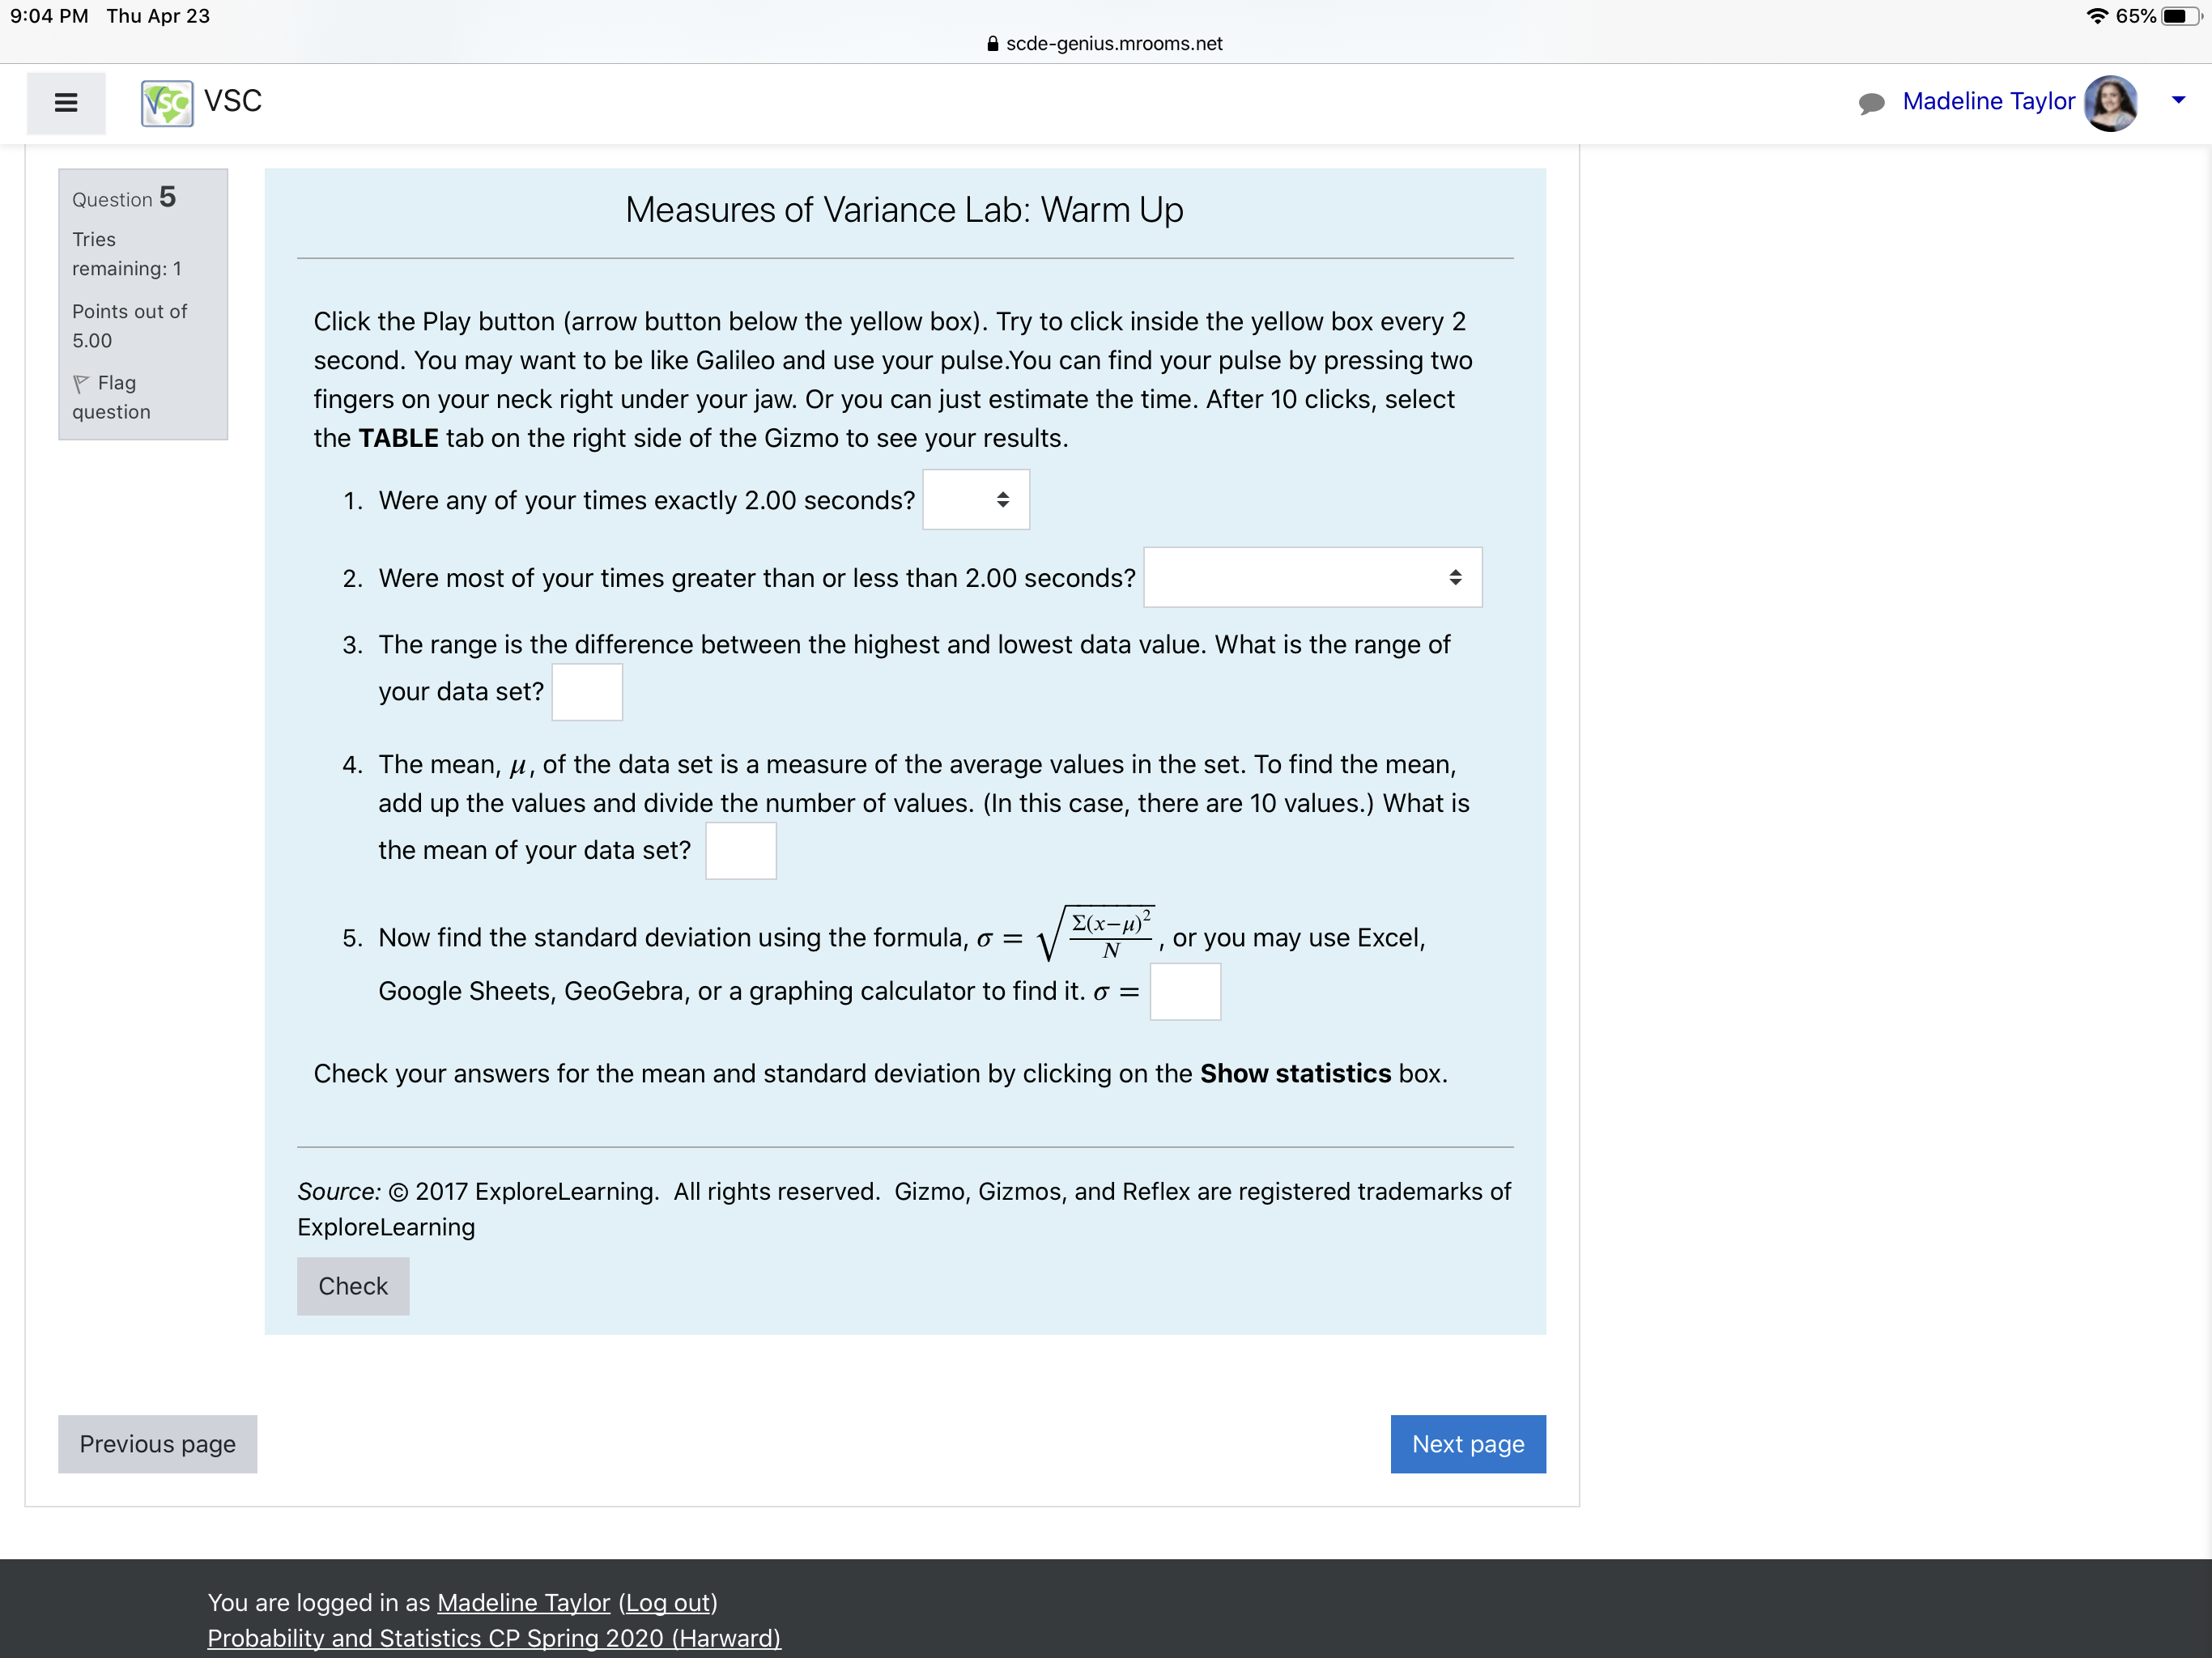
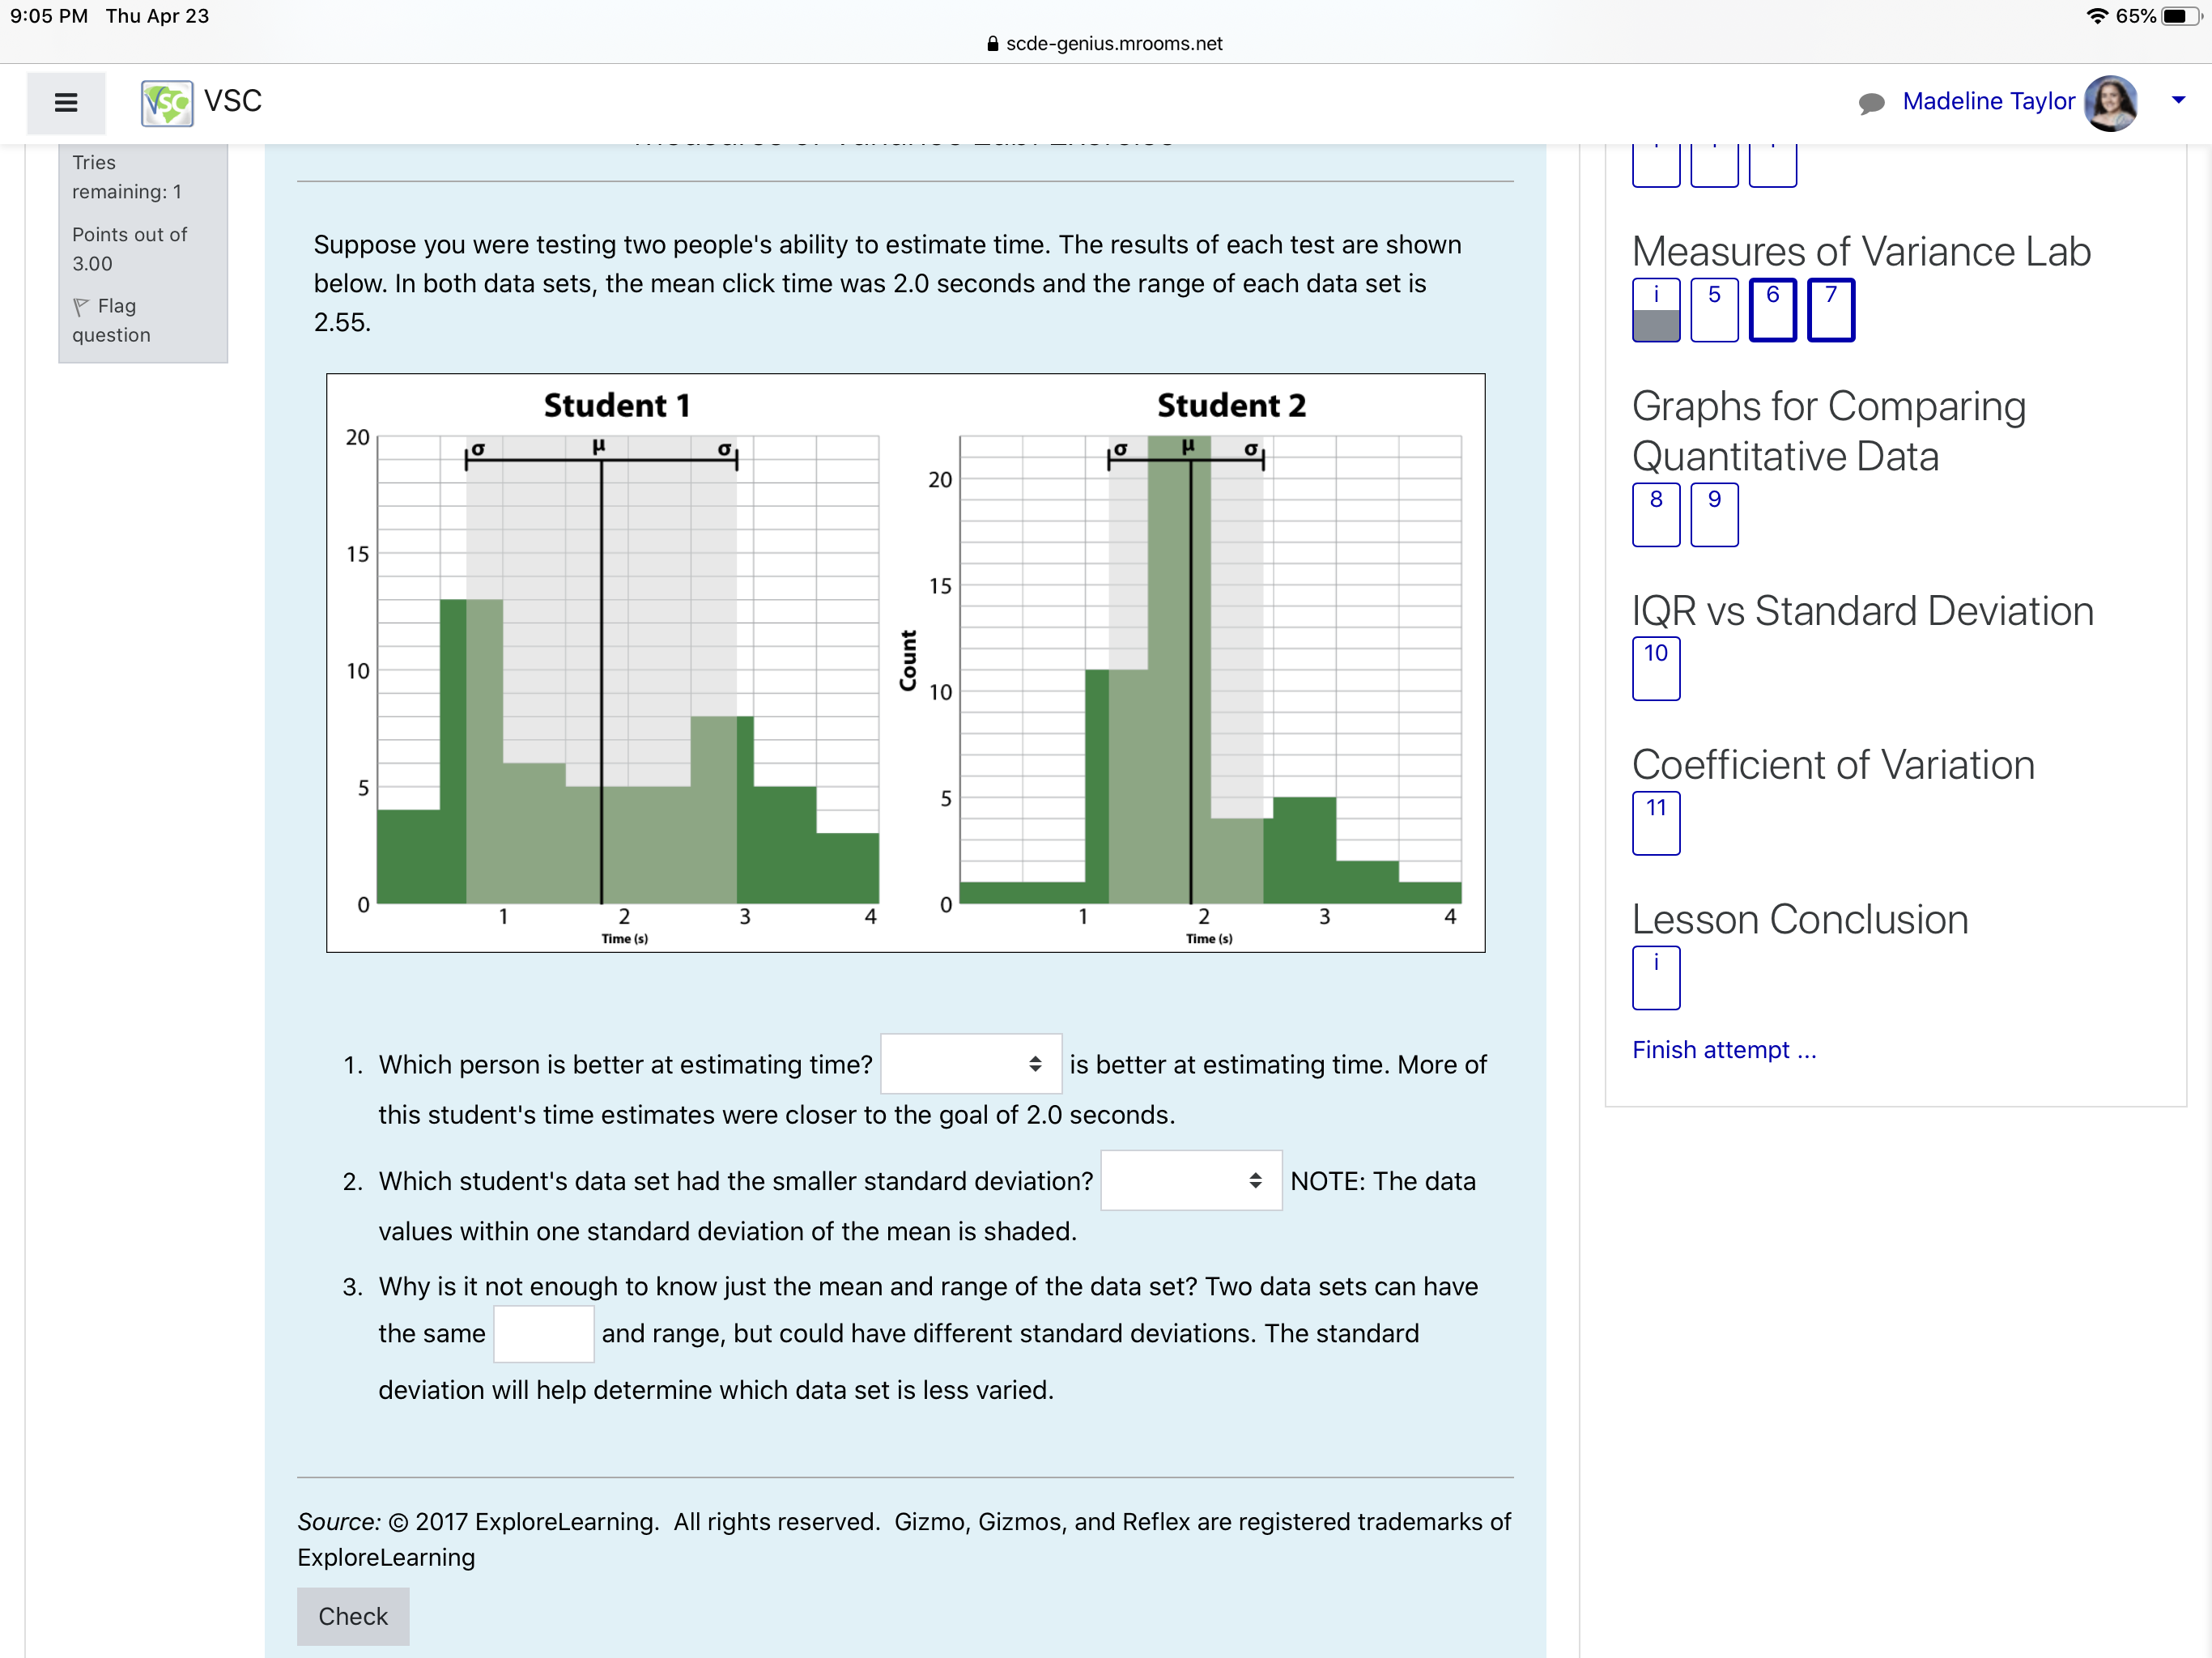
9:04 PM Thu Apr 23 scdegenius.mrooms.net '3 65% [:1' E vsc 12.00 (7 Flag question Use the Empirical Rule to answer the following questions about the length of pregnancies in humans. The length of the human pregnancy is not fixed. It is know that it varies according to a distribution that is roughly normal, with a mean of 266 days and a standard deviation of 16 days. 1) What is the mean? u = 2) What is the standard deviation? 0' = 3) What is the raw data value (x -va|ue) that corresponds with 1 standard deviation below the mean? (Click to view hint) 4) What is the raw data value that corresponds with 1 standard deviation above the mean? (Click to view hint) 5) What is the raw data value that corresponds with 2 standard deviation below the mean? (Click to view hint) 6) What is the raw data value that corresponds with 2 standard deviation above the mean? (Click to view hint) 7) What is the raw data value that corresponds with 3 standard deviation below the mean? (Click to view hint) 8) What is the raw data value that corresponds with 3 standard deviation above the mean? (Click to view hint) 9) Based on the information that is given, can you draw a rough estimate of what the histogram would look like? (Click to view hint) 10) Approximately what percent of the pregnancies last between 250 and 282 days? % 11) The middle 95% of pregnancies last between approximately and days. 12) Approximately what percent of the pregnancies last between 218 and 314 days? % Check , Madeline Taylore V it! S_tandard Deviation Chebyshev's Theorem i 2 3 I II J The Empirical Rule i Using Technology Measures of Variance Lab T T 3 Graphs for Comparing Quantitative Data 8 9 I IQR vs Standard Deviation 'lO @efficient of Variation 'l'l Lesson Conclusion 9:05 PM Thu Apr 23 scde-genius.mrooms.net 'e' 65% [:1' E vsc Probability and Statistics CP Spring 2020 (Harward) Home / My courses / Probability and Statistics CP Spring 2020 (Han/vard) / Unit 3 DUE 3/13 / Lesson 3.4 Measures of Variability Question 6 Tries remaining: 1 Points out of 1.00 \\7 Flag question Question 7 Tries remaining: 1 Points out of 3.00 '7 Flag question Measures of Variance Lab: Warm Up (Continued) Select the HISTOGRAM tab, A histogram shows how many data points fall into each time interval. You can change the class width using the number of bins slider. For now, set the slider to 8 bins. Click on the Show current mean and standard deviation box. A shaded area will appear that shows the data that is within one standard deviation of the mean. Two standard deviations of the mean would be twice that size. According to Chebyshev's theorem, what percentage of the data is within two standard deviations of the mean? At least % of the data is within two standard deviations of the mean. Source: 2017 ExploreLearning. All rights reserved. Gizmo, Gizmos, and Reflex are registered trademarks of ExploreLearning Check Measures of Variance Lab: Exercise Suppose you were testing two people's ability to estimate time. The results of each test are shown below. In both data sets, the mean click time was 2.0 seconds and the range of each data set is 2.55. Student 1 Student 2 20 a a 20 15 , Madeline Taylor\" V Quiz navigation Variation and Standard @viation .E S_tandard Deviation Chebyshev's Theorem i 2 3 I II J The Empirical Rule 4 l gig Technology Measures of Variance Lab iSEII Graphs for Comparing Quantitative Data IE Inn . .. DLA'AI'mAI \"A. .tALIA.' 9:04 PM Thu Apr 23 scdegeniusmroomsnet '3 65% {E} ' VSC Question 5 Tries remaining: 1 Points out of 5.00 F Flag question Previous page Measures of Variance Lab: Warm Up Click the Play button (arrow button below the yellow box). Tn/ to click inside the yellow box every 2 second. You may want to be like Galileo and use your pulse.You can find your pulse by pressing two fingers on your neck right under your jaw. Or you can just estimate the time. After 10 clicks, select the TABLE tab on the right side of the Gizmo to see your results. 1. Were any of your times exactly 2.00 seconds? : 2. Were most of your times greater than or less than 2.00 seconds? : 3. The range is the difference between the highest and lowest data value. What is the range of your data set? 4. The mean, M. of the data set is a measure of the average values in the set. To find the mean, add up the values and divide the number of values. (In this case, there are 10 values.) What is the mean of your data set? 206102 5. Now find the standard deviation using the formula, 0' = N , or you may use Excel, Google Sheets, GeoGebra, or a graphing calculator to find it. a = Check your answers for the mean and standard deviation by clicking on the Show statistics box. Source: 2017 ExploreLearning. All rights reserved. Gizmo, Gizmos, and Reflex are registered trademarks of ExploreLearning Check Next page You are logged in as Madeline Taylor (Log out) , Madeline Taylor 9 V Probability and Statistics CP Sggrin 2020 Harward 9:05 PM Thu Apr 23 scde-genius.mrooms.net '3 65% (:1' E vsc Tries ' remaining: 1 Points out of 3.00 \\7 Flag question Suppose you were testing two people's ability to estimate time. The results of each test are shown below. In both data sets, the mean click time was 2.0 seconds and the range of each data set is 2.55. Student 1 Student 2 1. Which person is better at estimating time? is better at estimating time. More of this student's time estimates were closer to the goal of 2.0 seconds. 2. Which student's data set had the smaller standard deviation? NOTE: The data values within one standard deviation of the mean is shaded. 3. Why is it not enough to know just the mean and range of the data set? Two data sets can have the same and range, but could have different standard deviations. The standard deviation will help determine which data set is less varied. Source: 2017 ExploreLearning. All rights reserved. Gizmo, Gizmos, and Reflex are registered trademarks of ExploreLearning Check , Madeline Taylor. V Measures of Variance Lab WEE. Graphs for Comparing giantitative Data 13 IQR vs Standard Deviation 'lO @efcient of Variation 11 Lesson Conclusion i Finish attempt 9:04 PM Thu Apr 23 4.\" 65% [1} scde-genius.mrooms.net E E VSC , Madeline Taylor 9 v We\"... .c .V. v.. . .rnn. .. .3 Quantitative Data Ques"\"3 Chebyshev's Theorem Practice: Scenario 2 8 9 Tries remaining: 1 2'22\" \"' f Instructions: Read the following scenarios and answer the questions. IQR VS Standard Deviation '7 Flag "Bacteria in a culture can live for an average of two hours with a standard deviation of 15 minutes. 10 question How long can we expect at least 75% of the bacteria to live?\" 1. What is the mean? E = hours = minutes (Convert the number of hours to Coefcient of Variation minutes.) 11 2. What is the standard deviation? s = minutes L_esson Conclusion 3. According to Chebyshev's Theorem, how many standard deviations contain at least 75% of the I data? k = Finish attempt (Click to hide hint) To find k, use the equation percent = 0.75 = 1 % Substitution and change percent to decimal, 0.25 = % Subtract 1 from each side. 0.2508) = 1 Multiply each side by k2' %(k2) = 1 Change decimal to fraction. k2 = 4 Multiply each side by 4. k = -l_-2 Take the square root of each side. 4. We can expect the at least 75% of the bacteria to live between and minutes. (Enter? ks in the first blank and f + ks in the second blank.) Check