Question: Please help with the below tasks. Instructions: -Read the IMA case article: Funds Transfer Pricing and Segment Profitability- The Case of Adriatic Bank. Peter Novak
Please help with the below tasks.
Instructions:
-Read the IMA case article: Funds Transfer Pricing and Segment Profitability- The Case of Adriatic Bank.
Peter Novak has asked you, the management accountant graduate, to compute transfer prices based on the information provided previously for each type of asset and prepare the income statement and the segment report for Adriatic Bank Group. Given that there are potential challenges that result from the use of transfer prices, Peter also asks that you provide commentary on the banks current transfer pricing system using market rates and recognizing maturity transformation in the Treasury department, its effects on performance of each segment, its effects on the bank overall, and its effects on the Adriatic Bank Group segment managers motivation. (All tables referred to in the tasks below can be found in the Excel template file provided).
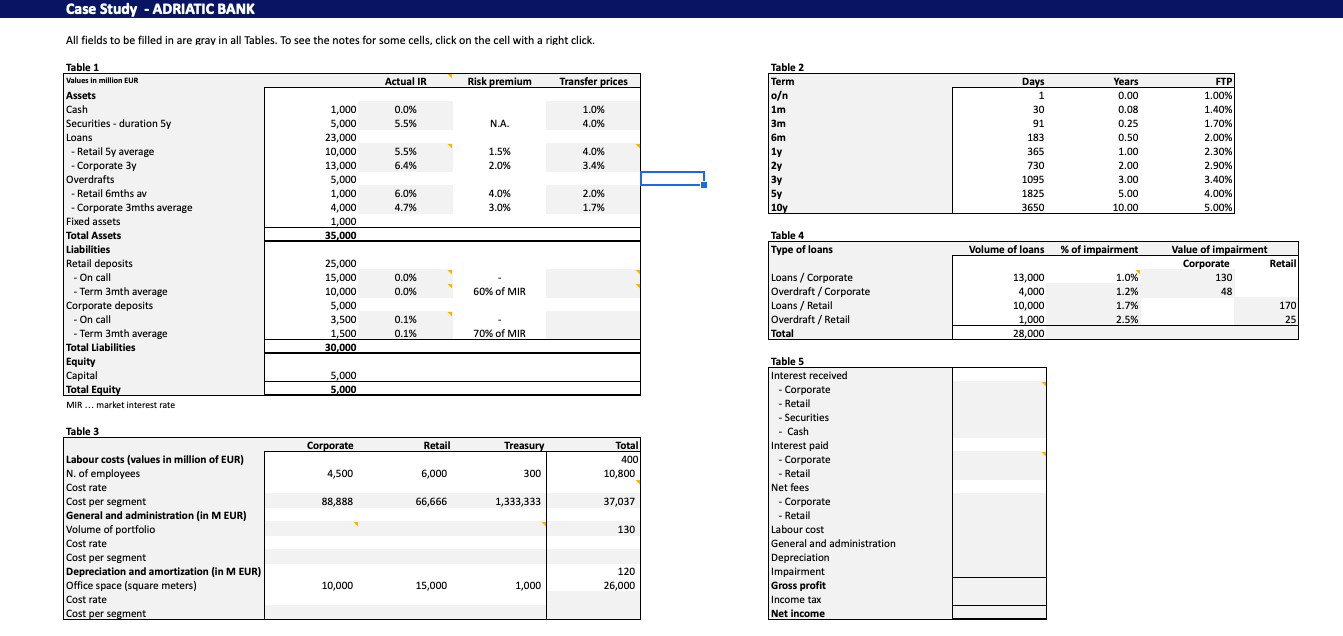
TASK 1: Based on data from Table 2, compute the applied interest rate for each portfolio and cost of each liability in Table 1. Market interest rates form the basis of transfer prices. They depend on an assets maturity. Add to them risk premia to get applied interest rates at which the bank lends funds to its various clients and fill in the respective column in Table 1. For example, a loan of five-year maturity has a market interest rate of 4% and a risk premium of 1.5%. By adding them up, its applied interest rate charged to customers is 5.5%.
TASK 2: Calculate indirect operating costs per segment by filling in Table 3. (Cash holdings can be ascribed to the Treasury segment for the purpose of cost allocation).
TASK 3: Calculate total value of impairments and impairments per segment by filling in Table 4.
TASK 4: Prepare the Adriatic Bank Group Income Statement in Table 5 based on the interest rates that you have just calculated in Table 1. Interest income (or interest cost) for each type of asset (or liability) is the product of the volume of the portfolio and the applied interest rate for its maturity. The bank deposits its cash with the central bank and earns the on-call interest rate for it. Include total operating costs, depreciation, and impairment as presented in Tables 3 and 4. The bank earned EUR 250 million of net fees and commissions in the Corporate segment and EUR 150 million in the Retail segment. Assume that income tax is 20%.
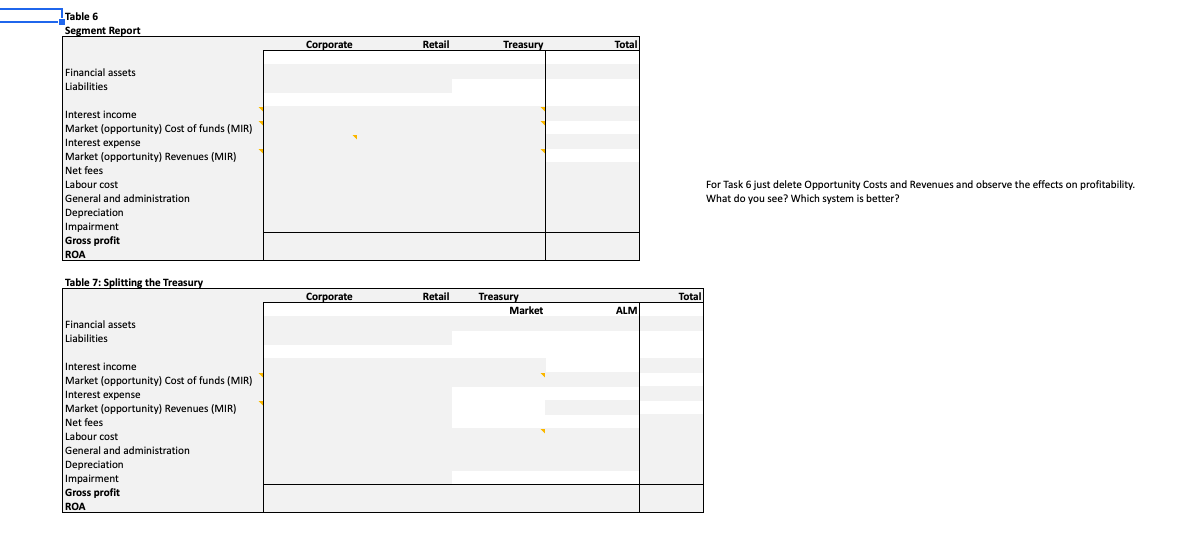
TASK 5: Prepare a segment report for Adriatic Bank Group. Allocate revenues and costs to the Corporate, Retail, and Treasury segments. Use funds transfer prices from Table 1 and follow the explanation from Peter in the profitability measurement section of the case. Calculate return on assets (gross profit/assets employed). A segment generates a return by both, lending money to clients and borrowing money from clients (collecting deposits). In the case of lending, return of the segment is the difference between the interest charged to clients (the applied interest rates) and the market interest rates that are the opportunity costs for the use of funds. In the case of collecting deposits, the return of the segment is the difference between the market interest rates at which the segment lends funds to other segments and lower interest rates paid to clients for the deposits. Which segment is the most profitable? Why? Discuss the results.
TASK 6: To understand what the effect on segment profitability without the transfer pricing system based on market prices, remove the effect of transfer prices in the Excel spreadsheet. Without the effect of transfer prices, calculate the outcome of Treasury based on the applied interest rates for its securities and cash. Discuss the obtained outcome in view of Peters explanation in the Profitability Measurement section of the case.
TASK 7: As required by the chairwoman of the audit committee, split the effects of Treasury into those that this segment earns on the market (interest on securities opportunity costs for the funds) and to the Asset and Liability Management (ALM) that captures the effect of maturity transformation. Consider the opportunity costs for the funds used by the Treasury from the yield curve for respective maturities of cash and securities. Divide operating costs equally between Treasurys market operations and ALM.
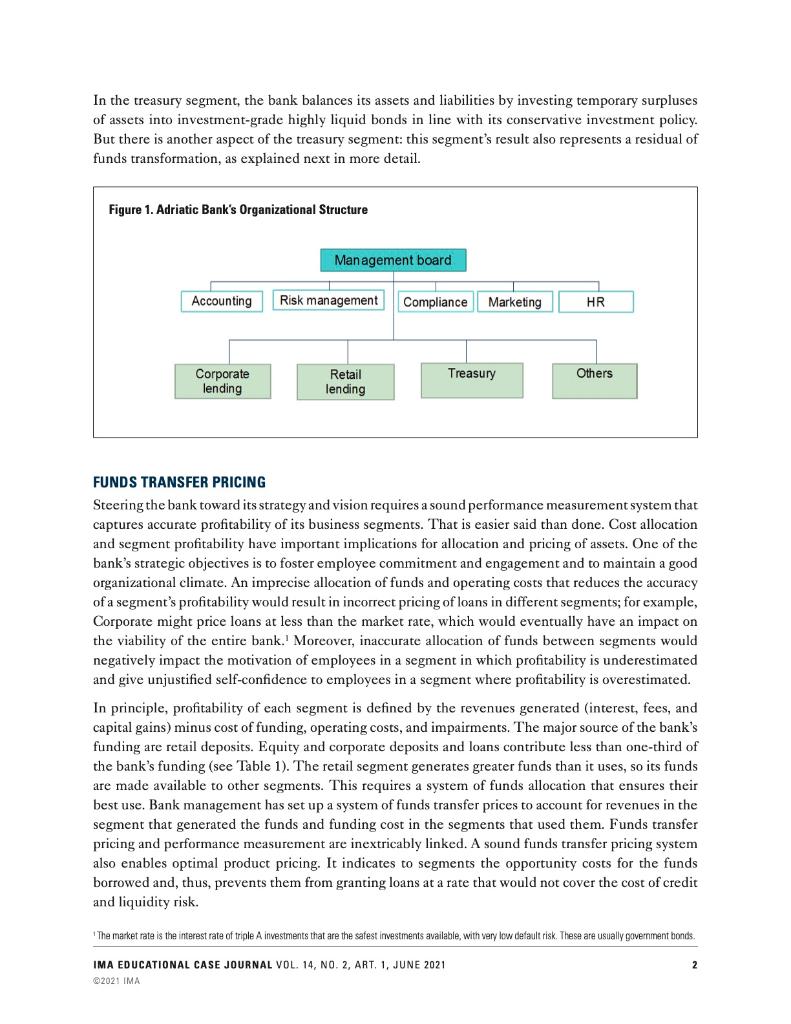
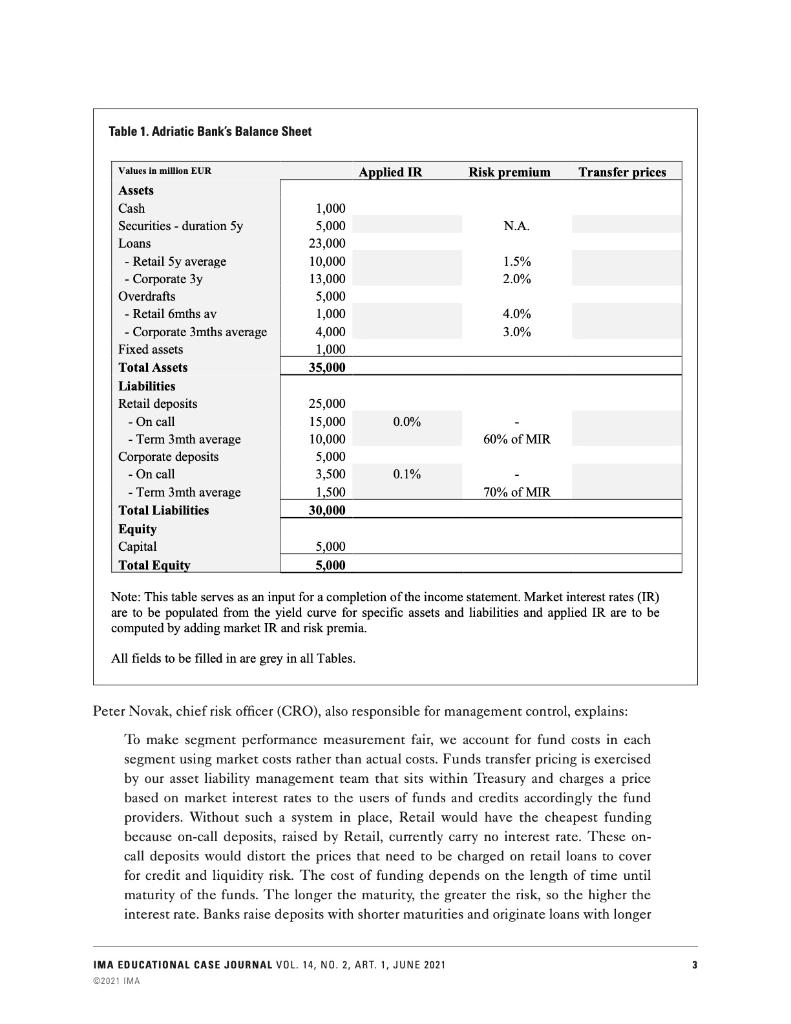
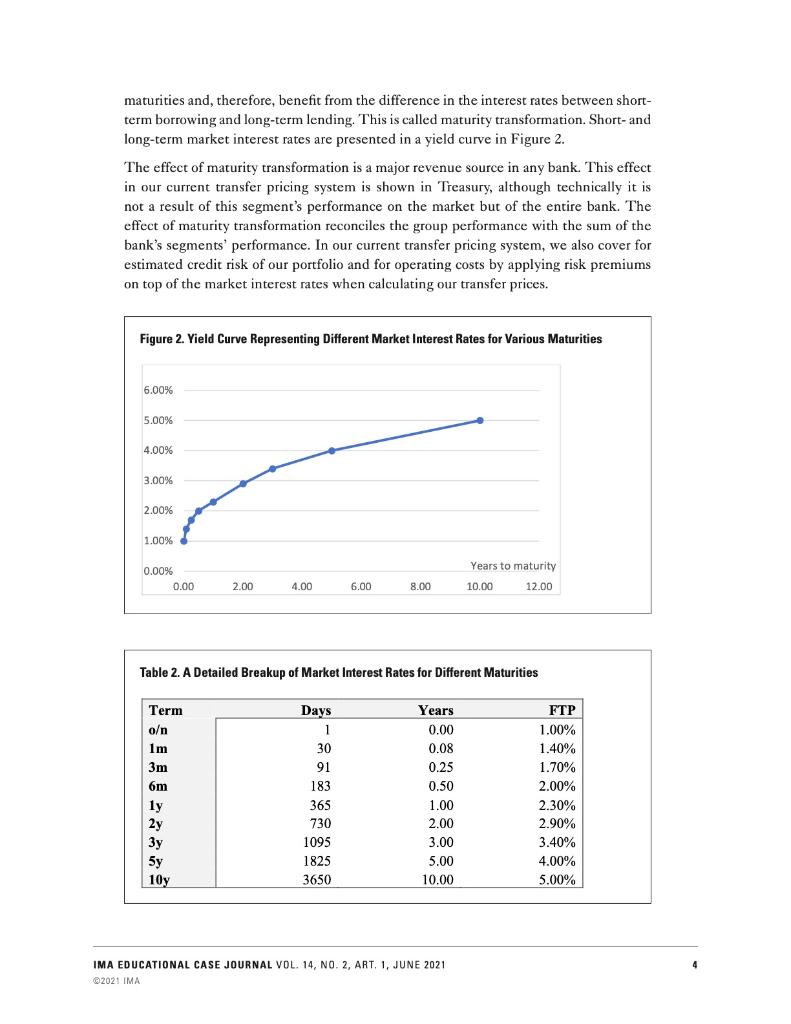
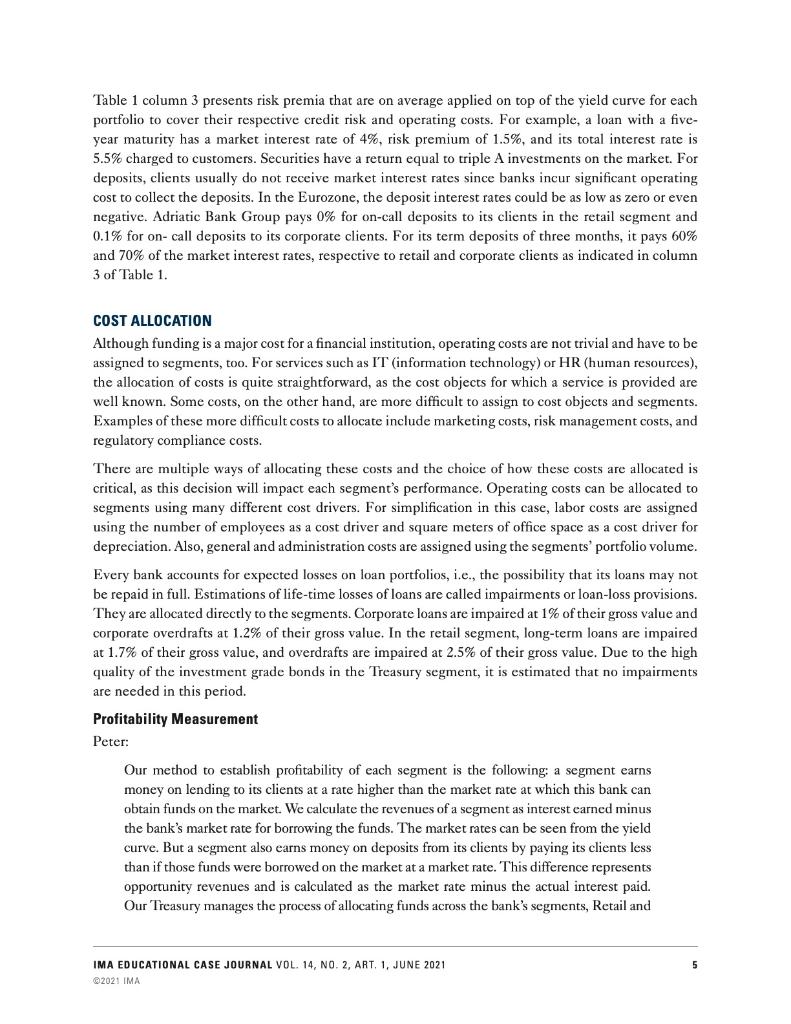
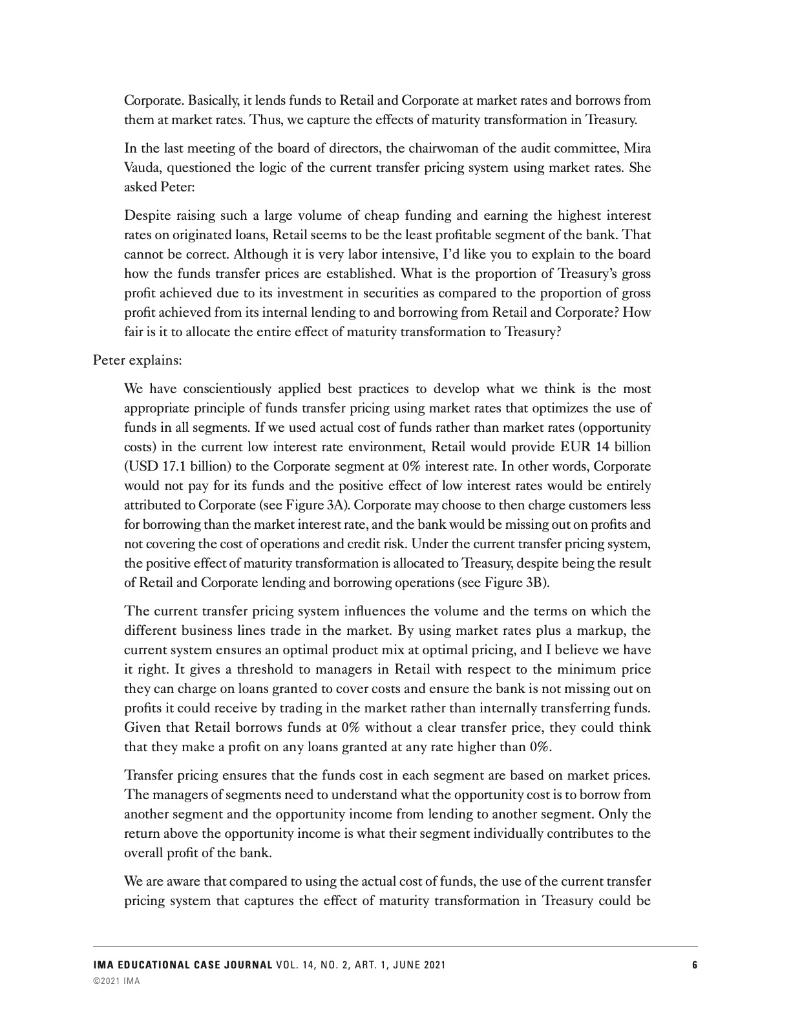
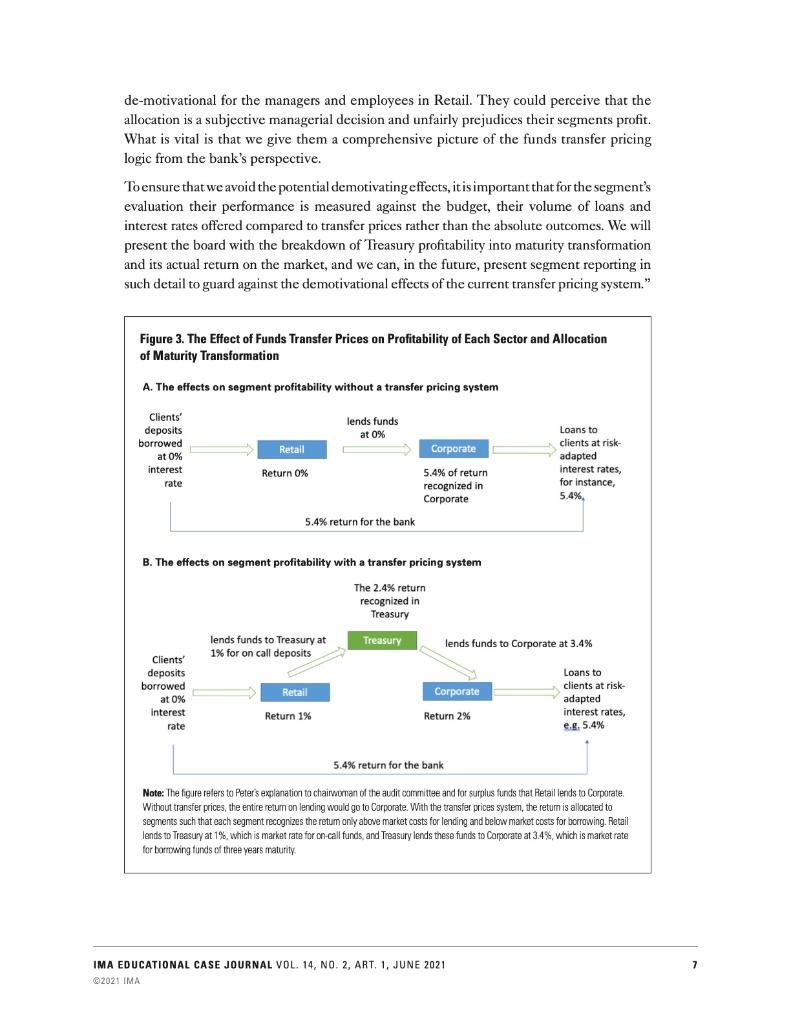

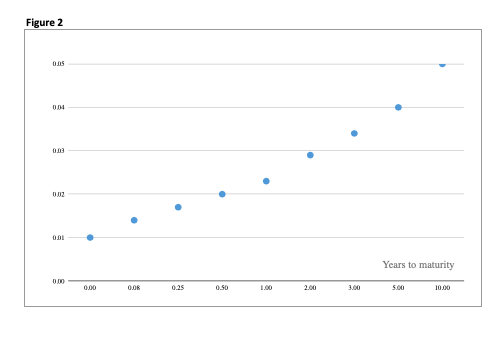
IMA EDUCATIONAL Case Study ima The Association of Accountants and Financial Professionals Case Journal in Business ISSN 1940-204X Funds Transfer Pricing and Segment Profitability- The Case of Adriatic Bank Sergeja Slapnicar Robyn King University of Queensland Business School University of Queensland Business School INTRODUCTION Adriatic Bank Group is a medium-sized European universal bank based in Slovenia. Through its network of 56 branches, two subsidiaries, and e-banking system, the Adriatic Bank Group provides integrated financial services, ranging from traditional banking, investment banking, leasing and property management. The bank's vision is to become the best bank for digital banking in a highly competitive Slovenian market. Sixteen banks currently compete for market share in Slovenia, a country with a population of only two million. To support its new vision and associated strategy, the Adriatic Bank Group needed to develop a range of new digital services and products. This requires the transformation of the bank's existing processes. One of Adriatic Bank Group's core processes needing transformation is loan granting. The loan- granting process needs to be accelerated to be efficiently offered on-line but without any loss of prudence in the process. The bank continuously trains its staff to initiate new services and products and to respond to new requirements and technologies. Changes in processes and training programs. have already resulted in an increase in Adriatic Bank Group's market share and higher user satisfaction rates with mobile applications.. BANK'S BUSINESS MODEL Adriatic Bank Group's core segments are corporate lending, retail lending, and treasury (see Figure 1). In the retail lending segment, the bank acquires funds from households and uses some of these funds to grant loans to retail clients and households. The bank uses the surplus funds from the retail lending segment in the corporate lending segment. The corporate lending segment focuses its lending to small and medium-sized corporate clients. The bank restricts the size of loans to its corporate customers, since too many large loans would expose a medium-sized bank, such as Adriatic Bank. Group, to concentration risk, which is a risk of failure due to a large client's failure. In noninterest generating activities, the bank provides its customers with a payment system, insurance, and other services. Noninterest generating activities (fees and commission income) constitute a part of either the corporate or the retail segment depending on which clients have generated this income. We thank Professor David Smith for helpful comments and Ben Catalan for designing the template file for students. IMA EDUCATIONAL CASE JOURNAL VOL. 14, NO. 2, ART. 1, JUNE 2021 2021 IMA In the treasury segment, the bank balances its assets and liabilities by investing temporary surpluses of assets into investment-grade highly liquid bonds in line with its conservative investment policy. But there is another aspect of the treasury segment: this segment's result also represents a residual of funds transformation, as explained next in more detail. Figure 1. Adriatic Bank's Organizational Structure Management board Accounting Risk management Compliance Marketing HR Treasury Others Corporate lending Retail lending FUNDS TRANSFER PRICING Steering the bank toward its strategy and vision requires a sound performance measurement system that captures accurate profitability of its business segments. That is easier said than done. Cost allocation and segment profitability have important implications for allocation and pricing of assets. One of the bank's strategic objectives is to foster employee commitment and engagement and to maintain a good organizational climate. An imprecise allocation of funds and operating costs that reduces the accuracy of a segment's profitability would result in incorrect pricing of loans in different segments; for example, Corporate might price loans at less than the market rate, which would eventually have an impact on the viability of the entire bank. Moreover, inaccurate allocation of funds between segments would negatively impact the motivation of employees in a segment in which profitability is underestimated and give unjustified self-confidence to employees in a segment where profitability is overestimated. In principle, profitability of each segment is defined by the revenues generated (interest, fees, and capital gains) minus cost of funding, operating costs, and impairments. The major source of the bank's funding are retail deposits. Equity and corporate deposits and loans contribute less than one-third of the bank's funding (see Table 1). The retail segment generates greater funds than it uses, so its funds are made available to other segments. This requires a system of funds allocation that ensures their best use. Bank management has set up a system of funds transfer prices to account for revenues in the segment that generated the funds and funding cost in the segments that used them. Funds transfer pricing and performance measurement are inextricably linked. A sound funds transfer pricing system also enables optimal product pricing. It indicates to segments the opportunity costs for the funds borrowed and, thus, prevents them from granting loans at a rate that would not cover the cost of credit and liquidity risk. The market rate is the interest rate of triple A investments that are the safest investments available, with very low default risk. These are usually government bonds. 2 IMA EDUCATIONAL CASE JOURNAL VOL. 14, NO. 2, ART. 1, JUNE 2021 2021 IMA Table 1. Adriatic Bank's Balance Sheet Values in million EUR Assets Cash Securities duration Sy Loans. - Retail 5y average - Corporate 3y Overdrafts Risk premium 1,000 5,000 N.A. 23,000 10,000 1.5% 13,000 2.0% 5,000 Retail 6mths av 1,000 4.0% Corporate 3mths average 4,000 3.0% Fixed assets 1,000 Total Assets 35,000 Liabilities Retail deposits 25,000 - On call 15,000 0.0% - Term 3mth average 10,000 60% of MIR Corporate deposits 5,000 - On call 3,500 0.1% 1,500 70% of MIR - Term 3mth average Total Liabilities 30,000 Equity Capital 5,000 Total Equity 5,000 Note: This table serves as an input for a completion of the income statement. Market interest rates (IR) are to be populated from the yield curve for specific assets and liabilities and applied IR are to be computed by adding market IR and risk premia. All fields to be filled in are grey in all Tables. Peter Novak, chief risk officer (CRO), also responsible for management control, explains: To make segment performance measurement fair, we account for fund costs in each segment using market costs rather than actual costs. Funds transfer pricing is exercised by our asset liability management team that sits within Treasury and charges a price based on market interest rates to the users of funds and credits accordingly the fund providers. Without such a system in place, Retail would have the cheapest funding because on-call deposits, raised by Retail, currently carry no interest rate. These on- call deposits would distort the prices that need to be charged on retail loans to cover for credit and liquidity risk. The cost of funding depends on the length of time until maturity of the funds. The longer the maturity, the greater the risk, so the higher the interest rate. Banks raise deposits with shorter maturities and originate loans with longer IMA EDUCATIONAL CASE JOURNAL VOL. 14, NO. 2, ART. 1, JUNE 2021 2021 IMA Applied IR Transfer prices maturities and, therefore, benefit from the difference in the interest rates between short- term borrowing and long-term lending. This is called maturity transformation. Short- and long-term market interest rates are presented in a yield curve in Figure 2. The effect of maturity transformation is a major revenue source in any bank. This effect in our current transfer pricing system is shown in Treasury, although technically it is not a result of this segment's performance on the market but of the entire bank. The effect of maturity transformation reconciles the group performance with the sum of the bank's segments' performance. In our current transfer pricing system, we also cover for estimated credit risk of our portfolio and for operating costs by applying risk premiums on top of the market interest rates when calculating our transfer prices. Figure 2. Yield Curve Representing Different Market Interest Rates for Various Maturities 6.00% 5.00% 4.00% 3.00% 2.00% 1.00% Years to maturity 0.00% 0.00 2.00 4.00 6.00 8.00 10.00 12.00 Table 2. A Detailed Breakup of Market Interest Rates for Different Maturities Term Days Years FTP o 1 0.00 1.00% 1m 30 0.08 1.40% 3m 91 0.25 1.70% 6m 183 0.50 2.00% ly 365 1.00 2.30% 2y 730 2.00 2.90% 3y 1095 3.00 3.40% 5y 1825 5.00 4.00% 10y 3650 10.00 5.00% IMA EDUCATIONAL CASE JOURNAL VOL. 14, NO. 2, ART. 1, JUNE 2021 2021 IMA Table 1 column 3 presents risk premia that are on average applied on top of the yield curve for each portfolio to cover their respective credit risk and operating costs. For example, a loan with a five- year maturity has a market interest rate of 4%, risk premium of 1.5%, and its total interest rate is 5.5% charged to customers. Securities have a return equal to triple A investments on the market. For deposits, clients usually do not receive market interest rates since banks incur significant operating cost to collect the deposits. In the Eurozone, the deposit interest rates could be as low as zero or even negative. Adriatic Bank Group pays 0% for on-call deposits to its clients in the retail segment and 0.1% for on-call deposits to its corporate clients. For its term deposits of three months, it pays 60% and 70% of the market interest rates, respective to retail and corporate clients as indicated in column 3 of Table 1. COST ALLOCATION Although funding is a major cost for a financial institution, operating costs are not trivial and have to be assigned to segments, too. For services such as IT (information technology) or HR (human resources), the allocation of costs is quite straightforward, as the cost objects for which a service is provided are well known. Some costs, on the other hand, are more difficult to assign to cost objects and segments. Examples of these more difficult costs to allocate include marketing costs, risk management costs, and regulatory compliance costs. There are multiple ways of allocating these costs and the choice of how these costs are allocated is critical, as this decision will impact each segment's performance. Operating costs can be allocated to segments using many different cost drivers. For simplification in this case, labor costs are assigned using the number of employees as a cost driver and square meters of office space as a cost driver for depreciation. Also, general and administration costs are assigned using the segments' portfolio volume. Every bank accounts for expected losses on loan portfolios, i.e., the possibility that its loans may not be repaid in full. Estimations of life-time losses of loans are called impairments or loan-loss provisions. They are allocated directly to the segments. Corporate loans are impaired at 1% of their gross value and corporate overdrafts at 1.2% of their gross value. In the retail segment, long-term loans are impaired at 1.7% of their gross value, and overdrafts are impaired at 2.5% of their gross value. Due to the high quality of the investment grade bonds in the Treasury segment, it is estimated that no impairments are needed in this period. Profitability Measurement Peter: Our method to establish profitability of each segment is the following: a segment earns money on lending to its clients at a rate higher than the market rate at which this bank can obtain funds on the market. We calculate the revenues of a segment as interest earned minus the bank's market rate for borrowing the funds. The market rates can be seen from the yield curve. But a segment also earns money on deposits from its clients by paying its clients less than if those funds were borrowed on the market at a market rate. This difference represents opportunity revenues and is calculated as the market rate minus the actual interest paid. Our Treasury manages the process of allocating funds across the bank's segments, Retail and IMA EDUCATIONAL CASE JOURNAL VOL. 14, NO. 2, ART. 1, JUNE 2021 @2021 IMA Corporate. Basically, it lends funds to Retail and Corporate at market rates and borrows from them at market rates. Thus, we capture the effects of maturity transformation in Treasury. In the last meeting of the board of directors, the chairwoman of the audit committee, Mira Vauda, questioned the logic of the current transfer pricing system using market rates. She asked Peter: Despite raising such a large volume of cheap funding and earning the highest interest rates on originated loans, Retail seems to be the least profitable segment of the bank. That cannot be correct. Although it is very labor intensive, I'd like you to explain to the board how the funds transfer prices are established. What is the proportion of Treasury's gross profit achieved due to its investment in securities as compared to the proportion of gross profit achieved from its internal lending to and borrowing from Retail and Corporate? How fair is it to allocate the entire effect of maturity transformation to Treasury? Peter explains: We have conscientiously applied best practices to develop what we think is the most appropriate principle of funds transfer pricing using market rates that optimizes the use of funds in all segments. If we used actual cost of funds rather than market rates (opportunity costs) in the current low interest rate environment, Retail would provide EUR 14 billion (USD 17.1 billion) to the Corporate segment at 0% interest rate. In other words, Corporate would not pay for its funds and the positive effect of low interest rates would be entirely. attributed to Corporate (see Figure 3A). Corporate may choose to then charge customers less for borrowing than the market interest rate, and the bank would be missing out on profits and not covering the cost of operations and credit risk. Under the current transfer pricing system, the positive effect of maturity transformation is allocated to Treasury, despite being the result of Retail and Corporate lending and borrowing operations (see Figure 3B). The current transfer pricing system influences the volume and the terms on which the different business lines trade in the market. By using market rates plus a markup, the current system ensures an optimal product mix at optimal pricing, and I believe we have it right. It gives a threshold to managers in Retail with respect to the minimum price they can charge on loans granted to cover costs and ensure the bank is not missing out on profits it could receive by trading in the market rather than internally transferring funds. Given that Retail borrows funds at 0% without a clear transfer price, they could think that they make a profit on any loans granted at any rate higher than 0%. Transfer pricing ensures that the funds cost in each segment are based on market prices. The managers of segments need to understand what the opportunity cost is to borrow from another segment and the opportunity income from lending to another segment. Only the return above the opportunity income is what their segment individually contributes to the overall profit of the bank. We are aware that compared to using the actual cost of funds, the use of the current transfer pricing system that captures the effect of maturity transformation in Treasury could be IMA EDUCATIONAL CASE JOURNAL VOL. 14, NO. 2, ART. 1, JUNE 2021 2021 IMA de-motivational for the managers and employees in Retail. They could perceive that the allocation is a subjective managerial decision and unfairly prejudices their segments profit. What is vital is that we give them a comprehensive picture of the funds transfer pricing logic from the bank's perspective. To ensure that we avoid the potential demotivating effects, it is important that for the segment's evaluation their performance is measured against the budget, their volume of loans and interest rates offered compared to transfer prices rather than the absolute outcomes. We will present the board with the breakdown of Treasury profitability into maturity transformation and its actual return on the market, and we can, in the future, present segment reporting in such detail to guard against the demotivational effects of the current transfer pricing system." Figure 3. The Effect of Funds Transfer Prices on Profitability of Each Sector and Allocation of Maturity Transformation A. The effects on segment profitability without a transfer pricing system Clients deposits lends funds at 0% Retail Corporate borrowed at 0% interest rate Loans to clients at risk- adapted interest rates, for instance, 5.4%, Return 0% 5.4% of return recognized in Corporate 5.4% return for the bank B. The effects on segment profitability with a transfer pricing system The 2.4% return recognized in Treasury lends funds to Treasury at lends funds to Corporate at 3.4% 1% for on call deposits Loans to Clients' deposits borrowed at 0% interest. Corporate Retail Return 1% clients at risk- adapted interest rates, e.g. 5.4 % rate 5.4% return for the bank Note: The figure refers to Peter's explanation to chairwoman of the audit committee and for surplus funds that Retail lends to Corporate. Without transfer prices, the entire return on lending would go to Corporate. With the transfer prices system, the return is allocated to segments such that each segment recognizes the retum only above market costs for lending and below market costs for borrowing. Retail lends to Treasury at 1%, which is market rate for on-call funds, and Treasury lends these funds to Corporate at 3.4%, which is market rate for borrowing funds of three years maturity. Treasury Return 2% IMA EDUCATIONAL CASE JOURNAL VOL. 14, NO. 2, ART. 1, JUNE 2021 2021 IMA The bank deposits its cash with the central bank and earns the on-call interest rate for it. Total operating costs, depreciation, and impairment are included in the income statement. The bank earned EUR 250 million of net fees and commissions in the Corporate segment and EUR 150 million in the Retail segment. Income tax is 20%. ABOUT IMA (INSTITUTE OF MANAGEMENT ACCOUNTANTS) IMA, the association of accountants and financial professionals in business, is a global professional association focused exclusively on advancing the management accounting profession. IMA supports the profession through research, teaching cases, the CMA (Certified Management Accountant) program, continuing education, networking and advocacy of the highest ethical business practices. IMA has a global network of more than 140,000 members in 140 countries and 300 professional and student chapters. For more information, please visit www.imanet.org. IMA EDUCATIONAL CASE JOURNAL VOL. 14, NO. 2, ART. 1, JUNE 2021 2021 IMA Figure 2 0.05 0.04 0,03 0.02 0.01 0.00 0.00 0.08 0.25 0.50 1.00 2.00 3.00 Years to maturity 5.00 10.00 Table 6 Segment Report Financial assets Liabilities Interest income Market (opportunity) Cost of funds (MIR) Interest expense Market (opportunity) Revenues (MIR) Net fees Labour cost General and administration. Depreciation Impairment Gross profit ROA Table 7: Splitting the Treasury Financial assets Liabilities Interest income Market (opportunity) Cost of funds (MIR) Interest expense Market (opportunity) Revenues (MIR) Net fees Labour cost General and administration Depreciation Impairment Gross profit ROA Corporate Corporate Retail Retail Treasury Treasury Market Total ALM For Task 6 just delete Opportunity Costs and Revenues and observe the effects on profitability. What do you see? Which system is better? Total Case Study - ADRIATIC BANK All fields to be filled in are gray in all Tables. To see the notes for some cells, click on the cell with a right click. Table 1 Values in million EUR Actual IR Risk premium Transfer prices Assets Cash 0.0% 1.0% 1,000 5,000 Securities - duration Sy 5.5% N.A. 4.0% Loans 23,000 - Retail Sy average 10,000 5.5% 1.5% 4.0% Corporate 3y 13,000 6.4% 2.0% 3.4% Overdrafts 5,000 - Retail 6mths av 1,000 6.0% 4.0% 2.0% - Corporate 3mths average 4,000 4.7% 3.0% 1.7% Fixed assets 1,000 Total Assets 35,000 Liabilities Retail deposits 25,000 - On call 15,000 0.0% -Term 3mth average 10,000 0.0% 60% of MIR Corporate deposits 5,000 - On call 3,500 0.1% -Term 3mth average 1,500 0.1% 70% of MIR Total Liabilities 30,000 Equity Capital 5,000 5,000 Total Equity MIR... market interest rate Table 3 Corporate Labour costs (values in million of EUR) N. of employees 4,500 Cost rate Cost per segment 88,888 General and administration (in M EUR) Volume of portfolio Cost rate Cost per segment Depreciation and amortization (in M EUR) Office space (square meters) 10,000 Cost rate Cost per segment Retail 6,000 66,666 15,000 Treasury 300 1,333,333 1,000 Total 400 10,800 37,037 130 120 26,000 Table 2 Term o 1m 3m 6m 1y 2y 3y Sy 10y Table 4 Type of loans Loans / Corporate Overdraft / Corporate Loans / Retail Overdraft / Retail Total Table 5 Interest received - Corporate - Retail Securities Cash Interest paid - Corporate - Retail Net fees - Corporate - Retail Labour cost General and administration Depreciation Impairment Gross profit Income tax Net income Days 1 30 91 183 365 730 1095 1825 3650 Volume of loans 13,000 4,000 10,000 1,000 28,000 Years 0.00 0.08 0.25 0.50 1.00 2.00 3.00 5.00 10.00 % of impairment 1.0% 1.2% 1.7% 2.5% FTP 1.00% 1.40% 1.70% 2.00% 2.30% 2.90% 3.40% 4.00% 5.00% Value of impairment Corporate 130 48 Retail 170 25 IMA EDUCATIONAL Case Study ima The Association of Accountants and Financial Professionals Case Journal in Business ISSN 1940-204X Funds Transfer Pricing and Segment Profitability- The Case of Adriatic Bank Sergeja Slapnicar Robyn King University of Queensland Business School University of Queensland Business School INTRODUCTION Adriatic Bank Group is a medium-sized European universal bank based in Slovenia. Through its network of 56 branches, two subsidiaries, and e-banking system, the Adriatic Bank Group provides integrated financial services, ranging from traditional banking, investment banking, leasing and property management. The bank's vision is to become the best bank for digital banking in a highly competitive Slovenian market. Sixteen banks currently compete for market share in Slovenia, a country with a population of only two million. To support its new vision and associated strategy, the Adriatic Bank Group needed to develop a range of new digital services and products. This requires the transformation of the bank's existing processes. One of Adriatic Bank Group's core processes needing transformation is loan granting. The loan- granting process needs to be accelerated to be efficiently offered on-line but without any loss of prudence in the process. The bank continuously trains its staff to initiate new services and products and to respond to new requirements and technologies. Changes in processes and training programs. have already resulted in an increase in Adriatic Bank Group's market share and higher user satisfaction rates with mobile applications.. BANK'S BUSINESS MODEL Adriatic Bank Group's core segments are corporate lending, retail lending, and treasury (see Figure 1). In the retail lending segment, the bank acquires funds from households and uses some of these funds to grant loans to retail clients and households. The bank uses the surplus funds from the retail lending segment in the corporate lending segment. The corporate lending segment focuses its lending to small and medium-sized corporate clients. The bank restricts the size of loans to its corporate customers, since too many large loans would expose a medium-sized bank, such as Adriatic Bank. Group, to concentration risk, which is a risk of failure due to a large client's failure. In noninterest generating activities, the bank provides its customers with a payment system, insurance, and other services. Noninterest generating activities (fees and commission income) constitute a part of either the corporate or the retail segment depending on which clients have generated this income. We thank Professor David Smith for helpful comments and Ben Catalan for designing the template file for students. IMA EDUCATIONAL CASE JOURNAL VOL. 14, NO. 2, ART. 1, JUNE 2021 2021 IMA In the treasury segment, the bank balances its assets and liabilities by investing temporary surpluses of assets into investment-grade highly liquid bonds in line with its conservative investment policy. But there is another aspect of the treasury segment: this segment's result also represents a residual of funds transformation, as explained next in more detail. Figure 1. Adriatic Bank's Organizational Structure Management board Accounting Risk management Compliance Marketing HR Treasury Others Corporate lending Retail lending FUNDS TRANSFER PRICING Steering the bank toward its strategy and vision requires a sound performance measurement system that captures accurate profitability of its business segments. That is easier said than done. Cost allocation and segment profitability have important implications for allocation and pricing of assets. One of the bank's strategic objectives is to foster employee commitment and engagement and to maintain a good organizational climate. An imprecise allocation of funds and operating costs that reduces the accuracy of a segment's profitability would result in incorrect pricing of loans in different segments; for example, Corporate might price loans at less than the market rate, which would eventually have an impact on the viability of the entire bank. Moreover, inaccurate allocation of funds between segments would negatively impact the motivation of employees in a segment in which profitability is underestimated and give unjustified self-confidence to employees in a segment where profitability is overestimated. In principle, profitability of each segment is defined by the revenues generated (interest, fees, and capital gains) minus cost of funding, operating costs, and impairments. The major source of the bank's funding are retail deposits. Equity and corporate deposits and loans contribute less than one-third of the bank's funding (see Table 1). The retail segment generates greater funds than it uses, so its funds are made available to other segments. This requires a system of funds allocation that ensures their best use. Bank management has set up a system of funds transfer prices to account for revenues in the segment that generated the funds and funding cost in the segments that used them. Funds transfer pricing and performance measurement are inextricably linked. A sound funds transfer pricing system also enables optimal product pricing. It indicates to segments the opportunity costs for the funds borrowed and, thus, prevents them from granting loans at a rate that would not cover the cost of credit and liquidity risk. The market rate is the interest rate of triple A investments that are the safest investments available, with very low default risk. These are usually government bonds. 2 IMA EDUCATIONAL CASE JOURNAL VOL. 14, NO. 2, ART. 1, JUNE 2021 2021 IMA Table 1. Adriatic Bank's Balance Sheet Values in million EUR Assets Cash Securities duration Sy Loans. - Retail 5y average - Corporate 3y Overdrafts Risk premium 1,000 5,000 N.A. 23,000 10,000 1.5% 13,000 2.0% 5,000 Retail 6mths av 1,000 4.0% Corporate 3mths average 4,000 3.0% Fixed assets 1,000 Total Assets 35,000 Liabilities Retail deposits 25,000 - On call 15,000 0.0% - Term 3mth average 10,000 60% of MIR Corporate deposits 5,000 - On call 3,500 0.1% 1,500 70% of MIR - Term 3mth average Total Liabilities 30,000 Equity Capital 5,000 Total Equity 5,000 Note: This table serves as an input for a completion of the income statement. Market interest rates (IR) are to be populated from the yield curve for specific assets and liabilities and applied IR are to be computed by adding market IR and risk premia. All fields to be filled in are grey in all Tables. Peter Novak, chief risk officer (CRO), also responsible for management control, explains: To make segment performance measurement fair, we account for fund costs in each segment using market costs rather than actual costs. Funds transfer pricing is exercised by our asset liability management team that sits within Treasury and charges a price based on market interest rates to the users of funds and credits accordingly the fund providers. Without such a system in place, Retail would have the cheapest funding because on-call deposits, raised by Retail, currently carry no interest rate. These on- call deposits would distort the prices that need to be charged on retail loans to cover for credit and liquidity risk. The cost of funding depends on the length of time until maturity of the funds. The longer the maturity, the greater the risk, so the higher the interest rate. Banks raise deposits with shorter maturities and originate loans with longer IMA EDUCATIONAL CASE JOURNAL VOL. 14, NO. 2, ART. 1, JUNE 2021 2021 IMA Applied IR Transfer prices maturities and, therefore, benefit from the difference in the interest rates between short- term borrowing and long-term lending. This is called maturity transformation. Short- and long-term market interest rates are presented in a yield curve in Figure 2. The effect of maturity transformation is a major revenue source in any bank. This effect in our current transfer pricing system is shown in Treasury, although technically it is not a result of this segment's performance on the market but of the entire bank. The effect of maturity transformation reconciles the group performance with the sum of the bank's segments' performance. In our current transfer pricing system, we also cover for estimated credit risk of our portfolio and for operating costs by applying risk premiums on top of the market interest rates when calculating our transfer prices. Figure 2. Yield Curve Representing Different Market Interest Rates for Various Maturities 6.00% 5.00% 4.00% 3.00% 2.00% 1.00% Years to maturity 0.00% 0.00 2.00 4.00 6.00 8.00 10.00 12.00 Table 2. A Detailed Breakup of Market Interest Rates for Different Maturities Term Days Years FTP o 1 0.00 1.00% 1m 30 0.08 1.40% 3m 91 0.25 1.70% 6m 183 0.50 2.00% ly 365 1.00 2.30% 2y 730 2.00 2.90% 3y 1095 3.00 3.40% 5y 1825 5.00 4.00% 10y 3650 10.00 5.00% IMA EDUCATIONAL CASE JOURNAL VOL. 14, NO. 2, ART. 1, JUNE 2021 2021 IMA Table 1 column 3 presents risk premia that are on average applied on top of the yield curve for each portfolio to cover their respective credit risk and operating costs. For example, a loan with a five- year maturity has a market interest rate of 4%, risk premium of 1.5%, and its total interest rate is 5.5% charged to customers. Securities have a return equal to triple A investments on the market. For deposits, clients usually do not receive market interest rates since banks incur significant operating cost to collect the deposits. In the Eurozone, the deposit interest rates could be as low as zero or even negative. Adriatic Bank Group pays 0% for on-call deposits to its clients in the retail segment and 0.1% for on-call deposits to its corporate clients. For its term deposits of three months, it pays 60% and 70% of the market interest rates, respective to retail and corporate clients as indicated in column 3 of Table 1. COST ALLOCATION Although funding is a major cost for a financial institution, operating costs are not trivial and have to be assigned to segments, too. For services such as IT (information technology) or HR (human resources), the allocation of costs is quite straightforward, as the cost objects for which a service is provided are well known. Some costs, on the other hand, are more difficult to assign to cost objects and segments. Examples of these more difficult costs to allocate include marketing costs, risk management costs, and regulatory compliance costs. There are multiple ways of allocating these costs and the choice of how these costs are allocated is critical, as this decision will impact each segment's performance. Operating costs can be allocated to segments using many different cost drivers. For simplification in this case, labor costs are assigned using the number of employees as a cost driver and square meters of office space as a cost driver for depreciation. Also, general and administration costs are assigned using the segments' portfolio volume. Every bank accounts for expected losses on loan portfolios, i.e., the possibility that its loans may not be repaid in full. Estimations of life-time losses of loans are called impairments or loan-loss provisions. They are allocated directly to the segments. Corporate loans are impaired at 1% of their gross value and corporate overdrafts at 1.2% of their gross value. In the retail segment, long-term loans are impaired at 1.7% of their gross value, and overdrafts are impaired at 2.5% of their gross value. Due to the high quality of the investment grade bonds in the Treasury segment, it is estimated that no impairments are needed in this period. Profitability Measurement Peter: Our method to establish profitability of each segment is the following: a segment earns money on lending to its clients at a rate higher than the market rate at which this bank can obtain funds on the market. We calculate the revenues of a segment as interest earned minus the bank's market rate for borrowing the funds. The market rates can be seen from the yield curve. But a segment also earns money on deposits from its clients by paying its clients less than if those funds were borrowed on the market at a market rate. This difference represents opportunity revenues and is calculated as the market rate minus the actual interest paid. Our Treasury manages the process of allocating funds across the bank's segments, Retail and IMA EDUCATIONAL CASE JOURNAL VOL. 14, NO. 2, ART. 1, JUNE 2021 @2021 IMA Corporate. Basically, it lends funds to Retail and Corporate at market rates and borrows from them at market rates. Thus, we capture the effects of maturity transformation in Treasury. In the last meeting of the board of directors, the chairwoman of the audit committee, Mira Vauda, questioned the logic of the current transfer pricing system using market rates. She asked Peter: Despite raising such a large volume of cheap funding and earning the highest interest rates on originated loans, Retail seems to be the least profitable segment of the bank. That cannot be correct. Although it is very labor intensive, I'd like you to explain to the board how the funds transfer prices are established. What is the proportion of Treasury's gross profit achieved due to its investment in securities as compared to the proportion of gross profit achieved from its internal lending to and borrowing from Retail and Corporate? How fair is it to allocate the entire effect of maturity transformation to Treasury? Peter explains: We have conscientiously applied best practices to develop what we think is the most appropriate principle of funds transfer pricing using market rates that optimizes the use of funds in all segments. If we used actual cost of funds rather than market rates (opportunity costs) in the current low interest rate environment, Retail would provide EUR 14 billion (USD 17.1 billion) to the Corporate segment at 0% interest rate. In other words, Corporate would not pay for its funds and the positive effect of low interest rates would be entirely. attributed to Corporate (see Figure 3A). Corporate may choose to then charge customers less for borrowing than the market interest rate, and the bank would be missing out on profits and not covering the cost of operations and credit risk. Under the current transfer pricing system, the positive effect of maturity transformation is allocated to Treasury, despite being the result of Retail and Corporate lending and borrowing operations (see Figure 3B). The current transfer pricing system influences the volume and the terms on which the different business lines trade in the market. By using market rates plus a markup, the current system ensures an optimal product mix at optimal pricing, and I believe we have it right. It gives a threshold to managers in Retail with respect to the minimum price they can charge on loans granted to cover costs and ensure the bank is not missing out on profits it could receive by trading in the market rather than internally transferring funds. Given that Retail borrows funds at 0% without a clear transfer price, they could think that they make a profit on any loans granted at any rate higher than 0%. Transfer pricing ensures that the funds cost in each segment are based on market prices. The managers of segments need to understand what the opportunity cost is to borrow from another segment and the opportunity income from lending to another segment. Only the return above the opportunity income is what their segment individually contributes to the overall profit of the bank. We are aware that compared to using the actual cost of funds, the use of the current transfer pricing system that captures the effect of maturity transformation in Treasury could be IMA EDUCATIONAL CASE JOURNAL VOL. 14, NO. 2, ART. 1, JUNE 2021 2021 IMA de-motivational for the managers and employees in Retail. They could perceive that the allocation is a subjective managerial decision and unfairly prejudices their segments profit. What is vital is that we give them a comprehensive picture of the funds transfer pricing logic from the bank's perspective. To ensure that we avoid the potential demotivating effects, it is important that for the segment's evaluation their performance is measured against the budget, their volume of loans and interest rates offered compared to transfer prices rather than the absolute outcomes. We will present the board with the breakdown of Treasury profitability into maturity transformation and its actual return on the market, and we can, in the future, present segment reporting in such detail to guard against the demotivational effects of the current transfer pricing system." Figure 3. The Effect of Funds Transfer Prices on Profitability of Each Sector and Allocation of Maturity Transformation A. The effects on segment profitability without a transfer pricing system Clients deposits lends funds at 0% Retail Corporate borrowed at 0% interest rate Loans to clients at risk- adapted interest rates, for instance, 5.4%, Return 0% 5.4% of return recognized in Corporate 5.4% return for the bank B. The effects on segment profitability with a transfer pricing system The 2.4% return recognized in Treasury lends funds to Treasury at lends funds to Corporate at 3.4% 1% for on call deposits Loans to Clients' deposits borrowed at 0% interest. Corporate Retail Return 1% clients at risk- adapted interest rates, e.g. 5.4 % rate 5.4% return for the bank Note: The figure refers to Peter's explanation to chairwoman of the audit committee and for surplus funds that Retail lends to Corporate. Without transfer prices, the entire return on lending would go to Corporate. With the transfer prices system, the return is allocated to segments such that each segment recognizes the retum only above market costs for lending and below market costs for borrowing. Retail lends to Treasury at 1%, which is market rate for on-call funds, and Treasury lends these funds to Corporate at 3.4%, which is market rate for borrowing funds of three years maturity. Treasury Return 2% IMA EDUCATIONAL CASE JOURNAL VOL. 14, NO. 2, ART. 1, JUNE 2021 2021 IMA The bank deposits its cash with the central bank and earns the on-call interest rate for it. Total operating costs, depreciation, and impairment are included in the income statement. The bank earned EUR 250 million of net fees and commissions in the Corporate segment and EUR 150 million in the Retail segment. Income tax is 20%. ABOUT IMA (INSTITUTE OF MANAGEMENT ACCOUNTANTS) IMA, the association of accountants and financial professionals in business, is a global professional association focused exclusively on advancing the management accounting profession. IMA supports the profession through research, teaching cases, the CMA (Certified Management Accountant) program, continuing education, networking and advocacy of the highest ethical business practices. IMA has a global network of more than 140,000 members in 140 countries and 300 professional and student chapters. For more information, please visit www.imanet.org. IMA EDUCATIONAL CASE JOURNAL VOL. 14, NO. 2, ART. 1, JUNE 2021 2021 IMA Figure 2 0.05 0.04 0,03 0.02 0.01 0.00 0.00 0.08 0.25 0.50 1.00 2.00 3.00 Years to maturity 5.00 10.00 Table 6 Segment Report Financial assets Liabilities Interest income Market (opportunity) Cost of funds (MIR) Interest expense Market (opportunity) Revenues (MIR) Net fees Labour cost General and administration. Depreciation Impairment Gross profit ROA Table 7: Splitting the Treasury Financial assets Liabilities Interest income Market (opportunity) Cost of funds (MIR) Interest expense Market (opportunity) Revenues (MIR) Net fees Labour cost General and administration Depreciation Impairment Gross profit ROA Corporate Corporate Retail Retail Treasury Treasury Market Total ALM For Task 6 just delete Opportunity Costs and Revenues and observe the effects on profitability. What do you see? Which system is better? Total Case Study - ADRIATIC BANK All fields to be filled in are gray in all Tables. To see the notes for some cells, click on the cell with a right click. Table 1 Values in million EUR Actual IR Risk premium Transfer prices Assets Cash 0.0% 1.0% 1,000 5,000 Securities - duration Sy 5.5% N.A. 4.0% Loans 23,000 - Retail Sy average 10,000 5.5% 1.5% 4.0% Corporate 3y 13,000 6.4% 2.0% 3.4% Overdrafts 5,000 - Retail 6mths av 1,000 6.0% 4.0% 2.0% - Corporate 3mths average 4,000 4.7% 3.0% 1.7% Fixed assets 1,000 Total Assets 35,000 Liabilities Retail deposits 25,000 - On call 15,000 0.0% -Term 3mth average 10,000 0.0% 60% of MIR Corporate deposits 5,000 - On call 3,500 0.1% -Term 3mth average 1,500 0.1% 70% of MIR Total Liabilities 30,000 Equity Capital 5,000 5,000 Total Equity MIR... market interest rate Table 3 Corporate Labour costs (values in million of EUR) N. of employees 4,500 Cost rate Cost per segment 88,888 General and administration (in M EUR) Volume of portfolio Cost rate Cost per segment Depreciation and amortization (in M EUR) Office space (square meters) 10,000 Cost rate Cost per segment Retail 6,000 66,666 15,000 Treasury 300 1,333,333 1,000 Total 400 10,800 37,037 130 120 26,000 Table 2 Term o 1m 3m 6m 1y 2y 3y Sy 10y Table 4 Type of loans Loans / Corporate Overdraft / Corporate Loans / Retail Overdraft / Retail Total Table 5 Interest received - Corporate - Retail Securities Cash Interest paid - Corporate - Retail Net fees - Corporate - Retail Labour cost General and administration Depreciation Impairment Gross profit Income tax Net income Days 1 30 91 183 365 730 1095 1825 3650 Volume of loans 13,000 4,000 10,000 1,000 28,000 Years 0.00 0.08 0.25 0.50 1.00 2.00 3.00 5.00 10.00 % of impairment 1.0% 1.2% 1.7% 2.5% FTP 1.00% 1.40% 1.70% 2.00% 2.30% 2.90% 3.40% 4.00% 5.00% Value of impairment Corporate 130 48 Retail 170 25
Step by Step Solution
There are 3 Steps involved in it

Get step-by-step solutions from verified subject matter experts


