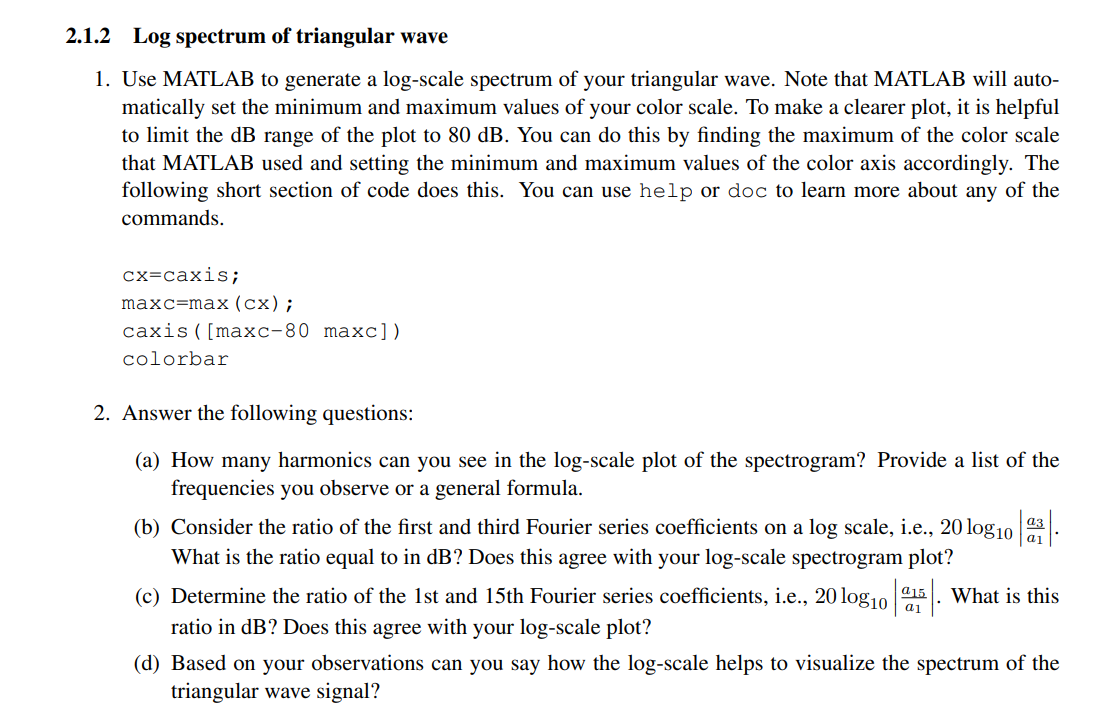
please help with the code and the questions under it , thanks ,

2.1.2 Log spectrum of triangular wave 1. Use MATLAB to generate a log-scale spectrum of your triangular wave. Note that MATLAB will auto- matically set the minimum and maximum values of your color scale. To make a clearer plot, it is helpful to limit the dB range of the plot to 80 dB. You can do this by finding the maximum of the color scale that MATLAB used and setting the minimum and maximum values of the color axis accordingly. The following short section of code does this. You can use help or doc to learn more about any of the commands. cx=caxis; maxc=max (cx); caxis ( [maxc-80 maxc]) colorbar 2. Answer the following questions: (a) How many harmonics can you see in the log-scale plot of the spectrogram? Provide a list of the frequencies you observe or a general formula. (b) Consider the ratio of the first and third Fourier series coefficients on a log scale, i.e., 20 log10 lat - What is the ratio equal to in dB? Does this agree with your log-scale spectrogram plot? (c) Determine the ratio of the 1st and 15th Fourier series coefficients, i.e., 20 log10 What is this ratio in dB? Does this agree with your log-scale plot? (d) Based on your observations can you say how the log-scale helps to visualize the spectrum of the triangular wave signal? 015 ai 2.1.2 Log spectrum of triangular wave 1. Use MATLAB to generate a log-scale spectrum of your triangular wave. Note that MATLAB will auto- matically set the minimum and maximum values of your color scale. To make a clearer plot, it is helpful to limit the dB range of the plot to 80 dB. You can do this by finding the maximum of the color scale that MATLAB used and setting the minimum and maximum values of the color axis accordingly. The following short section of code does this. You can use help or doc to learn more about any of the commands. cx=caxis; maxc=max (cx); caxis ( [maxc-80 maxc]) colorbar 2. Answer the following questions: (a) How many harmonics can you see in the log-scale plot of the spectrogram? Provide a list of the frequencies you observe or a general formula. (b) Consider the ratio of the first and third Fourier series coefficients on a log scale, i.e., 20 log10 lat - What is the ratio equal to in dB? Does this agree with your log-scale spectrogram plot? (c) Determine the ratio of the 1st and 15th Fourier series coefficients, i.e., 20 log10 What is this ratio in dB? Does this agree with your log-scale plot? (d) Based on your observations can you say how the log-scale helps to visualize the spectrum of the triangular wave signal? 015 ai


