Question
Please help with this problem set. Please show the work as well. Attached is the data set. Thank you so very much. Thecarsdata include demand
Please help with this problem set. Please show the work as well. Attached is the data set. Thank you so very much.
The"cars"data include demand for passenger cars in the United States from 1971 to 1986.Estimate the following model using the"cars"data attached:
where
= the demand for passenger cars (years ranging from 1971 to 1986)
= new cars consumer price index
= consumer price index
= personal disposable income (measured in billions of dollars)
= interest rate
= employed civilian labor force (measured in thousands of individuals)
First, please estimate, examine, and interpret the model. Put emphasis on the model's coefficient of determination, mean squared error, and parameter coefficients. Finally, is there multicollinearity in this problem? How do you know?
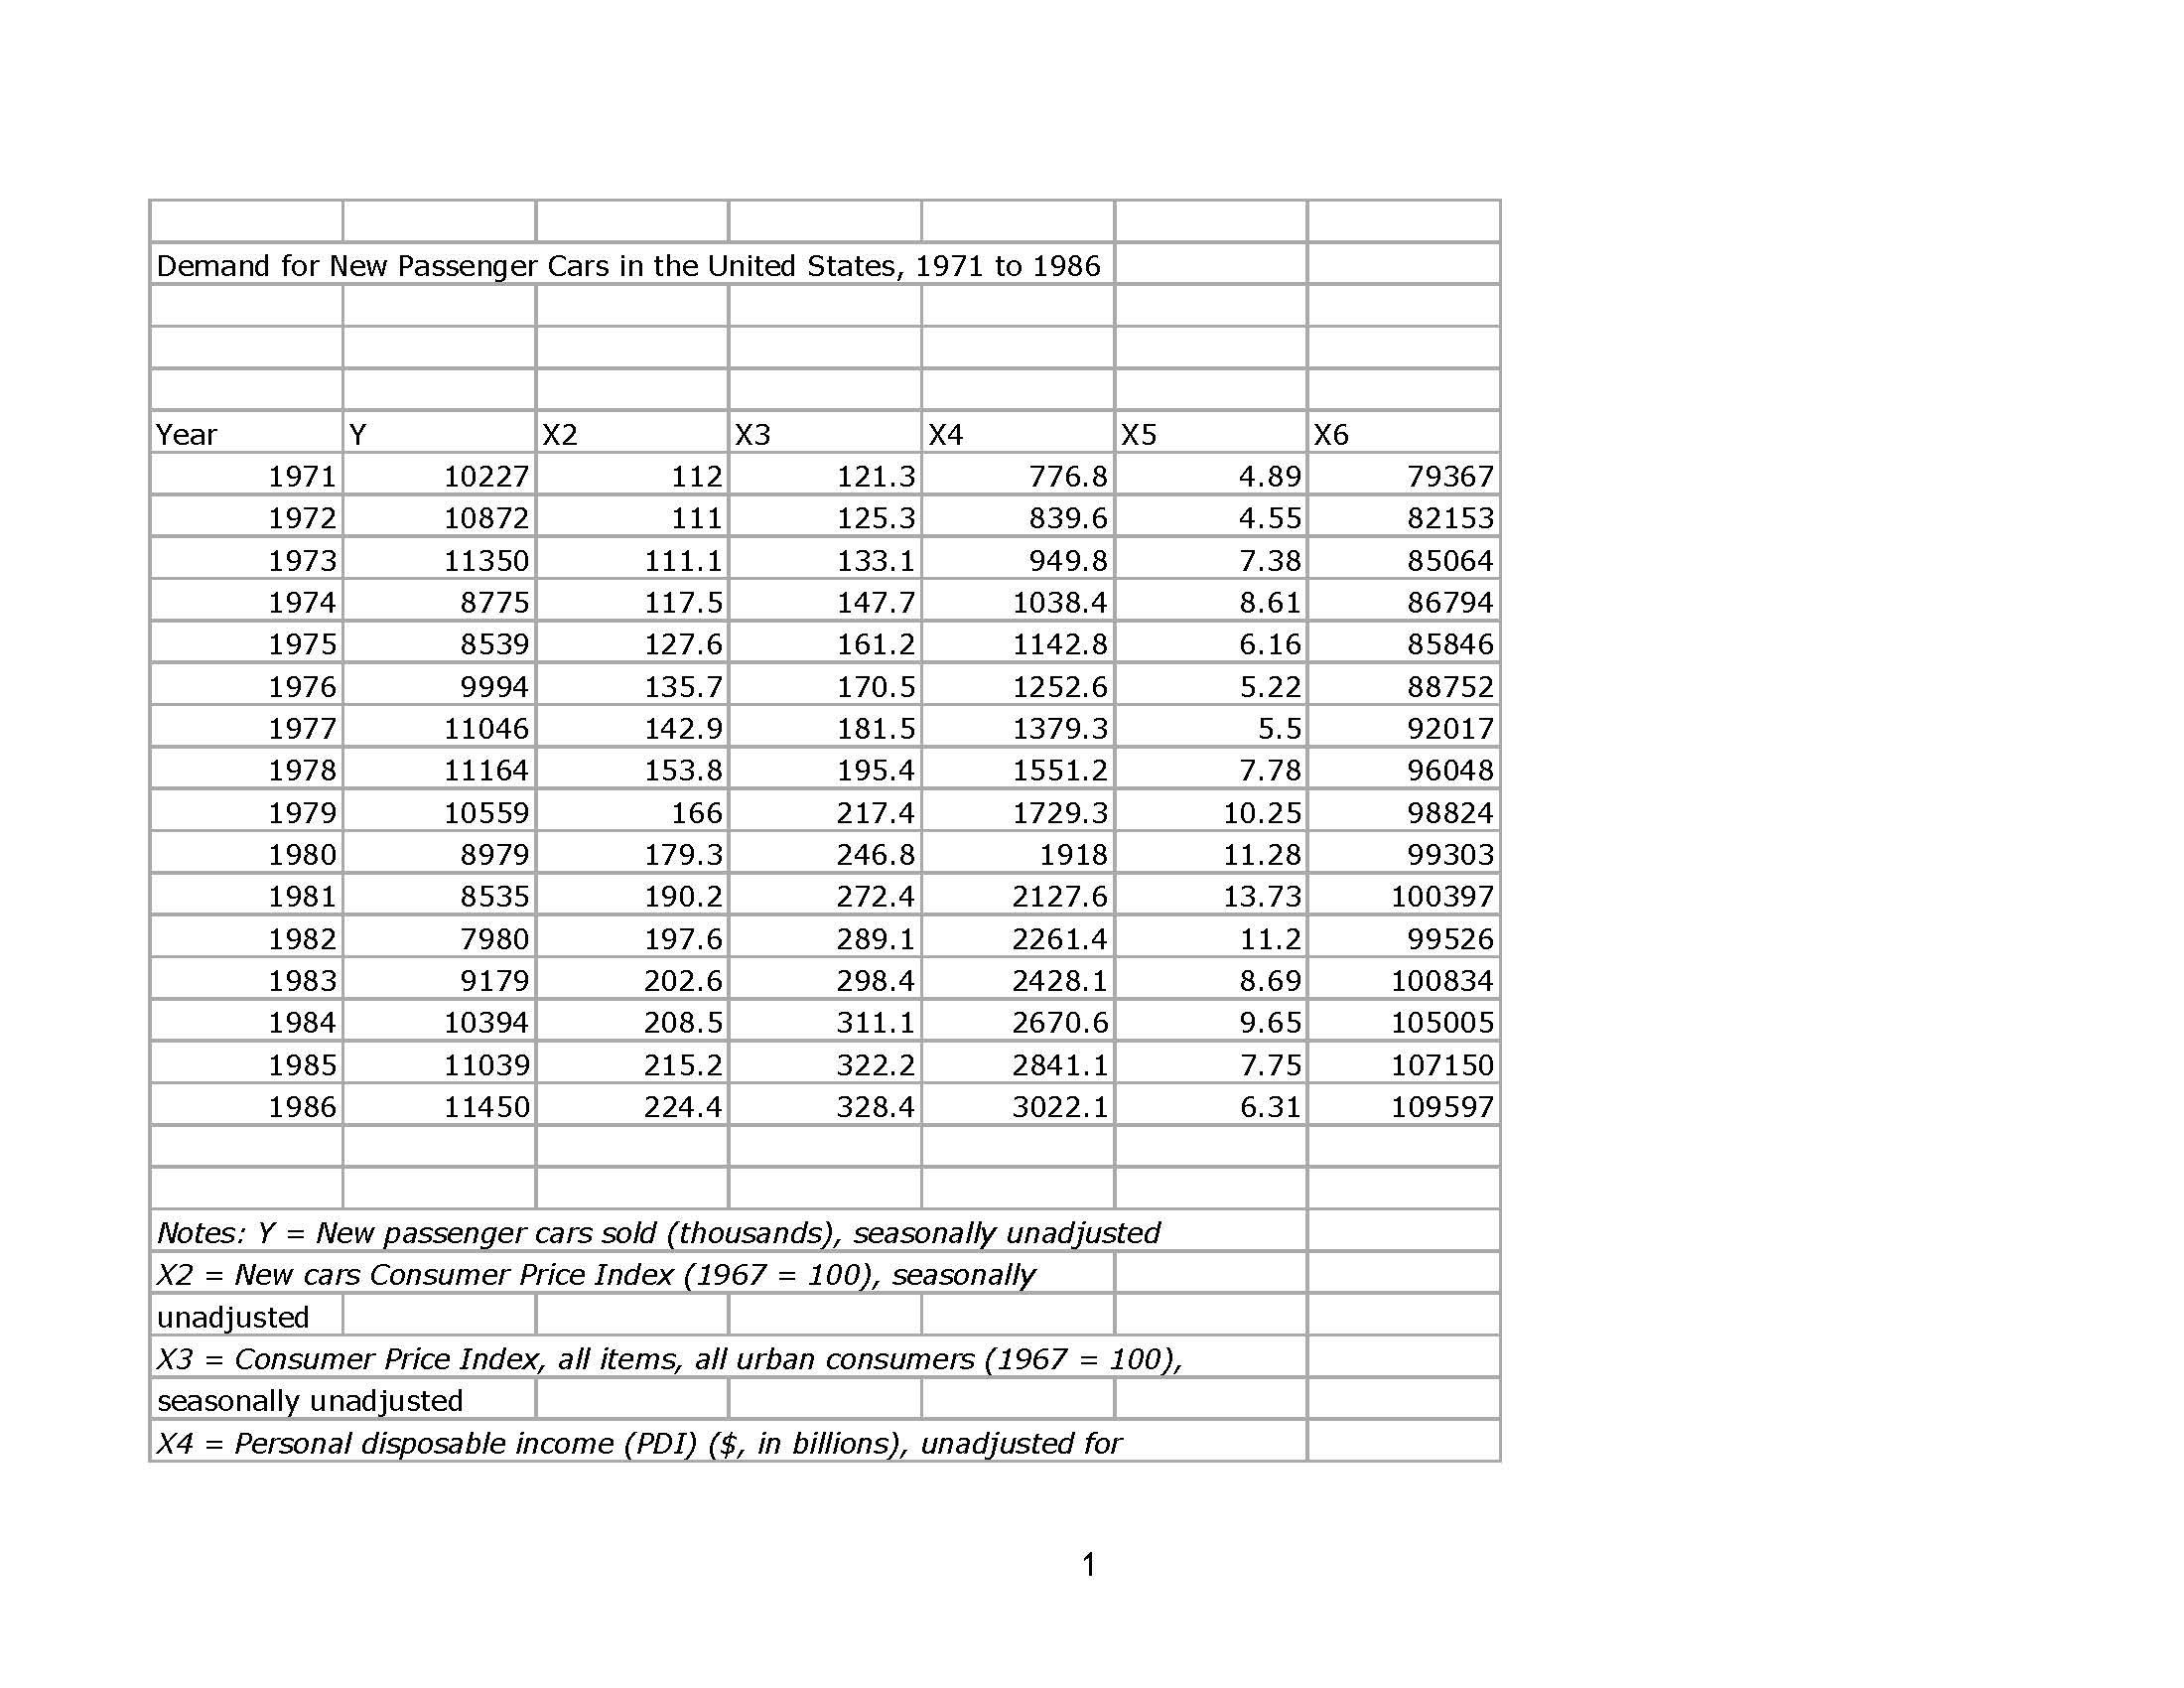
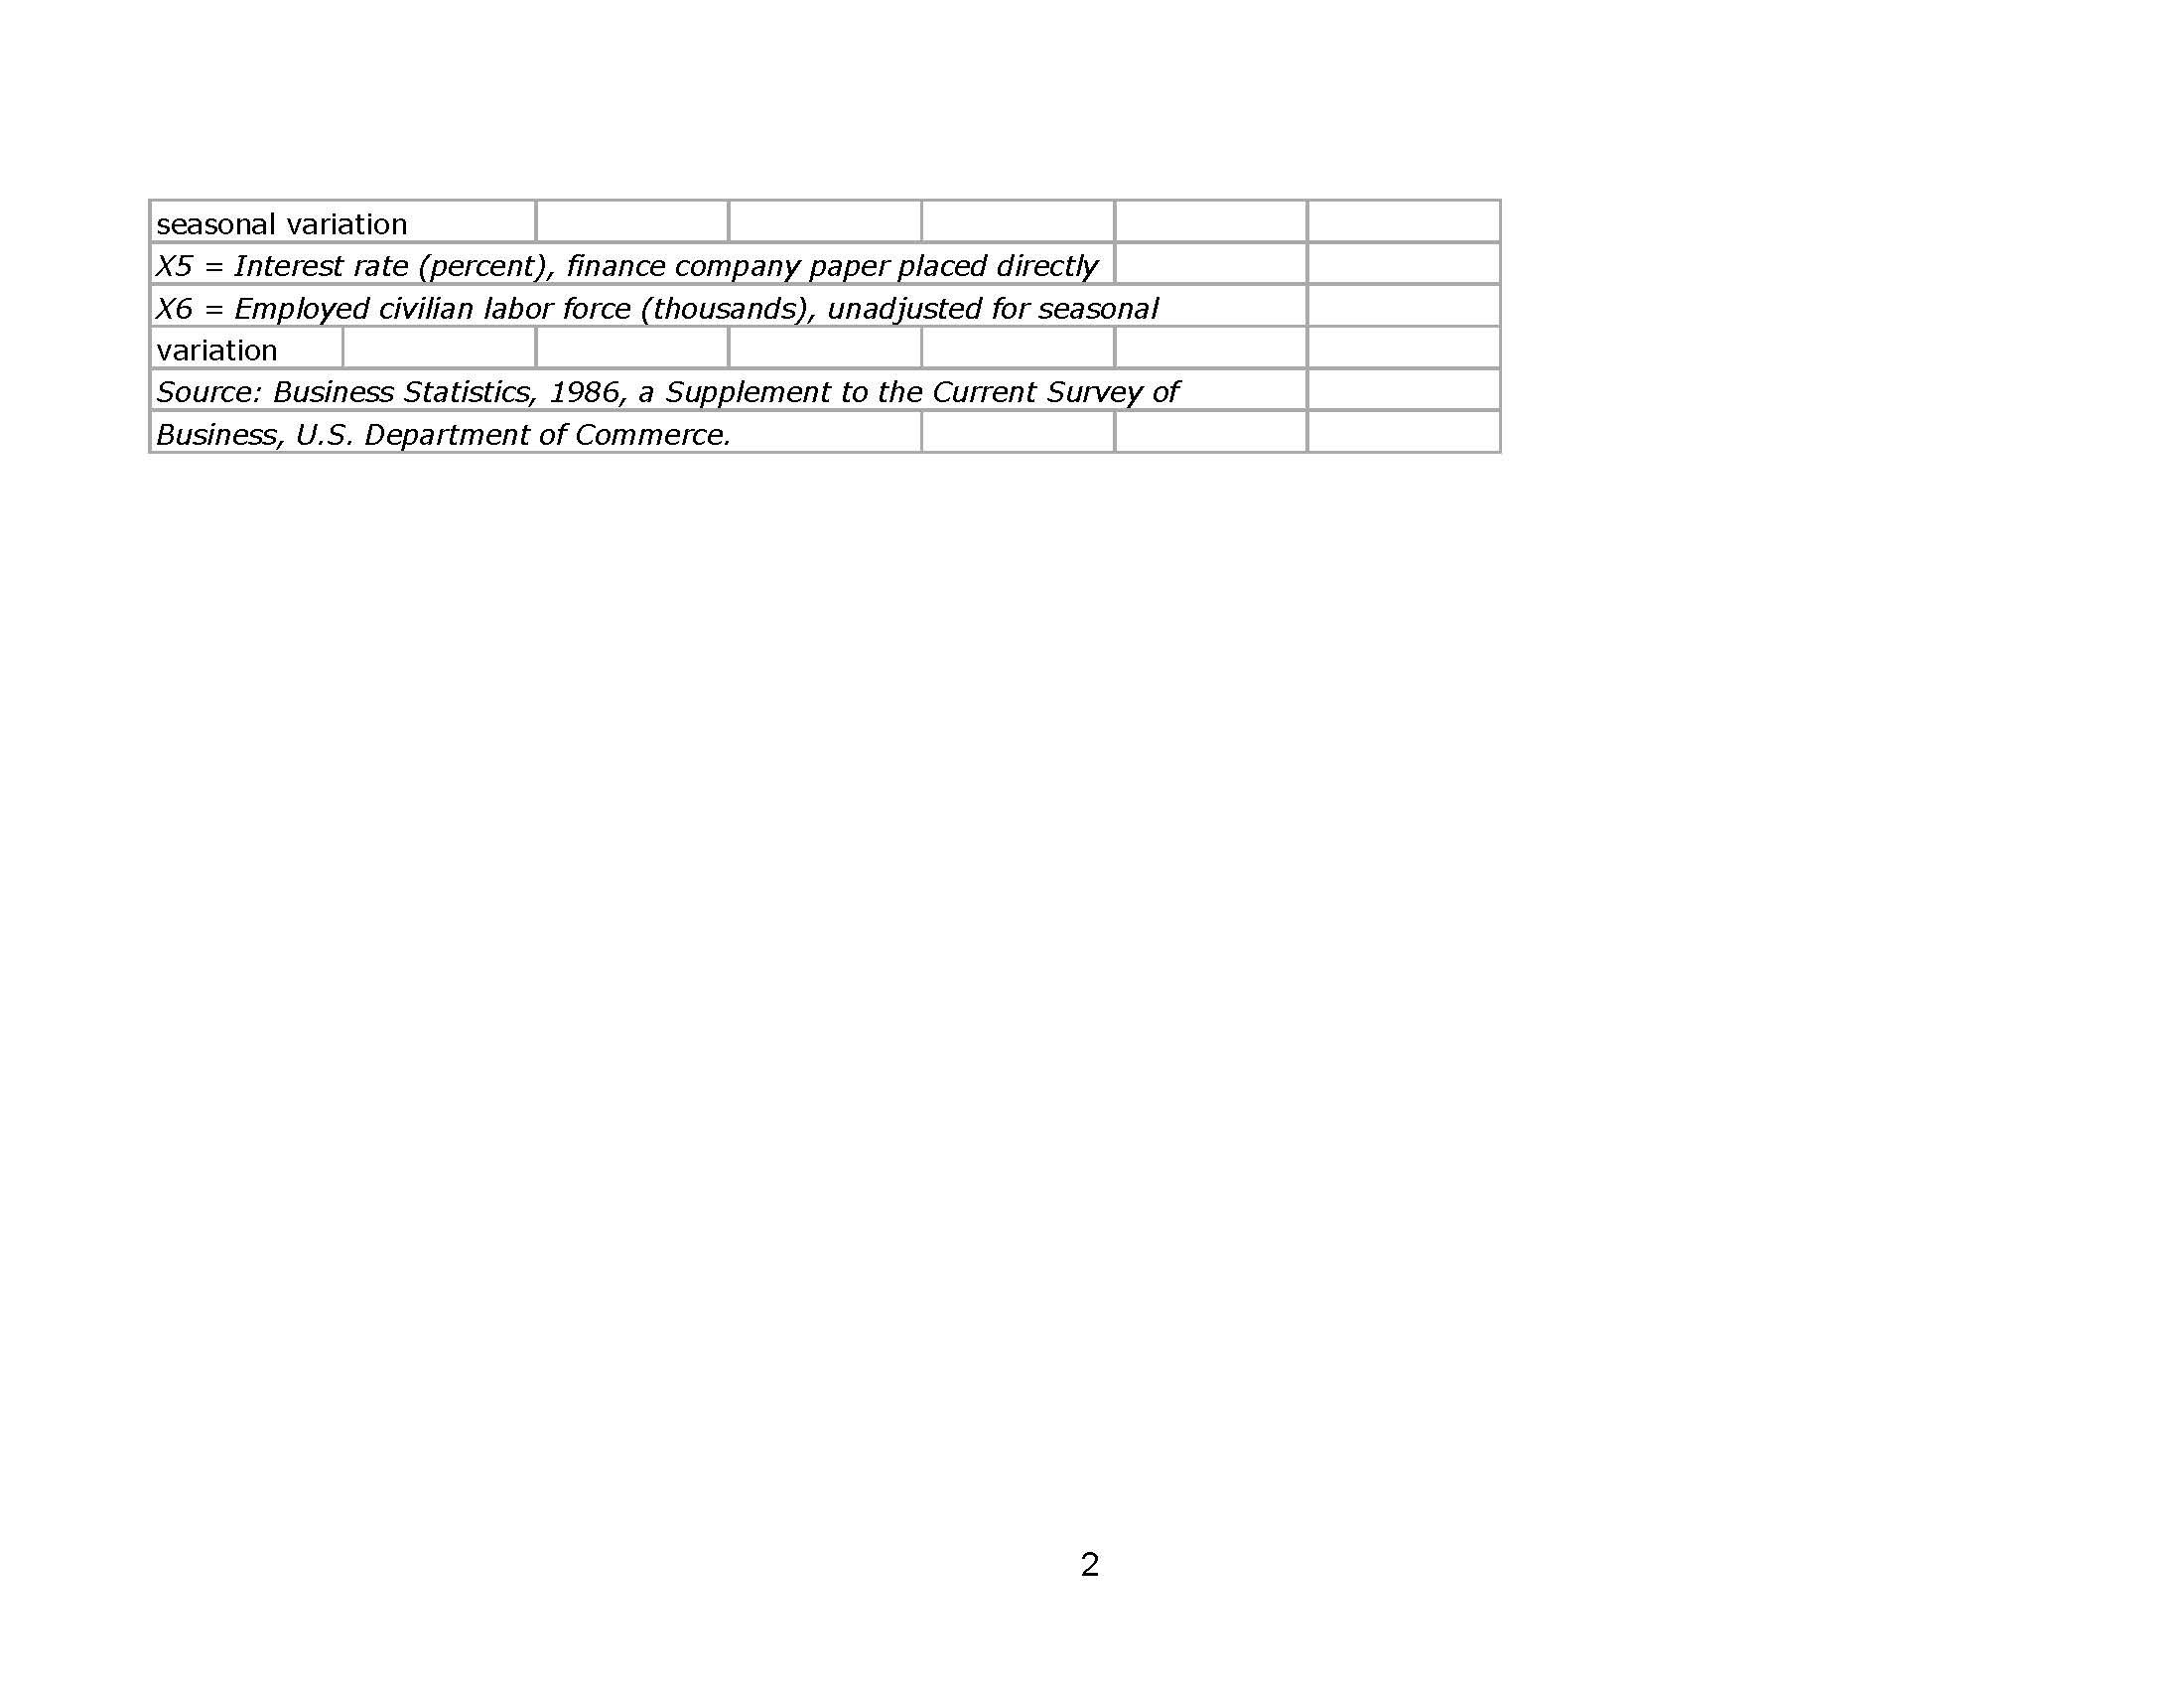
Demand for New Passenger Cars in the United States, 1971 to 1986 Year Y X2 X3 X4 X5 X6 1971 10227 112 121.3 776.8 4.89 79367 1972 10872 11 1 125.3 339.6 4.55 82153 1973 11350 111.1 133.1 949.8 7.38 85064 1974 8775 117.5 147.7 1038.4 8.61 86794 1975 8539 127.6 161.2 1142.8 6.16 85846 1976 9994 135.7 170.5 1252.6 5.22 88752 1977 11046 142.9 181.5 1379.3 5.5 92017 1978 11164 153.8 195.4 1551.2 7.78 96048 1979 10559 166 217.4 1729.3 10.25 98824 1980 3979 179.3 246.8 1918 11.28 99303 1981 8535 190.2 272.4 2127.6 13.73 100397 1982 7980 197.6 289.1 2261.4 11.2 99526 1983 9179 202.6 298.4 2428.1 8.69 100834 1984 10394 208.5 311.1 2670.6 9.65 105005 1985 11039 215.2 322.2 2841.1 7.75 107150 1986 11450 224.4 328.4 3022.1 6.31 109597 Notes: Y = New passenger cars sold (thousands), seasonally unadjusted X2 = New cars Consumer Price Index (1967 = 100), seasonally unadjusted X3 = Consumer Price Index, all items, all urban consumers (1967 = 100), seasonally unadjusted X4 = Personal disposable income (PDI) ($, in billions), unadjusted forseasonal variation X5 = Interest rate (percent), finance company paper placed directly X6 = Employed civilian labor force (thousands), unadjusted for seasonal variation Source: Business Statistics, 1986, a Supplement to the Current Survey of Business, U.S. Department of CommerceStep by Step Solution
There are 3 Steps involved in it
Step: 1
Get Instant Access to Expert-Tailored Solutions
See step-by-step solutions with expert insights and AI powered tools for academic success
Step: 2
Step: 3
Ace Your Homework with AI
Get the answers you need in no time with our AI-driven, step-by-step assistance
Get Started