

Answered step by step
Verified Expert Solution
Question
1 Approved Answer
Please help with this question and all the requirements. Thank You! Please include formula and calculation. Thanks Score: 0 of 10 pts 3 of 4
Please help with this question and all the requirements. Thank You!
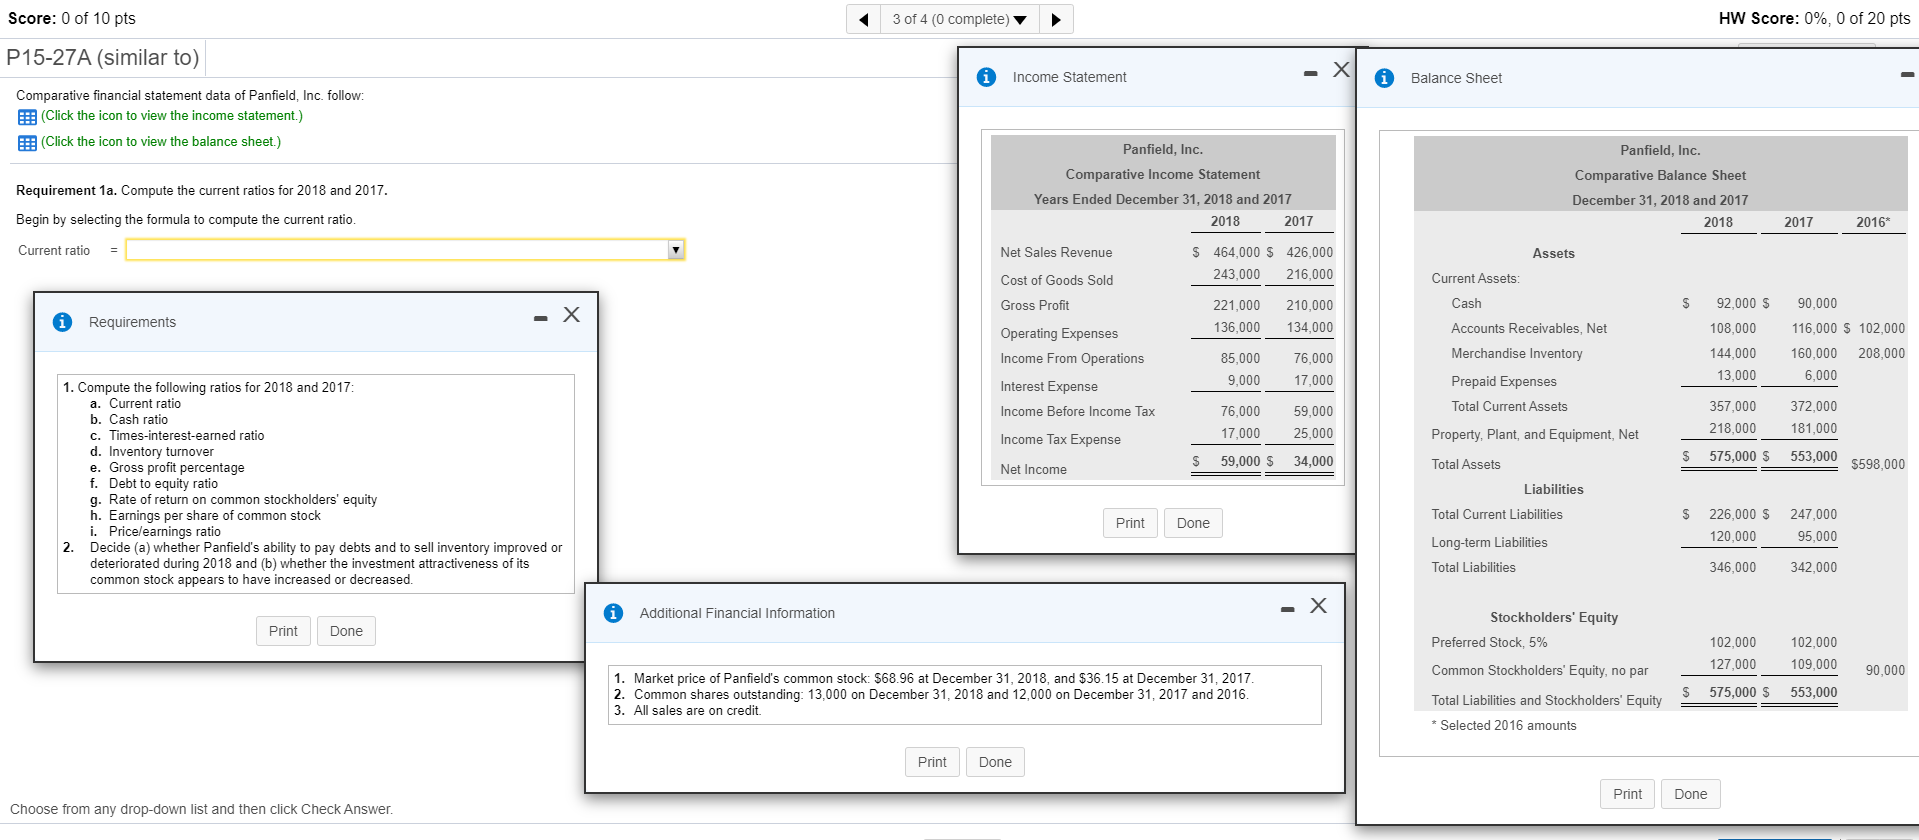 Please include formula and calculation. Thanks
Step by Step Solution
There are 3 Steps involved in it
Step: 1

Get Instant Access to Expert-Tailored Solutions
See step-by-step solutions with expert insights and AI powered tools for academic success
Step: 2

Step: 3
Ace Your Homework with AI
Get the answers you need in no time with our AI-driven, step-by-step assistance
Get Started
ISE International Accounting
Authors: Timothy Doupnik, Mark Finn, Giorgio Gotti, Hector Perera
5th Edition
1260547981, 9781260547986