Please help with this question, struggling to find answer
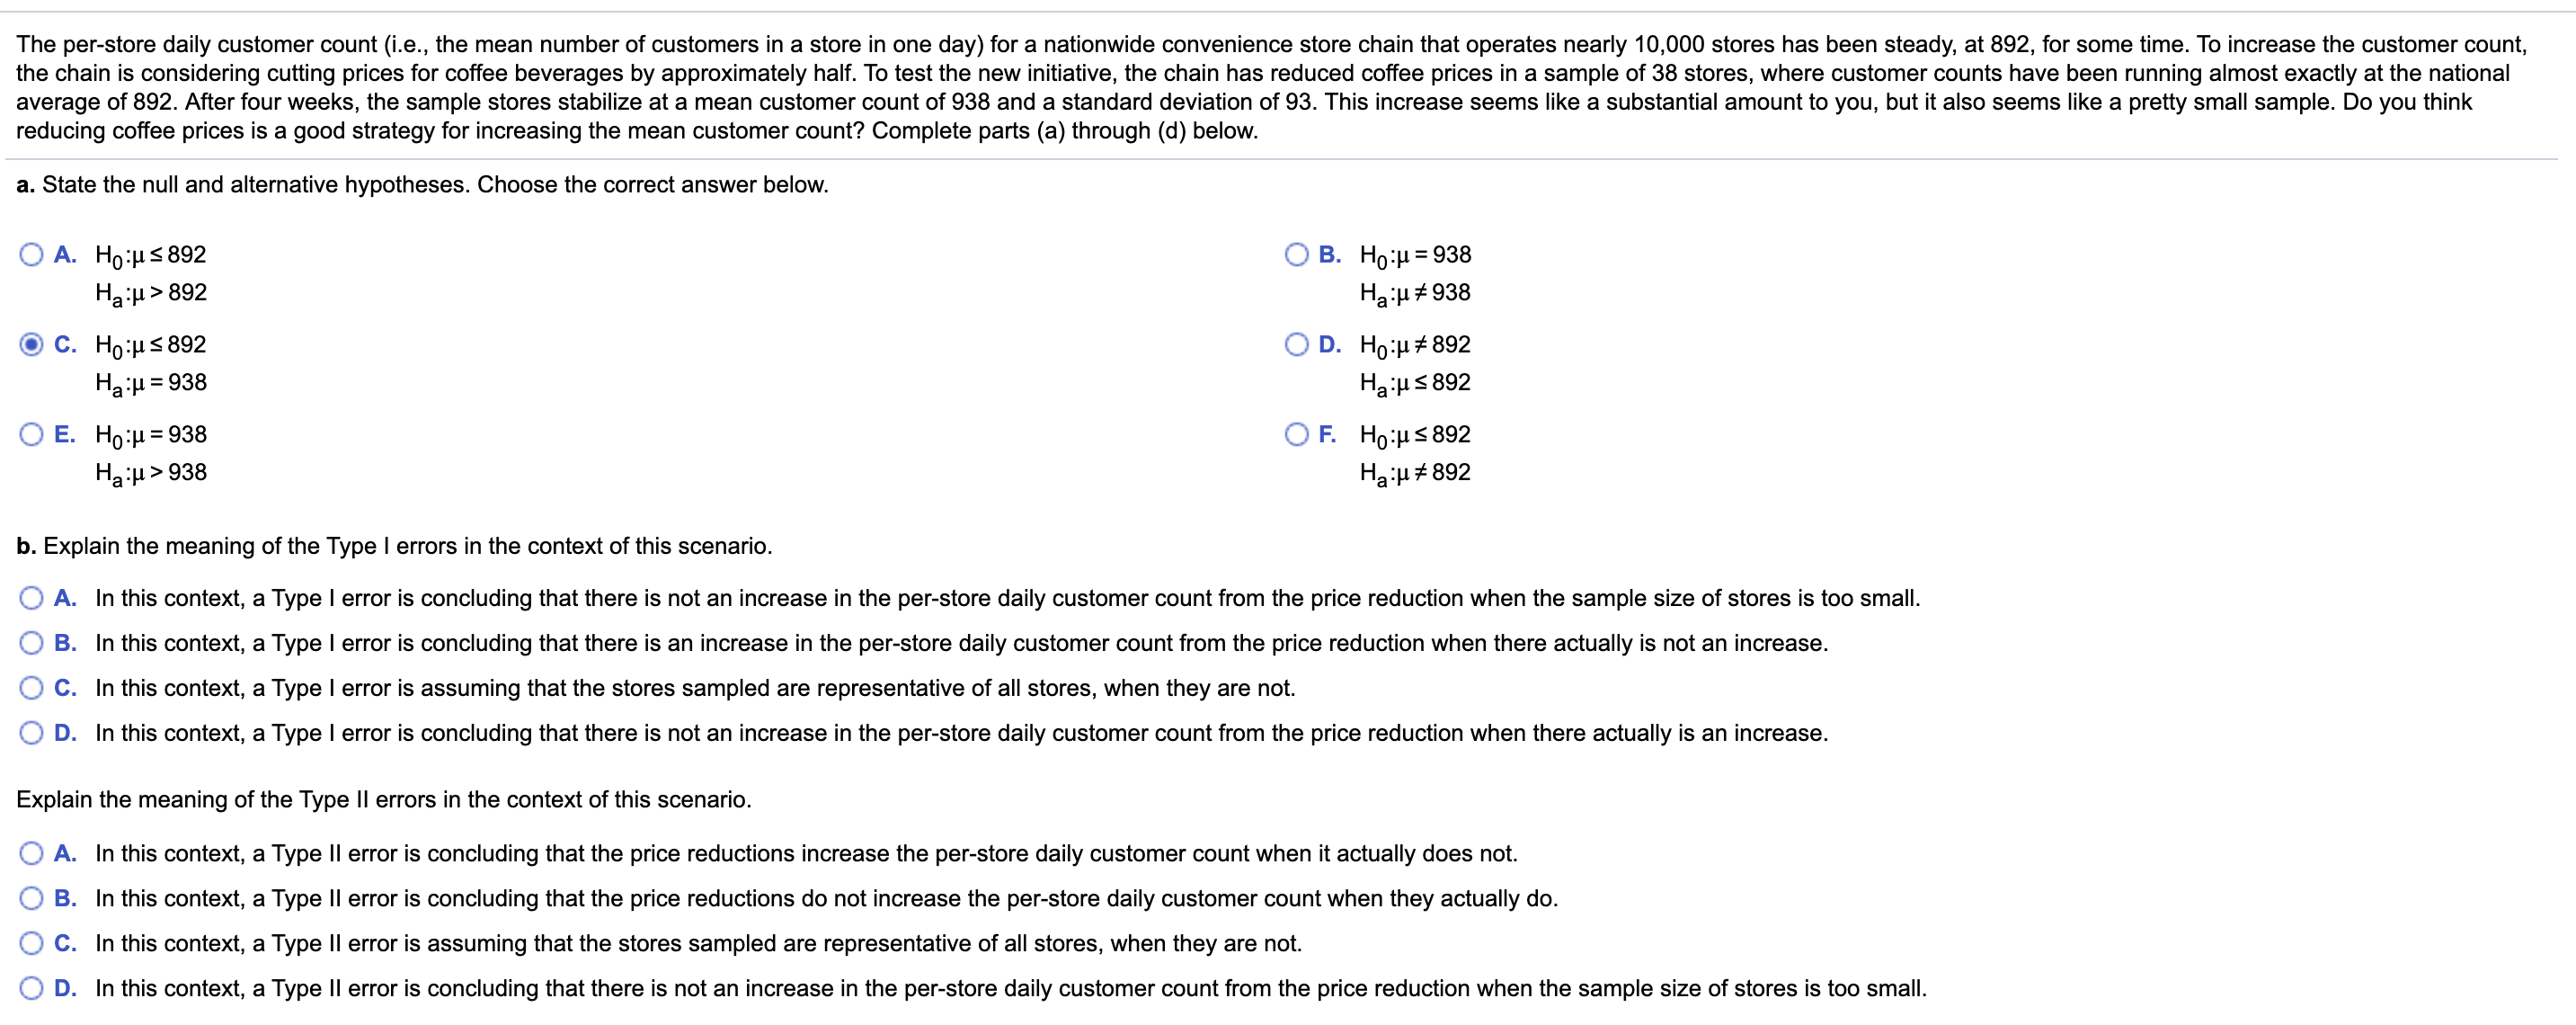
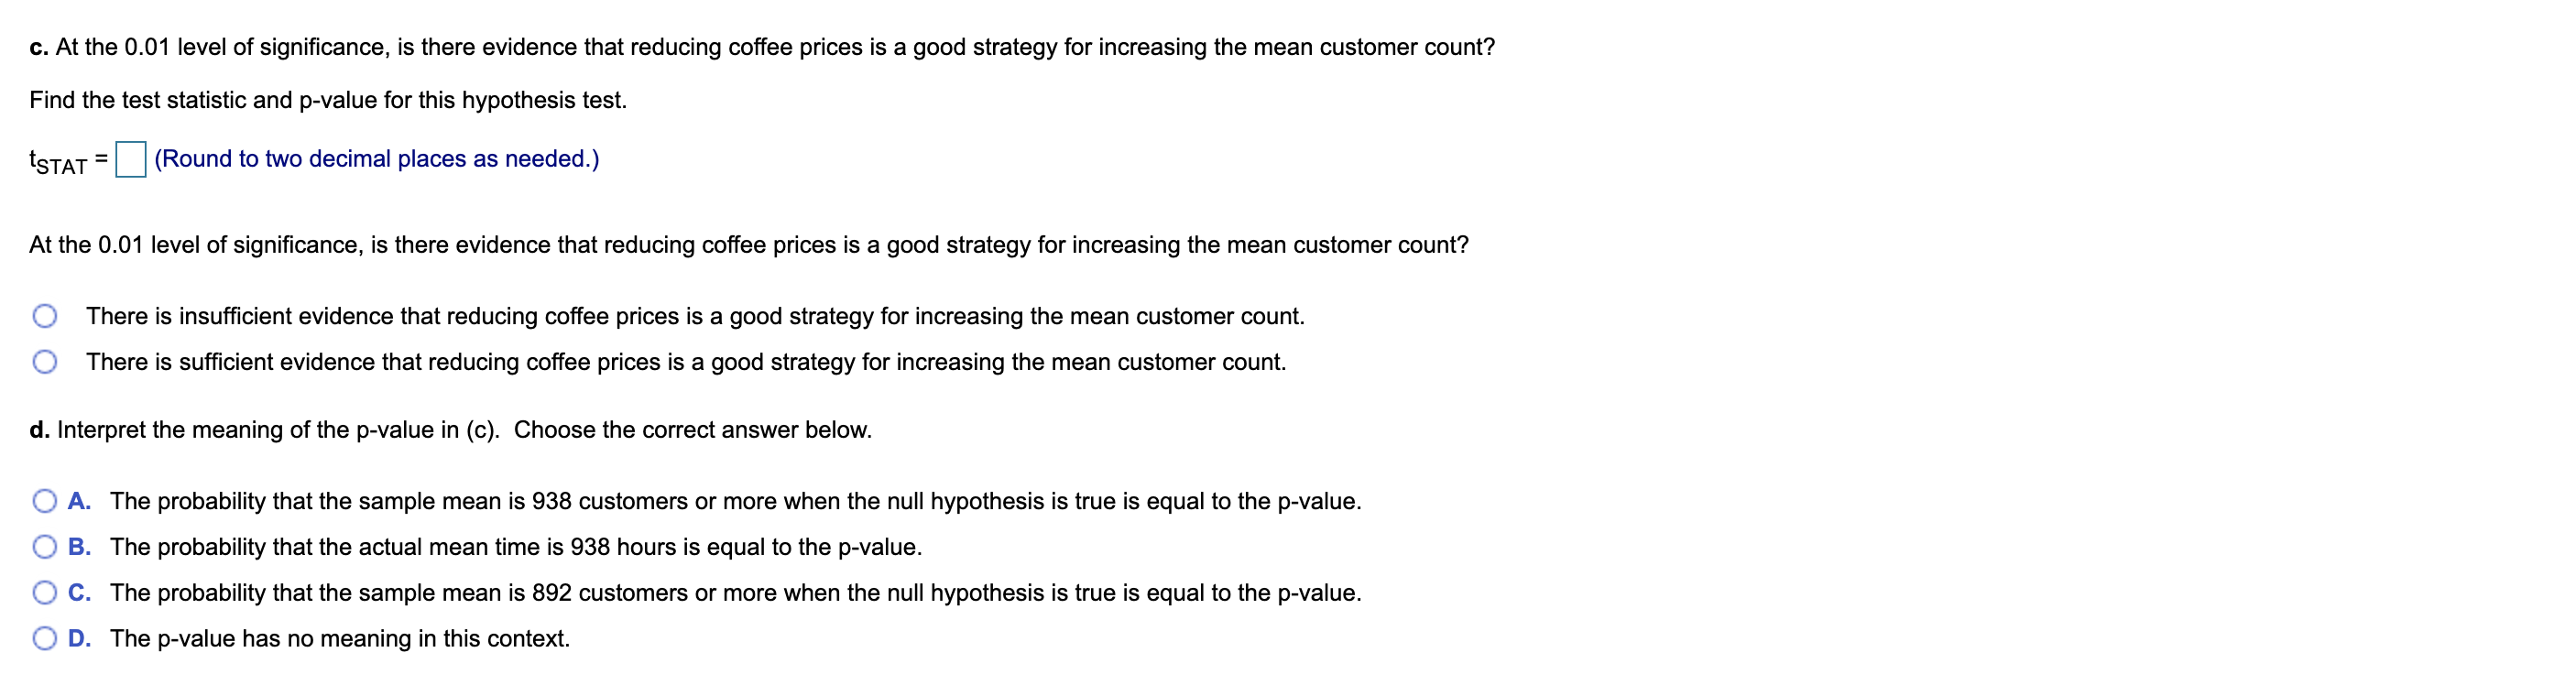
The per-store daily customer count (i.e., the mean number of customers in a store in one day) for a nationwide convenience store chain that operates nearly 10,000 stores has been steady, at 892, for some time. To increase the customer count, the chain is considering cutting prices for coffee beverages by approximately half, To test the new initiative, the chain has reduced coffee prices in a sample of 38 stores, where customer counts have been running almost exactly at the national average of 892. After four weeks, the sample stores stabilize at a mean customer count of 938 and a standard deviation of 93. This increase seems like a substantial amount to you, but it also seems like a pretty small sample. Do you think reducing coffee prices is a good strategy for increasing the mean customer count? Complete parts (a) through (d) below. a. State the null and alternative hypotheses. Choose the correct answer below. 0 A. H:p5892 o 3. H041: 938 Hazp>892 Ha:p#938 (9 C. HoszSQZ O D. Hozp892 Ha:p=938 Ha:p5892 o E. H:p=938 o F. H:p5892 Ha:p>938 Ha:p892 h. Explain the meaning of the Type I errors in the context of this scenario. O A. In this context, a Type I error is concluding that there is not an increase in the per-store daily customer count from the price reduction when the sample size of stores is too small. 0 B. In this context, a Type I error is concluding that there is an increase in the per-store daily customer count from the price reduction when there actually is not an increase. 0 c. In this context, a Type I error is assuming that the stores sampled are representative of all stores, when they are not. O D. In this context, a Type I error is concluding that there is not an increase in the per-store daily customer count from the price reduction when there actually is an increase. Explain the meaning of the Type II en'ors in the context of this scenario. O A. In this context, a Type II error is concluding that the price reductions increase the perstore daily customer count when it actually does not. 0 B. In this context, a Type II error is concluding that the price reductions do not increase the per-store daily customer count when they actually do. 0 C. In this context, a Type II error is assuming that the stores sampled are representative of all stores, when they are not. O D. In this context, a Type II error is concluding that there is not an increase in the per-store daily customer count from the price reduction when the sample size of stores is too small. c. At the 0.01 level of significance, is there evidence that reducing coffee prices is a good strategy for increasing the mean customer count? Find the test statistic and p-value for this hypothesis test. STAT = (Round to two decimal places as needed.) At the 0.01 level of significance, is there evidence that reducing coffee prices is a good strategy for increasing the mean customer count? O There is insufficient evidence that reducing coffee prices is a good strategy for increasing the mean customer count. O There is sufficient evidence that reducing coffee prices is a good strategy for increasing the mean customer count. d. Interpret the meaning of the p-value in (c). Choose the correct answer below. O A. The probability that the sample mean is 938 customers or more when the null hypothesis is true is equal to the p-value. O B. The probability that the actual mean time is 938 hours is equal to the p-value. O C. The probability that the sample mean is 892 customers or more when the null hypothesis is true is equal to the p-value. O D. The p-value has no meaning in this context