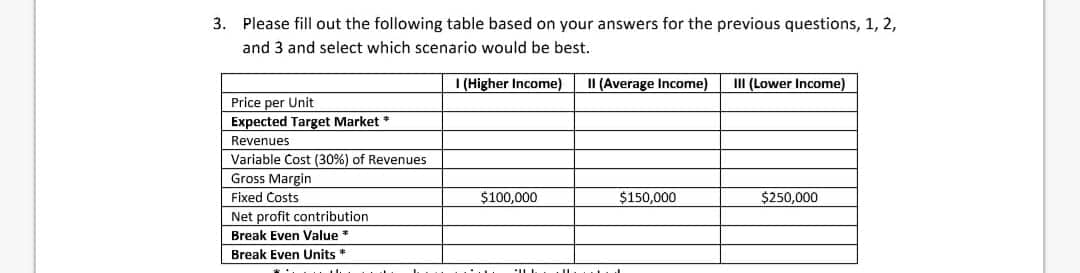
please, how I fill the table?
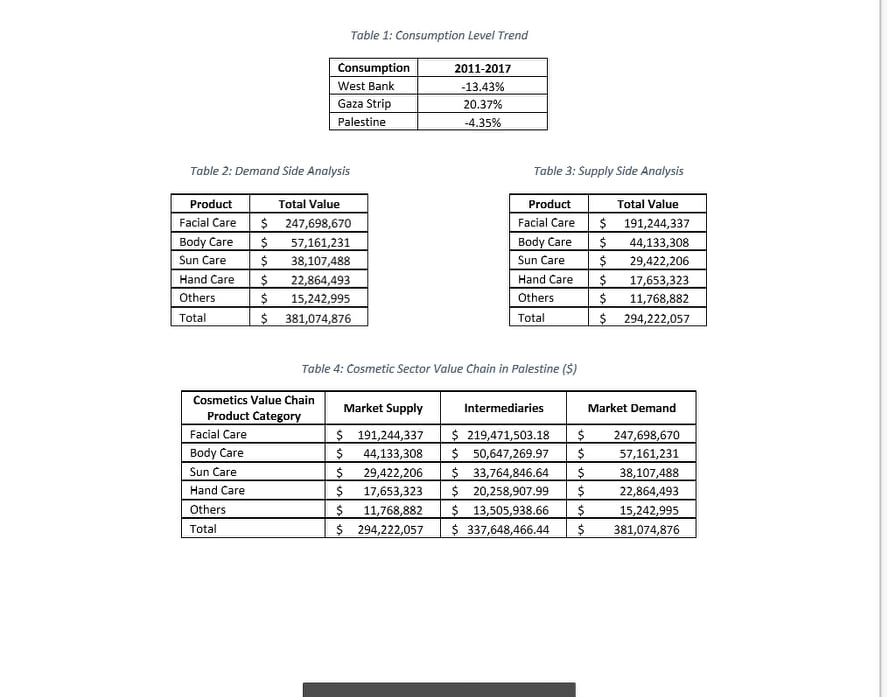
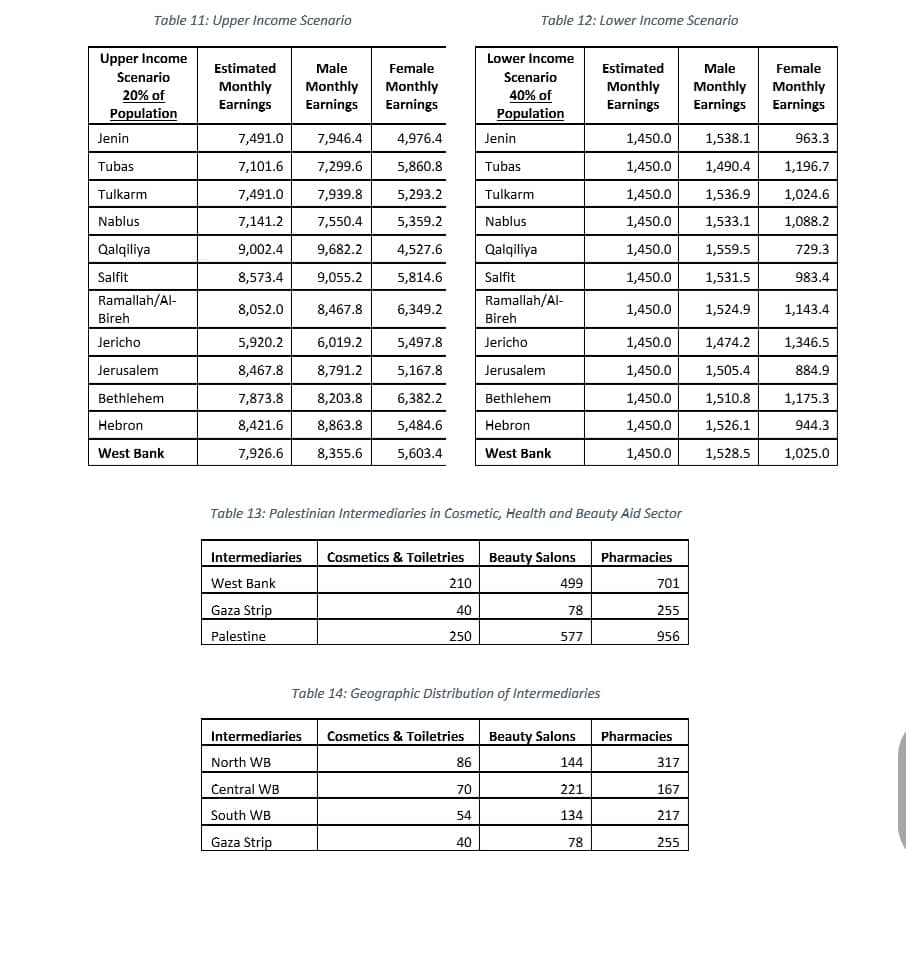
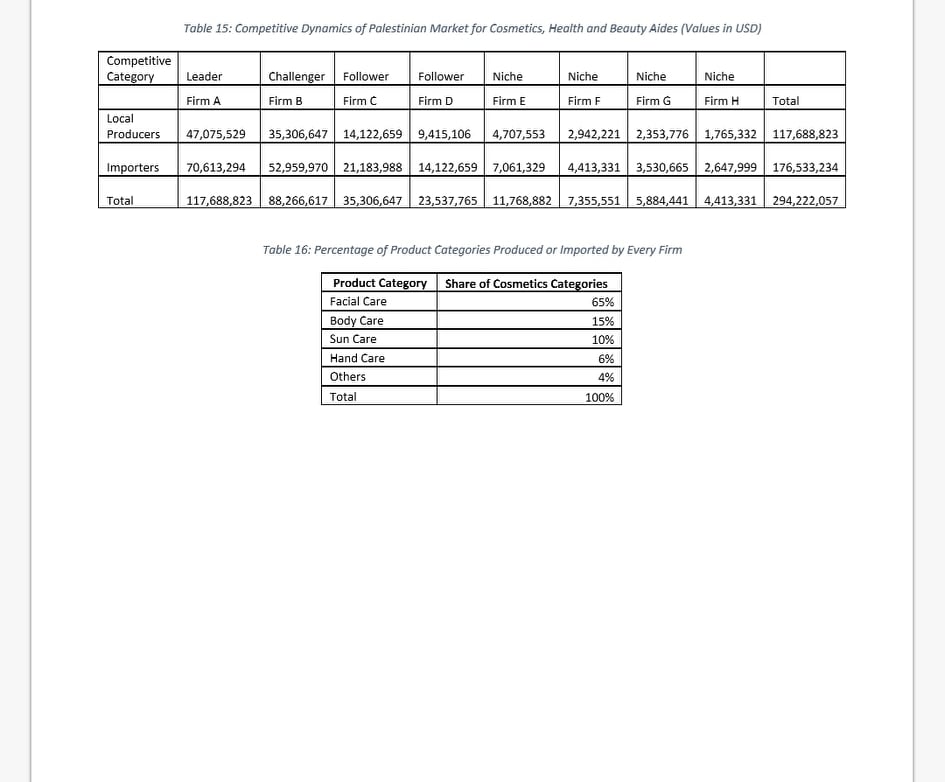
3. Please fill out the following table based on your answers for the previous questions, 1, 2, and 3 and select which scenario would be best. I (Higher Income) II (Average Income) Ill (Lower Income) Price per Unit Expected Target Market * Revenues Variable Cost (30%) of Revenues Gross Margin Fixed Costs $100,000 $150,000 $250,000 Net profit contribution Break Even Value Break Even Units *Table 1: Consumption Level Trend Consumption 2011-2017 West Bank 13.43% Gaza Strip 20.37% Palestine 4.35% Table 2: Demand Side Analysis Table 3: Supply Side Analysis Product Total Value Product Total Value Facial Care $ 247,698,670 Facial Care $ 191,244,337 Body Care 57,161,231 Body Care $ 44,133,308 Sun Care 38,107,488 Sun Care 29,422,206 Hand Care 22,864,493 Hand Care S 17,653,323 Others $ 15,242,995 Others 11,768,882 Total 381,074,876 Total $ 294,222,057 Table 4: Cosmetic Sector Value Chain in Palestine ($) Cosmetics Value Chain Product Category Market Supply Intermediaries Market Demand Facial Care $ 191,244,337 $ 219,471,503.18 $ 247,698,670 Body Care 44,133,308 50,647,269.97 57,161,231 Sun Care 29,422,206 $ 33,764,846.64 38,107,488 Hand Care S 17,653,323 20,258,907.99 22,864,493 Others S 11,768,882 $ 13,505,938.66 $ 15,242,995 Total $ 294,222,057 $ 337,648,466.44 381,074,876Table 11: Upper Income Scenario Table 12: Lower Income Scenario Upper Income Scenario Estimated Male Female Lower Income Scenario Estimated Male Female 20% of Monthly Monthly Monthly 40% of Monthly Monthly Monthly Population Earnings Earnings Earnings Population Earnings Earnings Earnings Jenin ,491.0 7,946.4 4,976.4 Jenin 1,450.0 1,538.1 963.3 Tubas 7,101.6 7,299.6 5,860.8 Tubas 1,450.0 1,490.4 1,196.7 Tulkarm 7,491.0 7,939.8 5,293.2 Tulkarm ,450.0 1,536.9 1,024.6 Nablus 7,141.2 7,550.4 6,359.2 Nablus ,450.0 1,533.1 1,088.2 Qalqilya 9,002.4 9,682.2 4,527.6 Qalqilya ,450.0 1,559.5 729.3 Salfit 8,573.4 9,055.2 5,814.6 Salfit 1,450.0 1,531.5 983.4 Ramallah/Al- 8,467.8 Ramallah/Al- Bireh 1,450.0 1,143.4 Birel 8,052.0 5,349.2 1,524.9 Jericho 6,920.2 6,019.2 5,497.8 Jericho 1,450.0 1,474.2 1,346.5 Jerusalem 8,467.8 8,791. 5,167.8 Jerusalem 1,450.0 1,505.4 384.9 Bethlehem 7,873.8 8,203.8 6,382.2 Bethlehem 1,450.0 1,510.8 1,175.3 Hebron 3,421.6 8,863.8 5,484.6 Hebron 1,450.0 1,526.1 944.3 West Bank 7,926.6 8,355.6 5,603.4 West Bank 1,450.0 1,528.5 1,025.0 Table 13: Palestinian Intermediaries in Cosmetic, Health and Beauty Aid Sector Intermediaries Cosmetics & Toiletries Beauty Salons Pharmacies West Bank 210 499 701 Gaza Strip 40 78 255 Palestine 250 577 956 Table 14: Geographic Distribution of Intermediaries Intermediaries Cosmetics & Toiletries Beauty Salons Pharmacies North WE 86 144 317 Central WB 70 221 167 South WB 54 134 217 Gaza Strip 40 78 255Table 15: Competitive Dynamics of Palestinian Market for Cosmetics, Health and Beauty Aides (Values in USD) Competitive Category Leader Challenger Follower Follower Niche Niche Niche Niche Firm A Firm B Firm C Firm D Firm E Firm F Firm G Firm H Total Local Producers 47,075,529 35,306,647 14,122,659 9,415,106 4,707,553 2,942,221 2,353,776 1,765,332 117,688,823 Importers 70,613,294 52,959,970 |21,183,988 14,122,659 7,061,329 4,413,331 3,530,665 2,647,999 176,533,234 Total 117,688,823 88,266,617 35,306,647 23,537,765 11,768,882 7,355,551 5,884,441 4,413,331 294,222,057 Table 16: Percentage of Product Categories Produced or Imported by Every Firm Product Category Share of Cosmetics Categories Facial Care 65% Body Care 15% Sun Care Hand Care 6% Others 4% Total 100%Table 5: Average Retail Prices Product Category Avg. Price USD Import Price USD Local Price USD Facial Care 103.85 35.06 72.72 Body Care 37.60 17.71 26.32 Sun Care 37.60 47.71 26.32 Hand Care 37.60 17.71 26.32 Others 37.60 17.71 26.32 Table 6: Consumption and Product Usage Product Category Main Usage # of Uses/Product Product Usage Life Facial Care Monthly-Several Times Monthly 48 3.98 Months Body Care Daily 168 8.36 Weeks Sun Care Daily-Seasonal 16 3.36 Weeks Hand Care Daily 168 3.36 Weeks Others Daily 168 3.36 Weeks Table 7: Facial Care Consumption Type Table 8: Other Care Products Consumption Type Facial Care Usage Percentage Other Care Products Percentage Daily 12% Daily 52% Several Times per Week 4% Several Times per Week 22% Weekly 5% Weekly 7% Several Times per Month 21% 2-3 Times per Month 4% Monthly 39% Monthly 3% Less Often 18% Less Often 6% Never 1% Neve 6%Table 9: West Bank Population Age Group Females Males Total 0 to 4 197,420 206,471 403,891 5 to 9 174,452 181,329 355,781 10 to 14 162,486 168,969 331,455 15 to 19 156,860 163,855 320,715 20 to 24 150,027 156,987 307.009 25 to 29 128,393 134,302 262,695 30 to 34 100,084 104,618 204,702 35 to 39 84,113 87,448 171,561 40 to 44 74,297 76,38 150,686 45 to 49 62,794 65,119 127,913 50 to 54 $1,396 54,520 105,916 = 55 to 59 38,950 41,033 79,983 60 to 64 26,420 26,811 53,231 65 to 69 19,273 17,699 36,972 70 to 74 14,795 11,522 26,317 75 to 79 10,140 7,021 17,161 80 + 9,797 6,284 16,081 Total 1,461,692 1,510,377 2,972,069 Table 10: Average Daily Wages (NIS) Estimated Male Avg. Daily Wage Female Males Females Total Working Days/Month Monthly Monthly Monthly Earnings Earnings Earnings Jenin 120.4 75.4 113.5 22 2,497.0 2,648.8 1,658.8 Tubas 110.6 38.8 107.6 22 2,367.2 2,433.2 1,953.6 Tulkarm 120.3 30.2 113.5 22 2,497.0 2,646.6 1,764.4 Nablus 114.4 81.2 108.2 22 2,380.4 2,516.8 1,786.4 Qalqilya 146.7 68.6 136.4 22 3,000.8 1,227.4 1,509.2 Salfit 137.2 38.1 129.9 22 2,857. 3,018.4 1,938.2 Ramallah/ Al-Bireh 128.3 96.2 122 22 2,684.0 2,822.6 2,116.4 Jericho 91.2 83.3 39.7 22 1,973.4 2,006.4 1,832.6 Jerusalem 133. 78.3 128.3 22 2,822.6 2,930.4 1,722.6 Bethlehem 124.3 96.7 119.3 22 ,624.6 2,734.6 2,127.4 Hebron 134.3 83.1 127.6 22 2,807.2 2,954.6 1,828.2 West Bank 26.6 84.9 120.1 22 2,642.2 2,785.2 1,867.8