Answered step by step
Verified Expert Solution
Link Copied!

Question

1 Approved Answer

please I just need the answers for all I will like your coment if you help me Question 2 The goal of a histogram is

please I just need the answers for all I will like your coment if you help me image text in transcribed
image text in transcribed
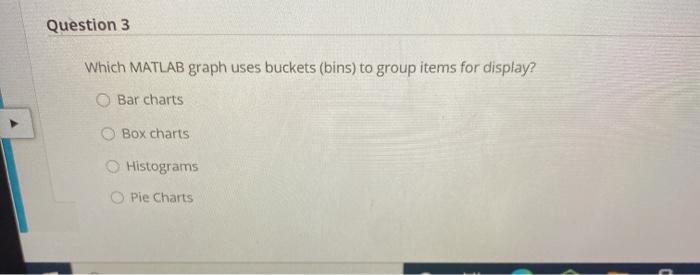
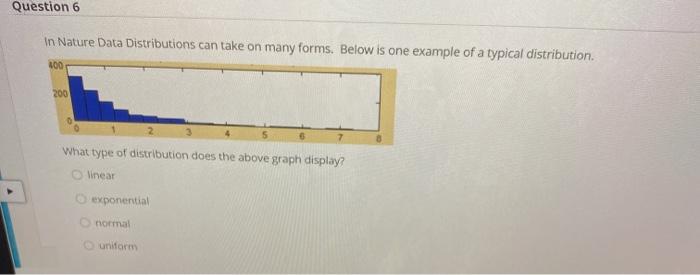
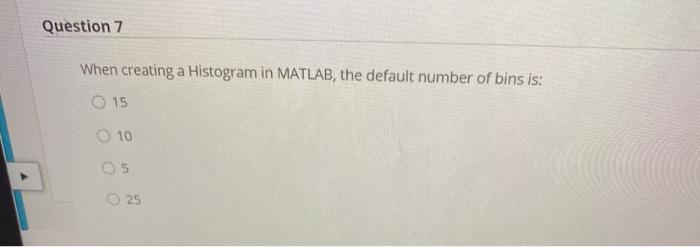
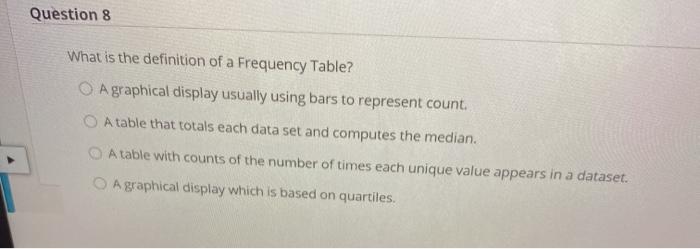
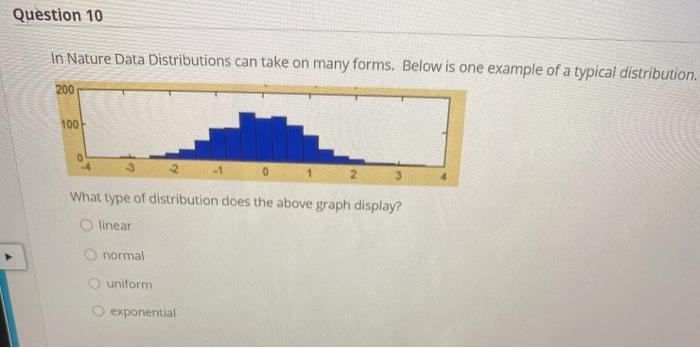
Question 2 The goal of a histogram is to display a "distribution" of data, where the x axis is a range or category True False Question 3 Which MATLAB graph uses buckets (bins) to group items for display? Bar charts Box charts Histograms Pie Charts Question 4 1 points One tool used Wiver creating a histogram, is the square root rule. This rule is used to help determine the adequate number of bins for your data. How is it calculated Ideal bits = 10 We number of data elements xquare root of the first element ideality square root of the number of elements in the data set idealne root of the verge data elements Question 6 In Nature Data Distributions can take on many forms. Below is one example of a typical distribution. 100 200 What type of distribution does the above graph display? linear exponential normal uniform Question 7 When creating a Histogram in MATLAB, the default number of bins is: 15 10 OS 25 Question 8 What is the definition of a Frequency Table? O A graphical display usually using bars to represent count A table that totals each data set and computes the median A table with counts of the number of times each unique value appears in a dataset. A graphical display which is based on quartiles. Question 9 What is the definition of a histogram? A graph that displays quartiles with a median in the middle and has whiskers to represent outliers. A graphical display of a frequency table, usually using bars to present counts. A table with counts of the number of times each unique value appears in the dataset. Abar chart that computes the median of all the data set and spreads the counts acreshing Question 10 In Nature Data Distributions can take on many forms. Below is one example of a typical distribution 200 100 What type of distribution does the above graph display? linear normal uniform exponential

Step by Step Solution

There are 3 Steps involved in it

Step: 1

blur-text-image

Get Instant Access to Expert-Tailored Solutions

See step-by-step solutions with expert insights and AI powered tools for academic success

Step: 2

blur-text-image

Step: 3

blur-text-image

Ace Your Homework with AI

Get the answers you need in no time with our AI-driven, step-by-step assistance

Get Started

Recommended Textbook for

Database Fundamentals Study Guide

Authors: Dr. Sergio Pisano

1st Edition

B09K1WW84J, 979-8985115307

More Books

Students also viewed these Databases questions

Question

14-18 Compare the two major types of planning and control tools.

Answered: 1 week ago