

Answered step by step
Verified Expert Solution
Question
1 Approved Answer
please i need all the answers for all questions if tis lengthy you can folve for me last part ( 3.1,3.2,3.3,3.4,3.5) please 1 Balance productions
please i need all the answers for all questions 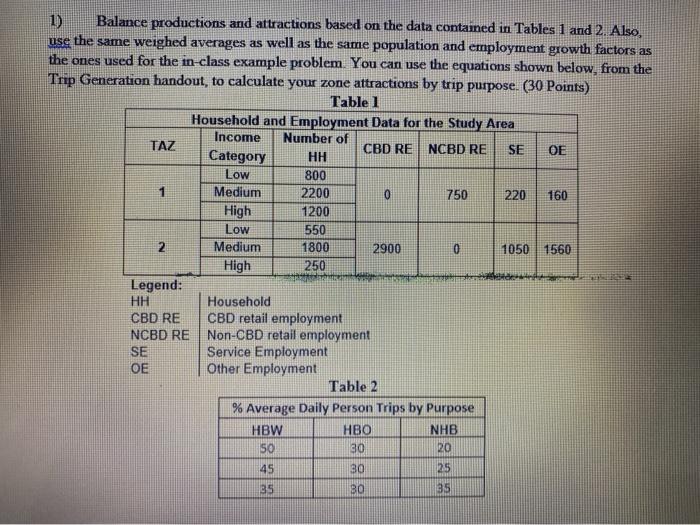
if tis lengthy you can folve for me last part ( 3.1,3.2,3.3,3.4,3.5) please
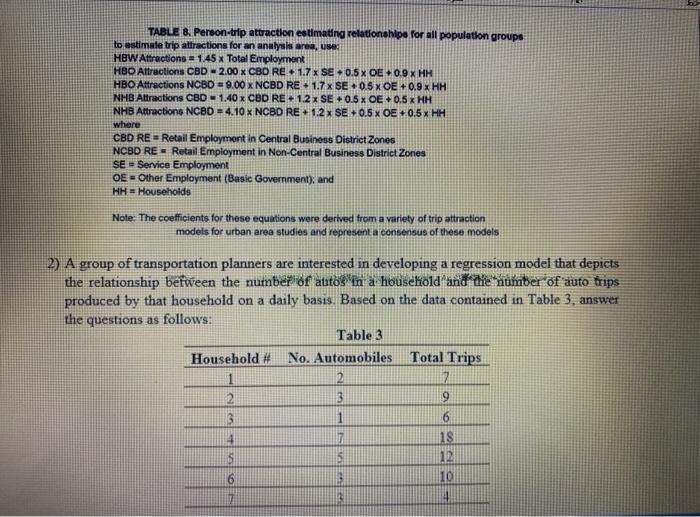
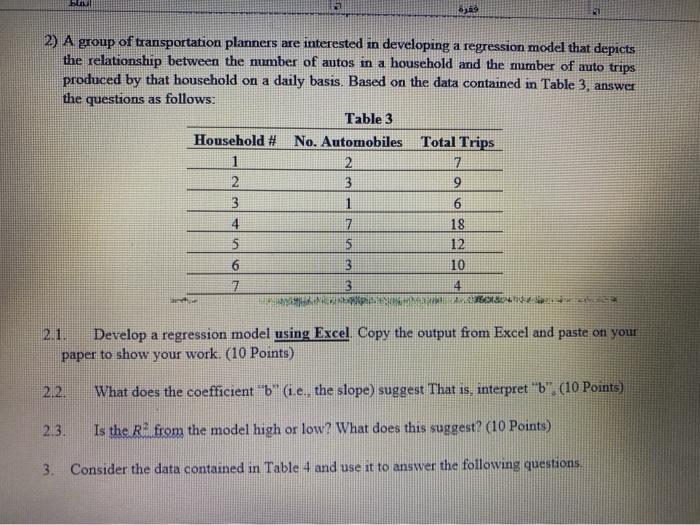
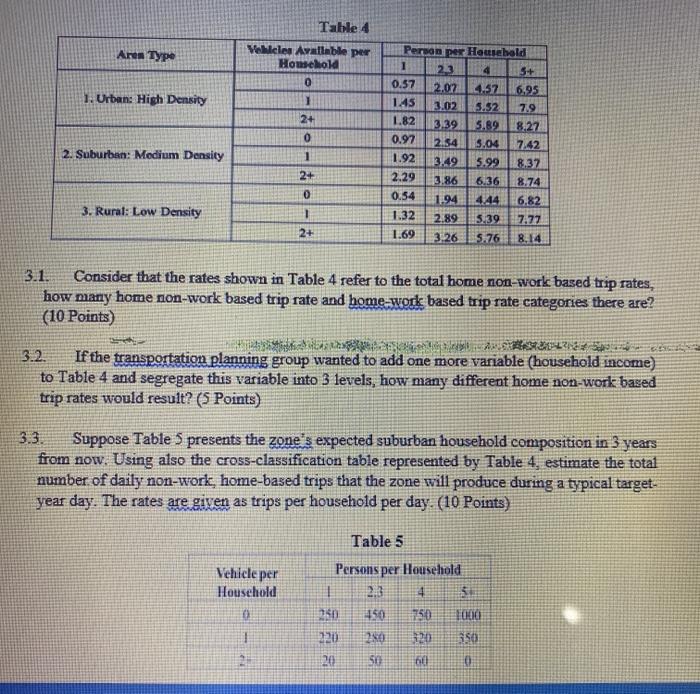
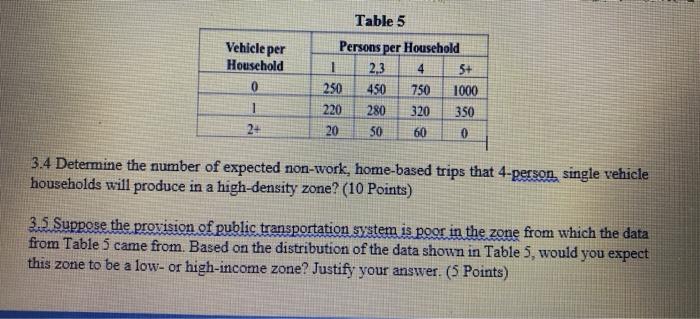
1 Balance productions and attractions based on the data contained in Tables 1 and 2. Also, use the same weighed averages as well as the same population and employment growth factors as the ones used for the in-class example problem. You can use the equations shown below, from the Trip Generation handout, to calculate your zone attractions by trip purpose. (30 Points) Table 1 Household and Employment Data for the Study Area Income Number of TAZ SE CBD RE NCBD RE Category OE HH Low 800 1 Medium 2200 0 750 220 160 High 1200 Low 550 2 Medium 1800 2900 0 1050 1560 High 250 Legend: HH Household CBD RE CBD retail employment NCBD RE Non-CBD retail employment SE Service Employment OE Other Employment Table 2 % Average Daily Person Trips by Purpose HBW HBO NHB 50 30 20 45 30 25 35 30 35 TABLE 8. Person-trip attraction estimating relationships for all population groupe to estimate trip attractions for an analysis area, HBW Attractions - 1.45 x Total Employment HBO Attractions CBD - 2.00 X CBD RE + 1.7 x SE 0.5X DE 0.9 X HH HBO Attractions NCBO = 9.00 x NCBD RE 1.7 SE 0.5 x OE +0.9 xHH NHB Attractions CBD 1.40x CBD RE 1.2x SE + 0.5X OE+0.5 xHH NHB Attractions NCBO = 4.10 x NCBD RE 1.2x SE+0.5 x OE 0.5X HH where CBD RE - Retail Employment in Central Business District Zones NCBD RE - Retail Employment in Non-Central Business District Zones SE Service Employment OE = Other Employment (Basic Government), and HH = Households Note: The coefficients for these equations were derived from a variety of trip attraction models for urban area studies and representa consensus of these models 2) A group of transportation planners are interested in developing a regression model that depicts the relationship between the number of autos' in a household and the number of auto trips produced by that household on a daily basis. Based on the data contained in Table 3. answer the questions as follows: Table 3 Household # No. Automobiles Total Trips 1 2 2 3 9 13 1 6 2 4 5 B SO 12 10 4 EL! 69 2) A group of transportation planners are interested in developing a regression model that depicts the relationship between the number of autos in a household and the mumber of auto trips produced by that household on a daily basis. Based on the data contained in Table 3. answer the questions as follows: Table 3 Household # No. Automobiles Total Trips 1 2 7 2 3 9 3 6 4 7 18 5 5 12 6 3 10 7 3 4 HERE 1 Develop a regression model using Excel Copy the output from Excel and paste on your paper to show your work. (10 Points) What does the coefficient "b" (ie, the slope) suggest That is, interpret "b" (10 Points) 2.3. Is the Rifrom the model high or low? What does this suggest? (10 Points) 3. Consider the data contained in Table 4 and use it to answer the following questions Table 4 Aren Type Vehicles Available per Household 0 1. Urban: High Density 1 2+ Person per Household 1 23 4 5+ 0.57 2.07 1.57 6.95 1.45 3.02 5.52 7.9 1.82 339 5.89 8.27 0.97 2.54 5.04 7.42 1.92 3.49 5.99 8.32 3.86 6.36 8.74 0.54 1.94 444 6.82 1.32 2.89 5.39 7477 1.69 3.26 5.76 8.14 0 1 2. Suburban: Medium Density 2+ 2.29 0 3. Rural: Low Density 2+ 3.1. Consider that the rates shown in Table 4 refer to the total home non-work based trip rates, how many home non-work based trip rate and home-work based trip rate categories there are? (10 Points) If the transportation planning group wanted to add one more variable (household income) to Table 4 and segregate this variable into 3 levels, how many different home non-work based trip rates would result? (5 Points) Suppose Table 5 presents the zone's expected suburban household composition in 3 years from now. Using also the cross-classification table represented by Table 4. estimate the total number of daily non-work, home-based trips that the zone will produce during a typical target- year day. The rates are given as trips per household per day. (10 Points) Table 5 Vehicle per Household Persons per Household 1 2.3 4 450 150 000 220 20 550 1 20 5 ht Vehicle per Household 0 1 2+ Table 5 Persons per Household 1 4 5+ 250 450 750 1000 220 280 320 350 20 50 60 0 2.3 3.4 Determine the number of expected non-work, home-based trips that 4-person single vehicle households will produce in a high-density zone? (10 Points) 3.5 Suppose the provision of public transportation system is poor in the zone from which the data from Table 5 came from. Based on the distribution of the data shown in Table 5, would you expect this zone to be a low- or high-income zone? Justify your answer. (5 Points) 1 Balance productions and attractions based on the data contained in Tables 1 and 2. Also, use the same weighed averages as well as the same population and employment growth factors as the ones used for the in-class example problem. You can use the equations shown below, from the Trip Generation handout, to calculate your zone attractions by trip purpose. (30 Points) Table 1 Household and Employment Data for the Study Area Income Number of TAZ SE CBD RE NCBD RE Category OE HH Low 800 1 Medium 2200 0 750 220 160 High 1200 Low 550 2 Medium 1800 2900 0 1050 1560 High 250 Legend: HH Household CBD RE CBD retail employment NCBD RE Non-CBD retail employment SE Service Employment OE Other Employment Table 2 % Average Daily Person Trips by Purpose HBW HBO NHB 50 30 20 45 30 25 35 30 35 TABLE 8. Person-trip attraction estimating relationships for all population groupe to estimate trip attractions for an analysis area, HBW Attractions - 1.45 x Total Employment HBO Attractions CBD - 2.00 X CBD RE + 1.7 x SE 0.5X DE 0.9 X HH HBO Attractions NCBO = 9.00 x NCBD RE 1.7 SE 0.5 x OE +0.9 xHH NHB Attractions CBD 1.40x CBD RE 1.2x SE + 0.5X OE+0.5 xHH NHB Attractions NCBO = 4.10 x NCBD RE 1.2x SE+0.5 x OE 0.5X HH where CBD RE - Retail Employment in Central Business District Zones NCBD RE - Retail Employment in Non-Central Business District Zones SE Service Employment OE = Other Employment (Basic Government), and HH = Households Note: The coefficients for these equations were derived from a variety of trip attraction models for urban area studies and representa consensus of these models 2) A group of transportation planners are interested in developing a regression model that depicts the relationship between the number of autos' in a household and the number of auto trips produced by that household on a daily basis. Based on the data contained in Table 3. answer the questions as follows: Table 3 Household # No. Automobiles Total Trips 1 2 2 3 9 13 1 6 2 4 5 B SO 12 10 4 EL! 69 2) A group of transportation planners are interested in developing a regression model that depicts the relationship between the number of autos in a household and the mumber of auto trips produced by that household on a daily basis. Based on the data contained in Table 3. answer the questions as follows: Table 3 Household # No. Automobiles Total Trips 1 2 7 2 3 9 3 6 4 7 18 5 5 12 6 3 10 7 3 4 HERE 1 Develop a regression model using Excel Copy the output from Excel and paste on your paper to show your work. (10 Points) What does the coefficient "b" (ie, the slope) suggest That is, interpret "b" (10 Points) 2.3. Is the Rifrom the model high or low? What does this suggest? (10 Points) 3. Consider the data contained in Table 4 and use it to answer the following questions Table 4 Aren Type Vehicles Available per Household 0 1. Urban: High Density 1 2+ Person per Household 1 23 4 5+ 0.57 2.07 1.57 6.95 1.45 3.02 5.52 7.9 1.82 339 5.89 8.27 0.97 2.54 5.04 7.42 1.92 3.49 5.99 8.32 3.86 6.36 8.74 0.54 1.94 444 6.82 1.32 2.89 5.39 7477 1.69 3.26 5.76 8.14 0 1 2. Suburban: Medium Density 2+ 2.29 0 3. Rural: Low Density 2+ 3.1. Consider that the rates shown in Table 4 refer to the total home non-work based trip rates, how many home non-work based trip rate and home-work based trip rate categories there are? (10 Points) If the transportation planning group wanted to add one more variable (household income) to Table 4 and segregate this variable into 3 levels, how many different home non-work based trip rates would result? (5 Points) Suppose Table 5 presents the zone's expected suburban household composition in 3 years from now. Using also the cross-classification table represented by Table 4. estimate the total number of daily non-work, home-based trips that the zone will produce during a typical target- year day. The rates are given as trips per household per day. (10 Points) Table 5 Vehicle per Household Persons per Household 1 2.3 4 450 150 000 220 20 550 1 20 5 ht Vehicle per Household 0 1 2+ Table 5 Persons per Household 1 4 5+ 250 450 750 1000 220 280 320 350 20 50 60 0 2.3 3.4 Determine the number of expected non-work, home-based trips that 4-person single vehicle households will produce in a high-density zone? (10 Points) 3.5 Suppose the provision of public transportation system is poor in the zone from which the data from Table 5 came from. Based on the distribution of the data shown in Table 5, would you expect this zone to be a low- or high-income zone? Justify your answer. (5 Points) Step by Step Solution
There are 3 Steps involved in it
Step: 1

Get Instant Access to Expert-Tailored Solutions
See step-by-step solutions with expert insights and AI powered tools for academic success
Step: 2

Step: 3
Ace Your Homework with AI
Get the answers you need in no time with our AI-driven, step-by-step assistance
Get Started
Finance For Growing Enterprises
Authors: Edward W. Davis, Roger Buckland
1st Edition
1138679941, 978-1138679948