Please I need help with the following problems, Thanks
A)
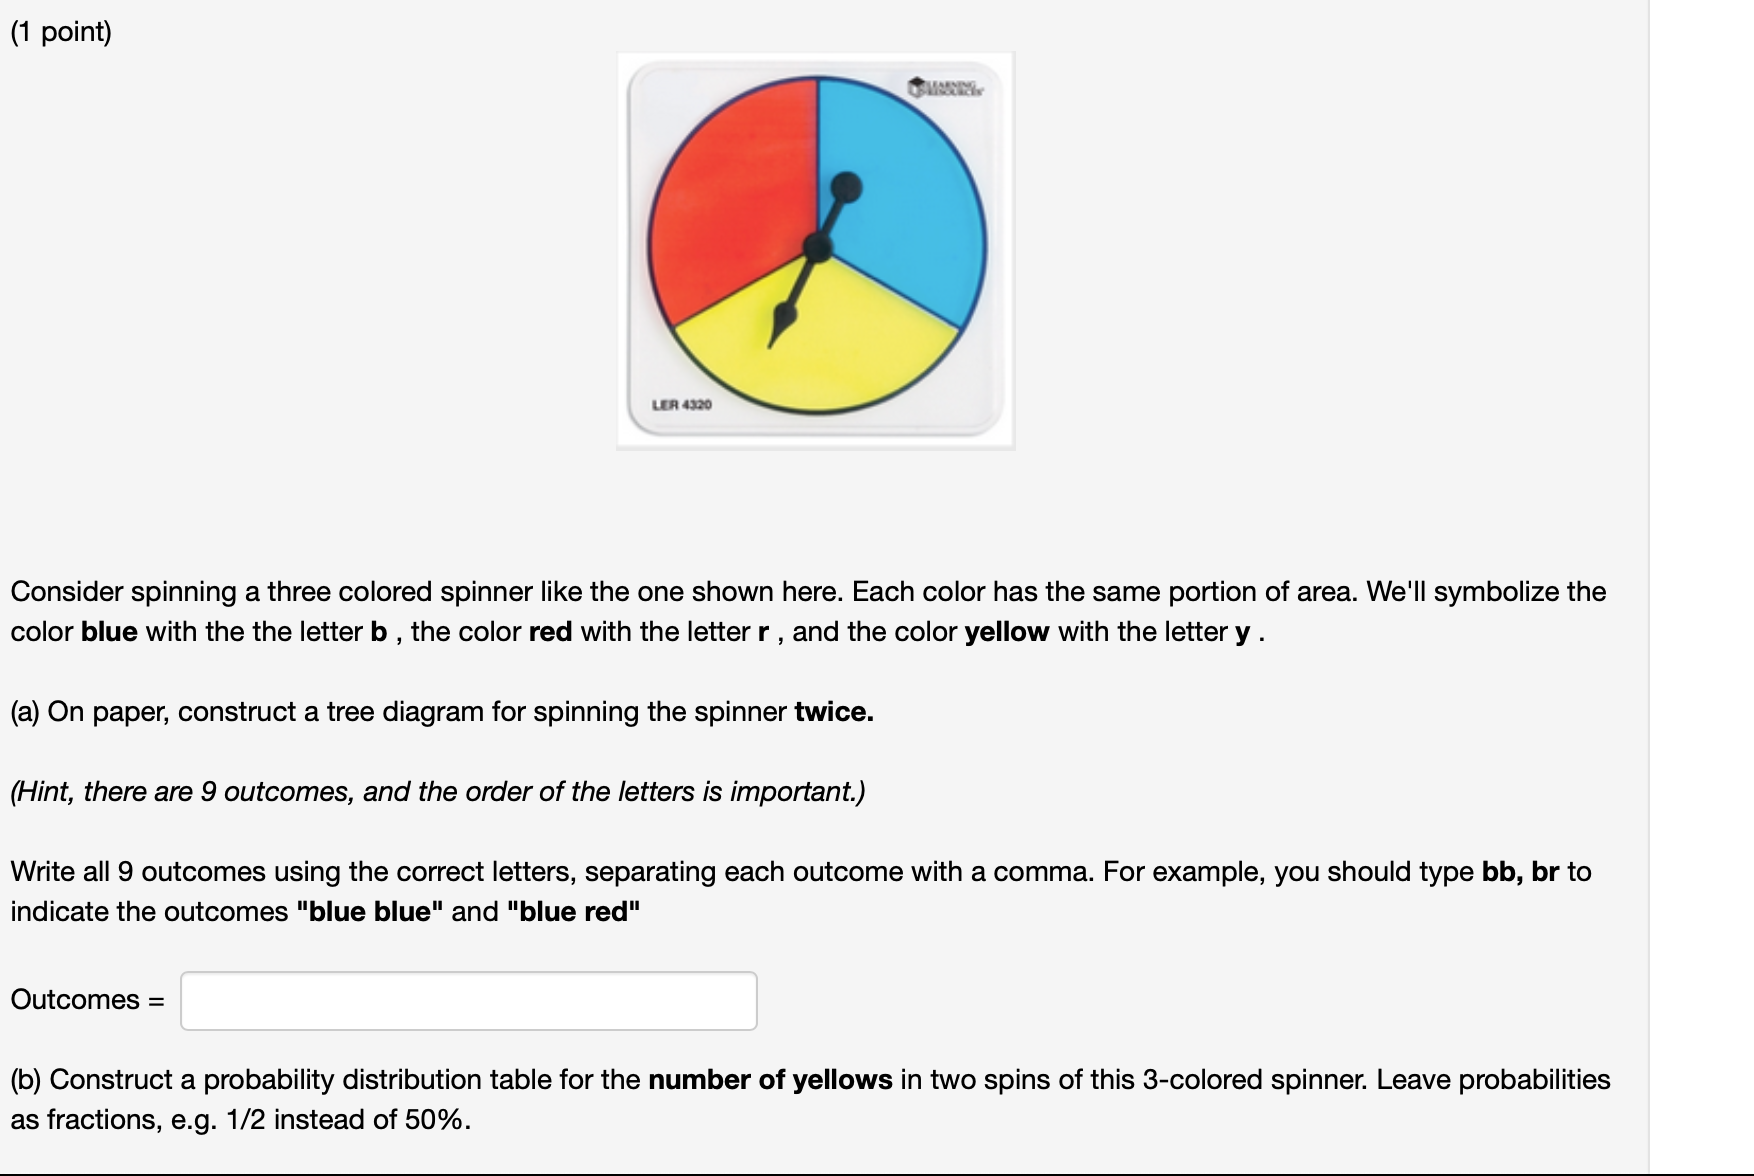
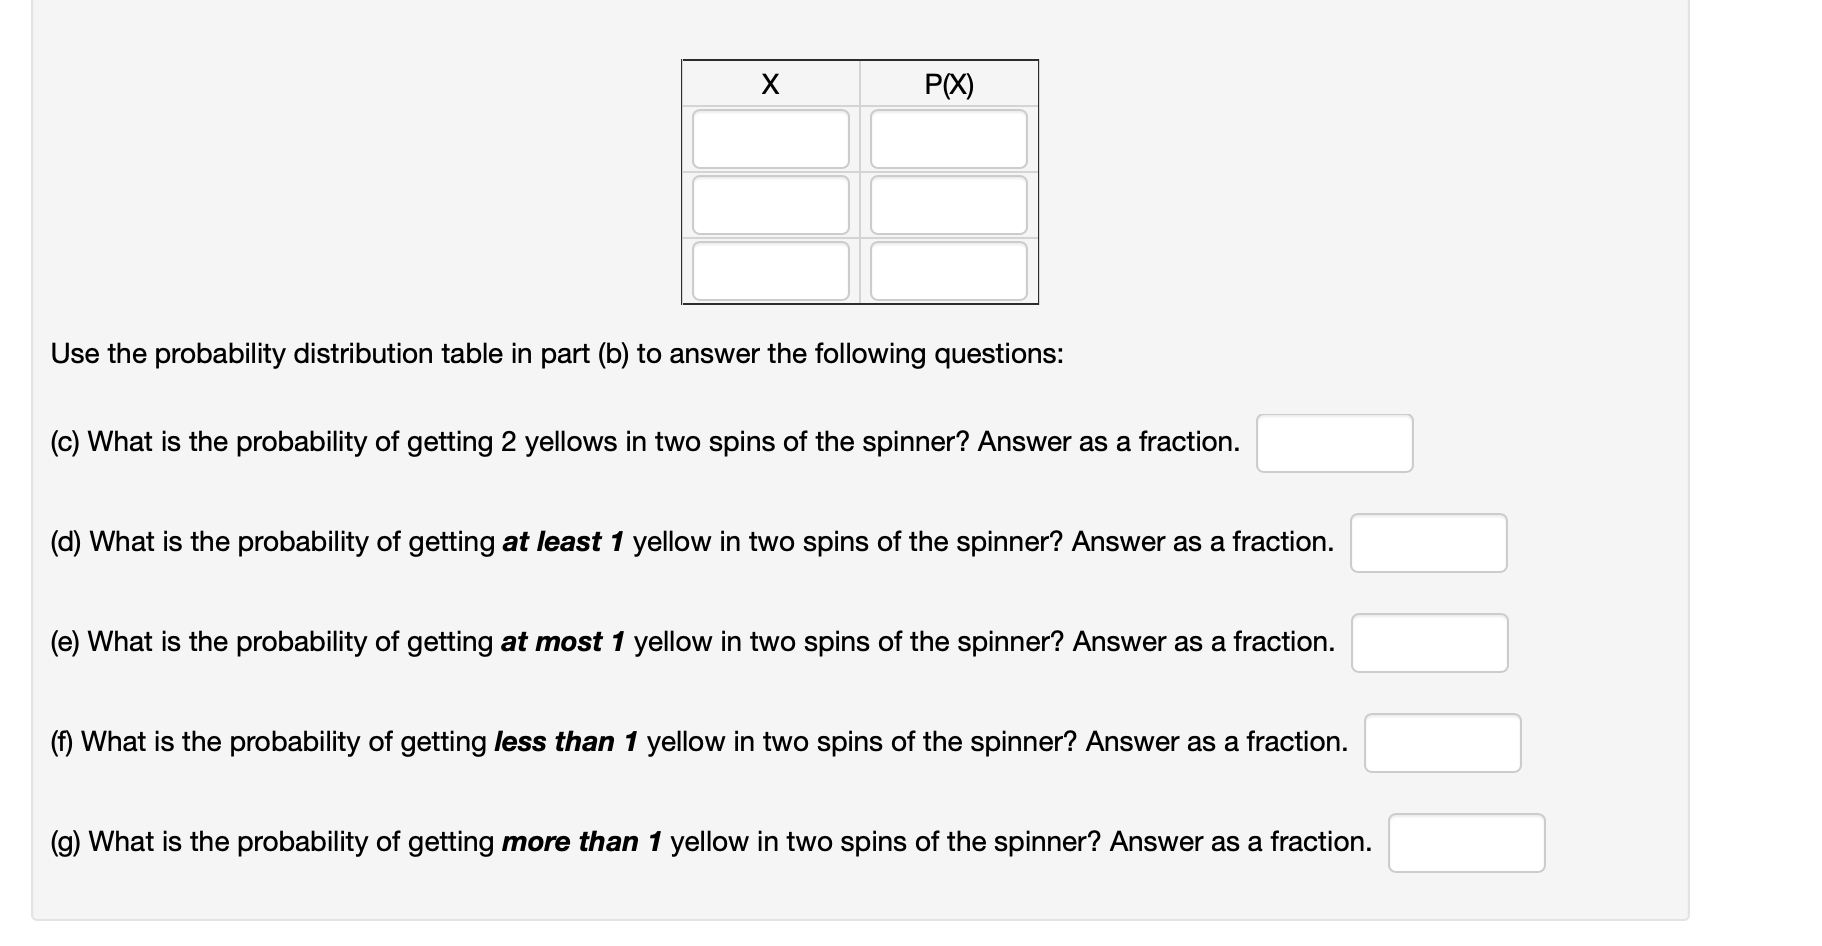
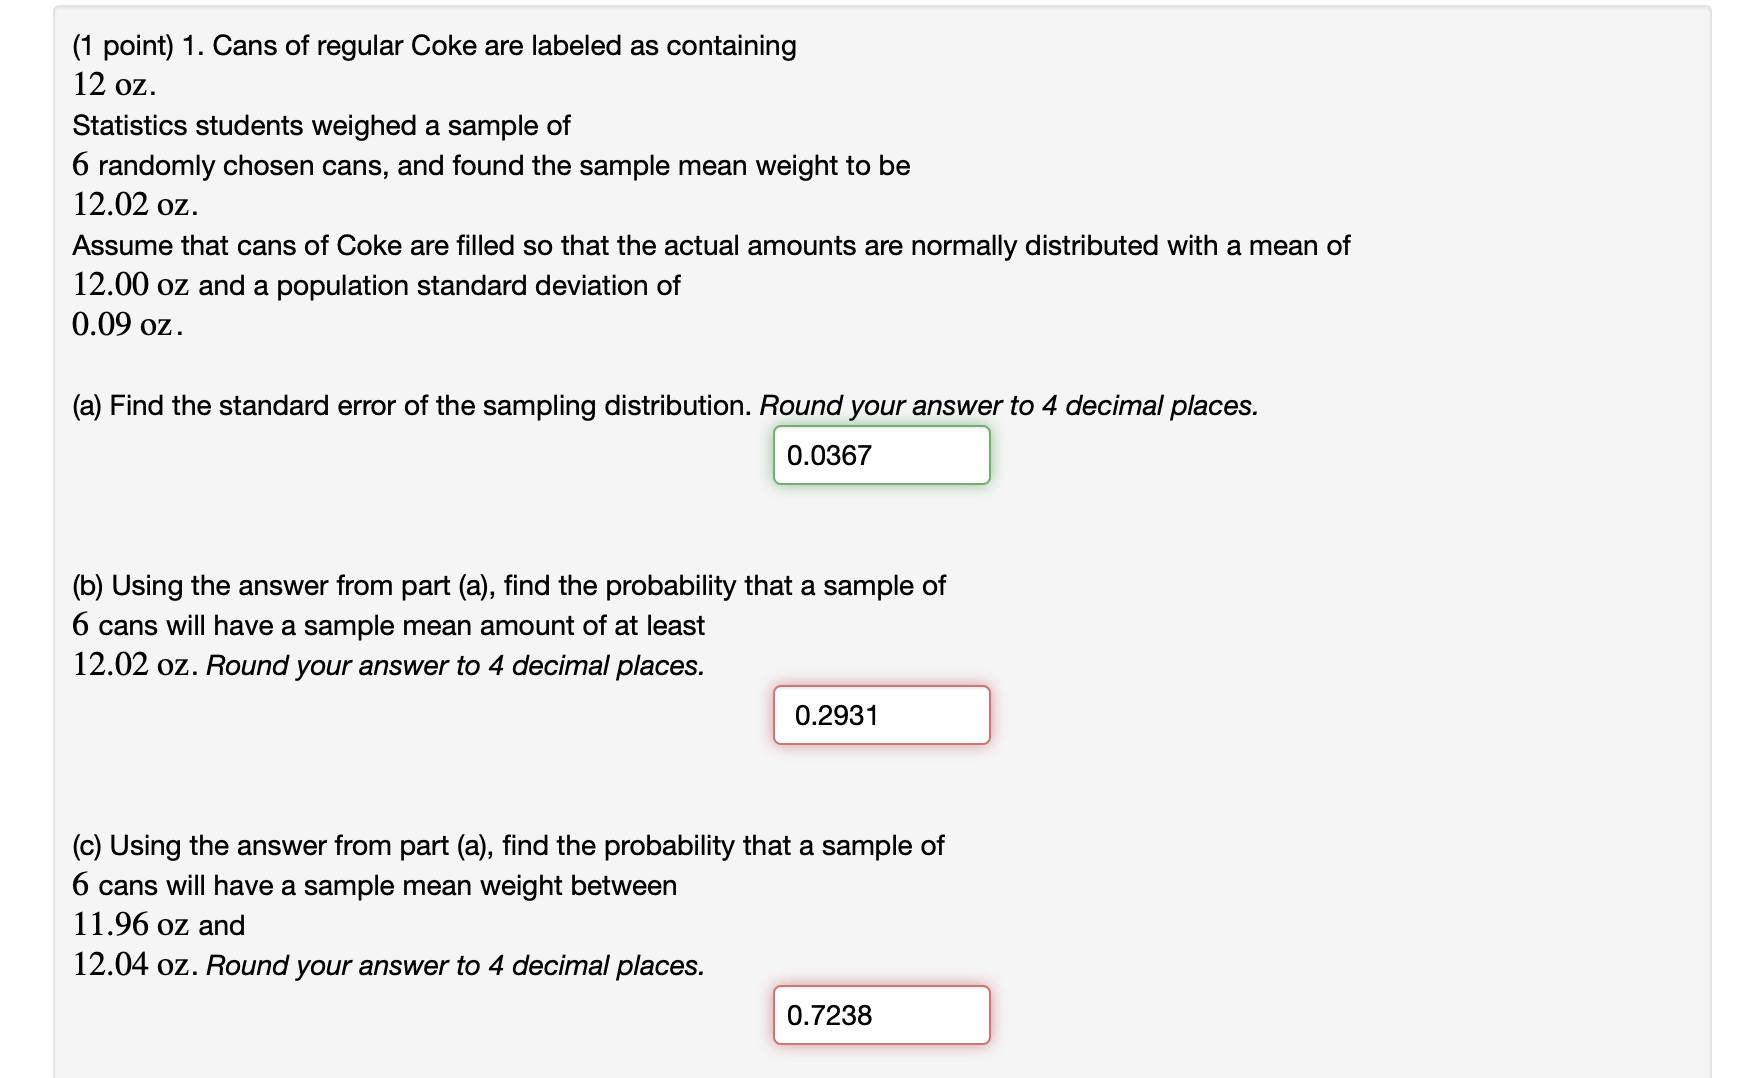
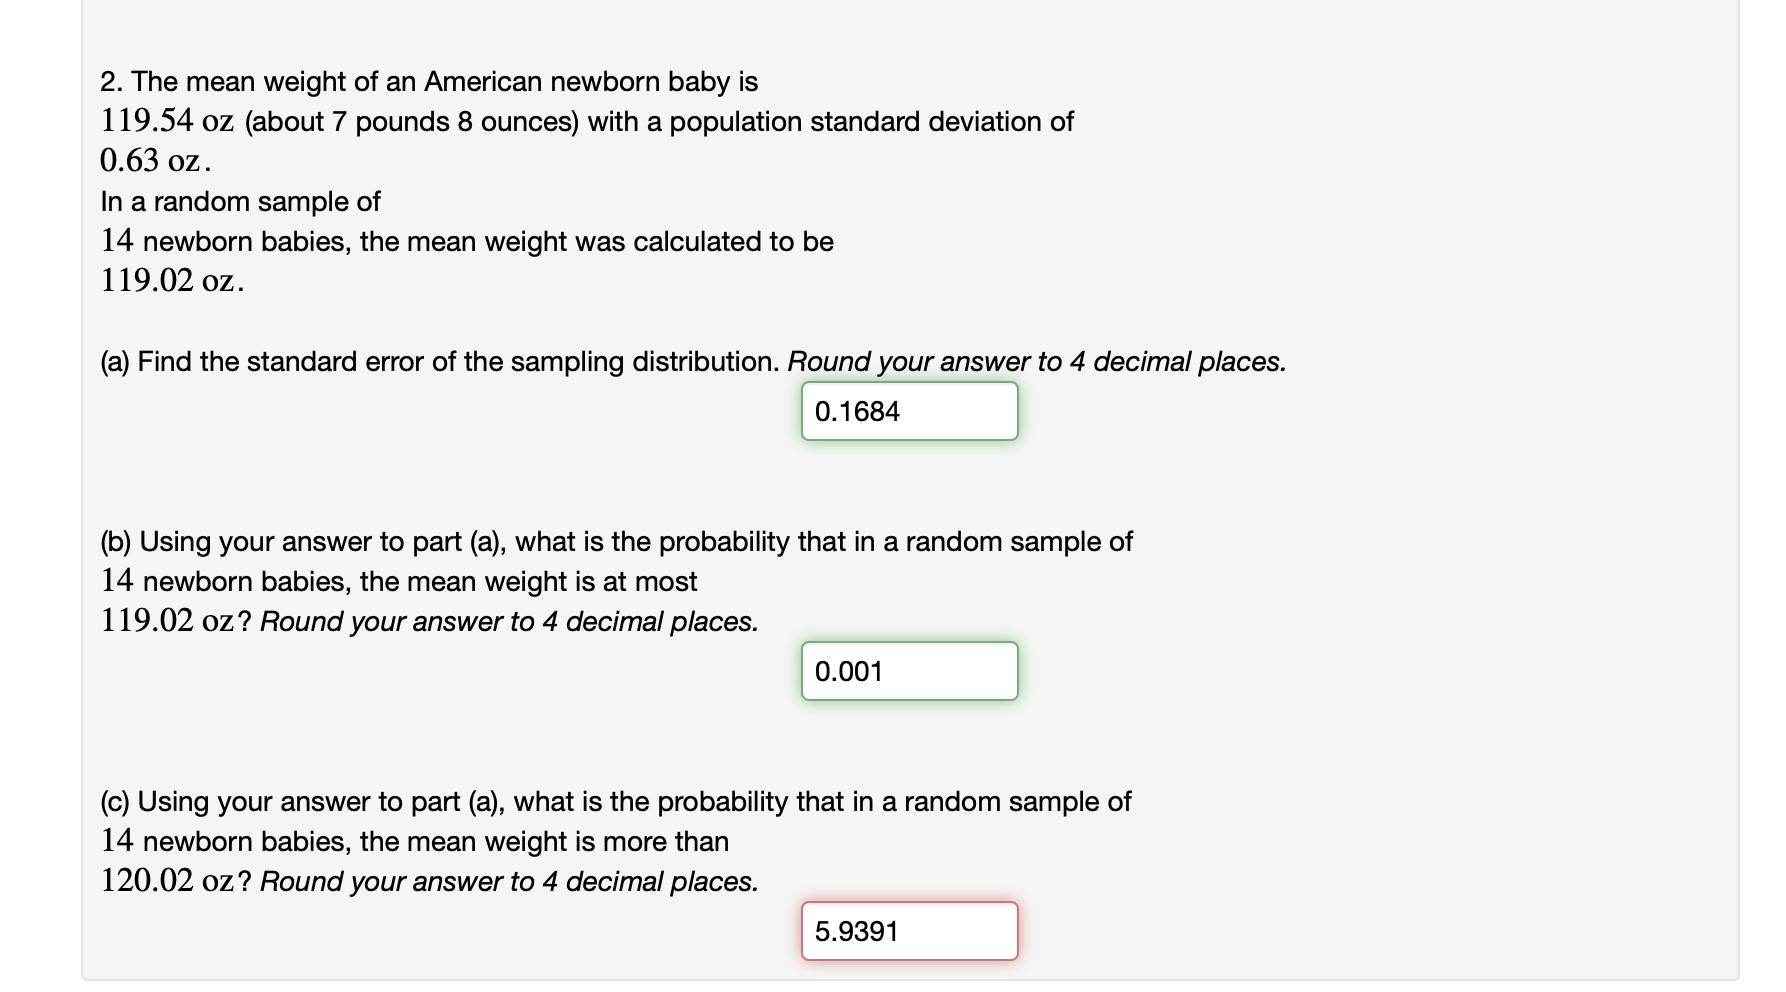
(1 point) k..- Consider spinning a three colored spinner like the one shown here. Each color has the same portion of area. We'll symbolize the color blue with the the letter b , the color red with the letter r , and the color yellow with the letter y . (a) On paper. construct a tree diagram for spinning the spinner twice. (Hint, there are 9 outcomes, and the order of the letters is important.) Write all 9 outcomes using the correct letters, separating each outcome with a comma. For example, you should type bb, br to indicate the outcomes "blue blue" and "blue red" Outcomes = (b) Construct a probability distribution table for the number of yellows in two spins of this 3-colored spinner. Leave probabilities as fractions, e.g. 1/2 instead of 50%. Use the probability distribution table in part (b) to answer the following questions: (0) What is the probability of getting 2 yellows in two spins of the spinner? Answer as a fraction. (d) What is the probability of getting at least 1 yellow in two spins of the spinner? Answer as a fraction. (e) What is the probability of getting at most 1 yellow in two spins of the spinner? Answer as a fraction. (1') What is the probability of getting less than 1 yellow in two spins of the spinner? Answer as a fraction. (9) What is the probability of getting more than 1 yellow in two spins of the spinner? Answer as a fraction. (1 point) 1. Cans of regular Coke are labeled as containing 12 oz. Statistics students weighed a sample of 6 randomly chosen cans, and found the sample mean weight to be 12.02 oz. Assume that cans of Coke are filled so that the actual amounts are normally distributed with a mean of 12.00 oz and a population standard deviation of 0.09 oz. (a) Find the standard error of the sampling distribution. Round your answer to 4 decimal places. 0.0367 (b) Using the answer from part (a), find the probability that a sample of 6 cans will have a sample mean amount of at least 12.02 oz. Round your answer to 4 decimal places. 0.2931 (c) Using the answer from part (a), find the probability that a sample of 6 cans will have a sample mean weight between 11.96 oz and 12.04 oz. Round your answer to 4 decimal places. 0.7238 2. The mean weight of an American newborn baby is 119.54 oz (about 7 pounds 8 ounces) with a population standard deviation of 0.63 02. In a random sample of 14 newborn babies, the mean weight was calculated to be 119.02 oz. (a) Find the standard error of the sampling distribution. Round your answer to 4 decimal places. 0. 1 684 (b) Using your answer to part (a), what is the probability that in a random sample of 14 newborn babies, the mean weight is at most 119.02 oz? Round your answer to 4 decimal places. (c) Using your answer to part (a), what is the probability that in a random sample of 14 newborn babies, the mean weight is more than 5.9391 120.02 oz? Round your answer to 4 decimal places