Answered step by step
Verified Expert Solution
Link Copied!

Question

1 Approved Answer

please I need help with this stats question 8.16 A study was conducted among school children on examination of the Ruskapp relationship between overweight/obese and

please I need help with this stats question
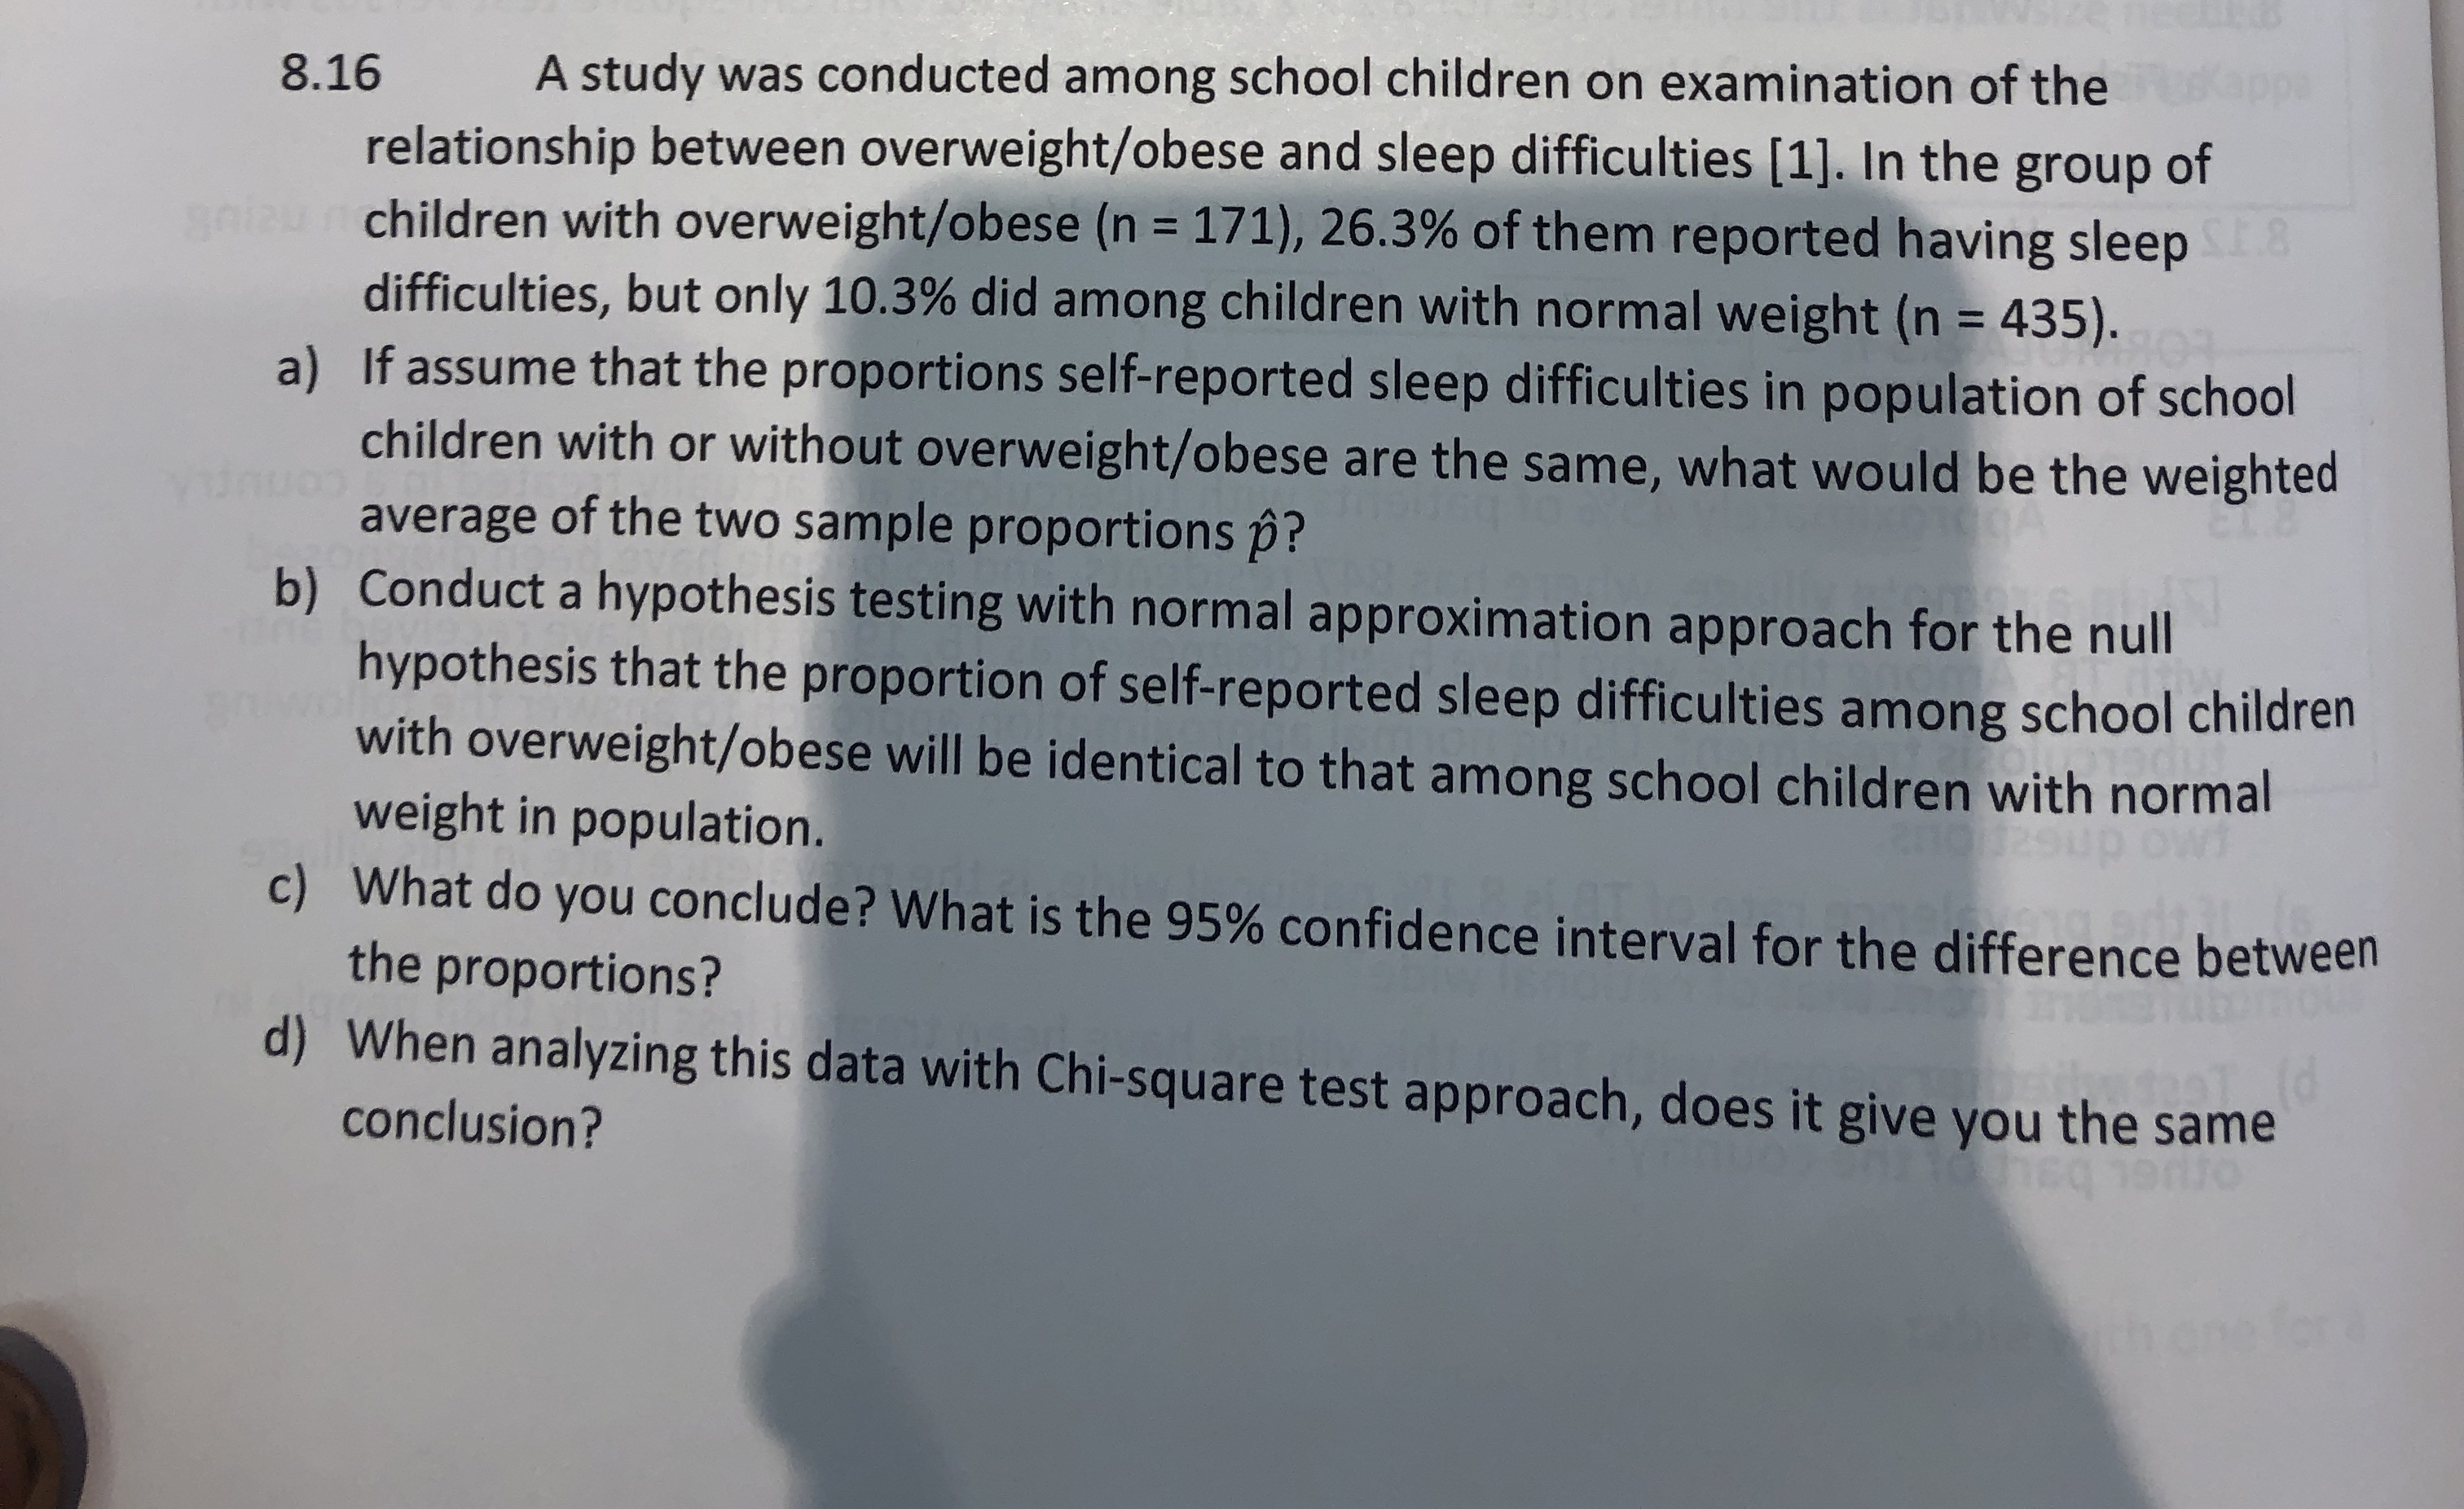
image text in transcribed
8.16 A study was conducted among school children on examination of the Ruskapp relationship between overweight/obese and sleep difficulties [1]. In the group of gaizu n children with overweight/obese (n = 171), 26.3% of them reported having sleep .8 difficulties, but only 10.3% did among children with normal weight (n = 435). a) If assume that the proportions self-reported sleep difficulties in population of school children with or without overweight/obese are the same, what would be the weighted average of the two sample proportions p? b) Conduct a hypothesis testing with normal approximation approach for the null hypothesis that the proportion of self-reported sleep difficulties among school children with overweight/obese will be identical to that among school children with normal weight in population. c) What do you conclude? What is the 95% confidence interval for the difference between the proportions? d) When analyzing this data with Chi-square test approach, does it give you the same conclusion

Step by Step Solution

There are 3 Steps involved in it

Step: 1

blur-text-image

Get Instant Access to Expert-Tailored Solutions

See step-by-step solutions with expert insights and AI powered tools for academic success

Step: 2

blur-text-image

Step: 3

blur-text-image

Ace Your Homework with AI

Get the answers you need in no time with our AI-driven, step-by-step assistance

Get Started

Recommended Textbook for

Linear Algebra and Its Applications

Authors: David C. Lay

4th edition

321791541, 978-0321388834, 978-0321791542

More Books

Students also viewed these Mathematics questions