Answered step by step
Verified Expert Solution
Question
1 Approved Answer
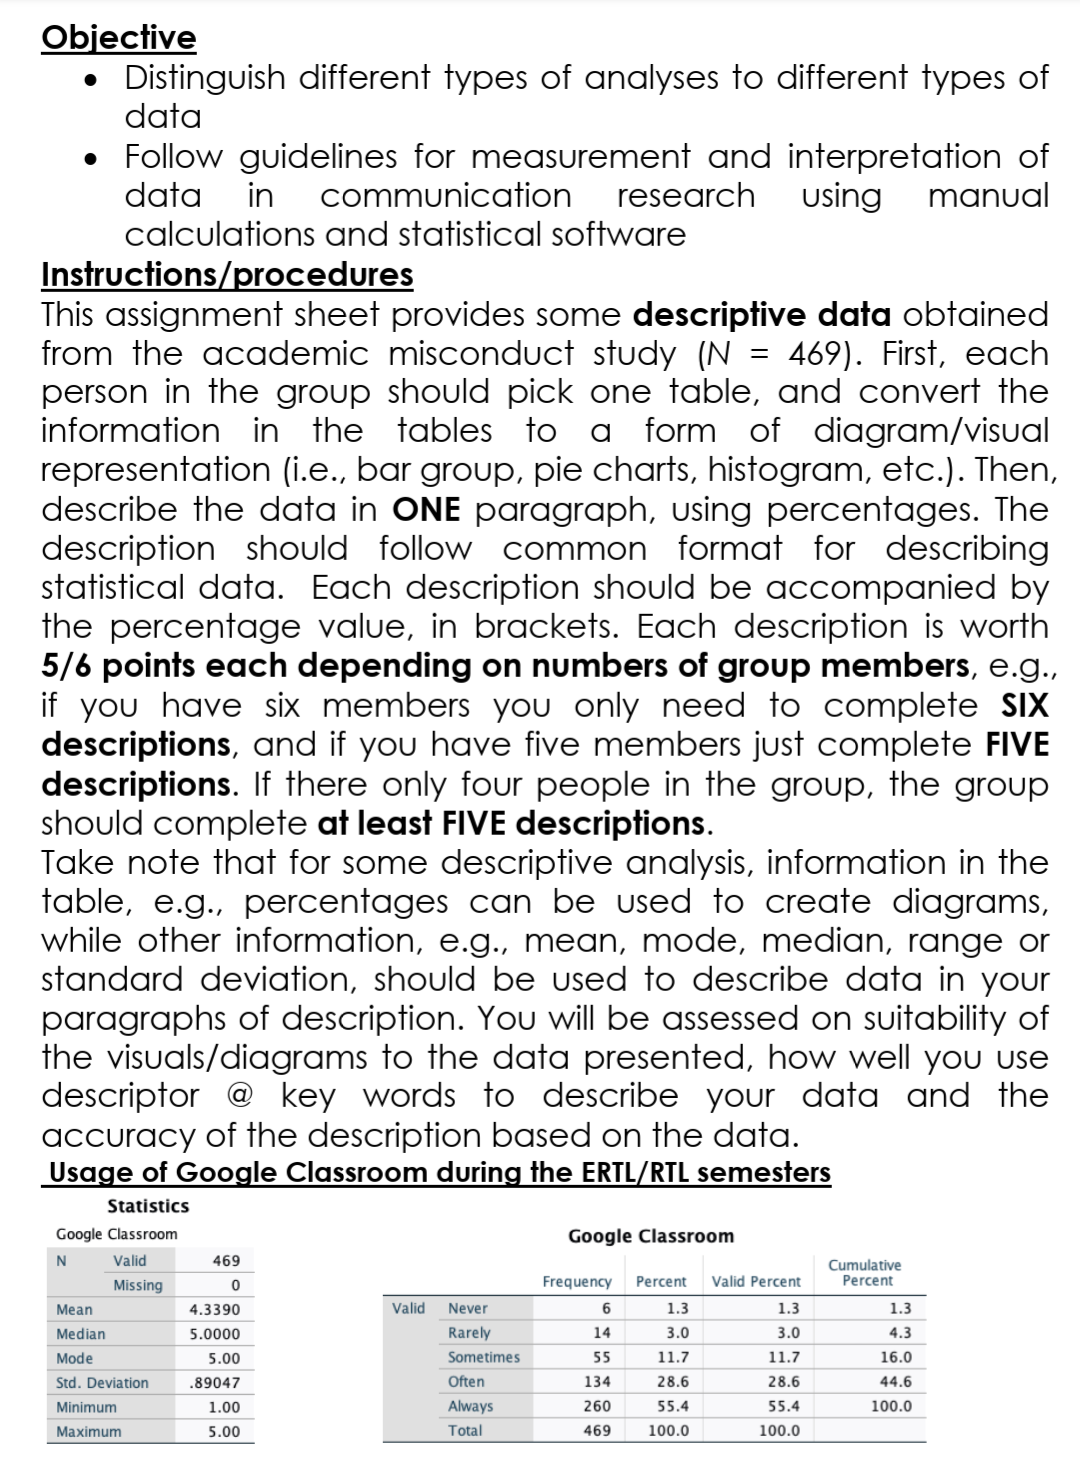
Please I want professional answer... O Objective Distinguish different types of analyses to different types of data Follow guidelines for measurement and interpretation of data

Please I want professional answer...
O Objective Distinguish different types of analyses to different types of data Follow guidelines for measurement and interpretation of data in communication research using manual calculations and statistical software Instructions/procedures This assignment sheet provides some descriptive data obtained from the academic misconduct study (N = 469). First, each person in the group should pick one table, and convert the information in the tables to a form of diagram/visual representation (i.e., bar group, pie charts, histogram, etc.). Then, describe the data in ONE paragraph, using percentages. The description should follow common format for describing statistical data. Each description should be accompanied by the percentage value, in brackets. Each description is worth 5/6 points each depending on numbers of group members, e.g., if you have six members you only need to complete SIX descriptions, and if you have five members just complete FIVE descriptions. If there only four people in the group, the group should complete at least FIVE descriptions. Take note that for some descriptive analysis, information in the table, e.g., percentages can be used to create diagrams, while other information, e.g., mean, mode, median, range or standard deviation, should be used to describe data in your paragraphs of description. You will be assessed on suitability of the visuals/diagrams to the data presented, how well you use descriptor @ key words to describe your data and the accuracy of the description based on the data. Usage of Google Classroom during the ERTL/RTL semesters Statistics Google Classroom Google Classroom N Valid 469 Cumulative Percent Missing 0 Frequency Percent Valid Percent Mean 4.3390 Valid Never 6 1.3 1.3 1.3 Median 5.0000 Rarely 14 3.0 3.0 4.3 Mode 5.00 Sometimes 55 11.7 11.7 16.0 Std. Deviation .89047 Often 134 28.6 28.6 44.6 Minimum 1.00 Always 260 55.4 55.4 100.0 Maximum 5.00 Total 469 100.0 100.0 O Objective Distinguish different types of analyses to different types of data Follow guidelines for measurement and interpretation of data in communication research using manual calculations and statistical software Instructions/procedures This assignment sheet provides some descriptive data obtained from the academic misconduct study (N = 469). First, each person in the group should pick one table, and convert the information in the tables to a form of diagram/visual representation (i.e., bar group, pie charts, histogram, etc.). Then, describe the data in ONE paragraph, using percentages. The description should follow common format for describing statistical data. Each description should be accompanied by the percentage value, in brackets. Each description is worth 5/6 points each depending on numbers of group members, e.g., if you have six members you only need to complete SIX descriptions, and if you have five members just complete FIVE descriptions. If there only four people in the group, the group should complete at least FIVE descriptions. Take note that for some descriptive analysis, information in the table, e.g., percentages can be used to create diagrams, while other information, e.g., mean, mode, median, range or standard deviation, should be used to describe data in your paragraphs of description. You will be assessed on suitability of the visuals/diagrams to the data presented, how well you use descriptor @ key words to describe your data and the accuracy of the description based on the data. Usage of Google Classroom during the ERTL/RTL semesters Statistics Google Classroom Google Classroom N Valid 469 Cumulative Percent Missing 0 Frequency Percent Valid Percent Mean 4.3390 Valid Never 6 1.3 1.3 1.3 Median 5.0000 Rarely 14 3.0 3.0 4.3 Mode 5.00 Sometimes 55 11.7 11.7 16.0 Std. Deviation .89047 Often 134 28.6 28.6 44.6 Minimum 1.00 Always 260 55.4 55.4 100.0 Maximum 5.00 Total 469 100.0 100.0Step by Step Solution
There are 3 Steps involved in it
Step: 1

Get Instant Access to Expert-Tailored Solutions
See step-by-step solutions with expert insights and AI powered tools for academic success
Step: 2

Step: 3

Ace Your Homework with AI
Get the answers you need in no time with our AI-driven, step-by-step assistance
Get Started


