

Answered step by step
Verified Expert Solution
Question
1 Approved Answer
Please I'm only in need of answers to question number 3 from this Lake City's park gazebo is available for residents to rent for picnics
Please I'm only in need of answers to question number 3 from this
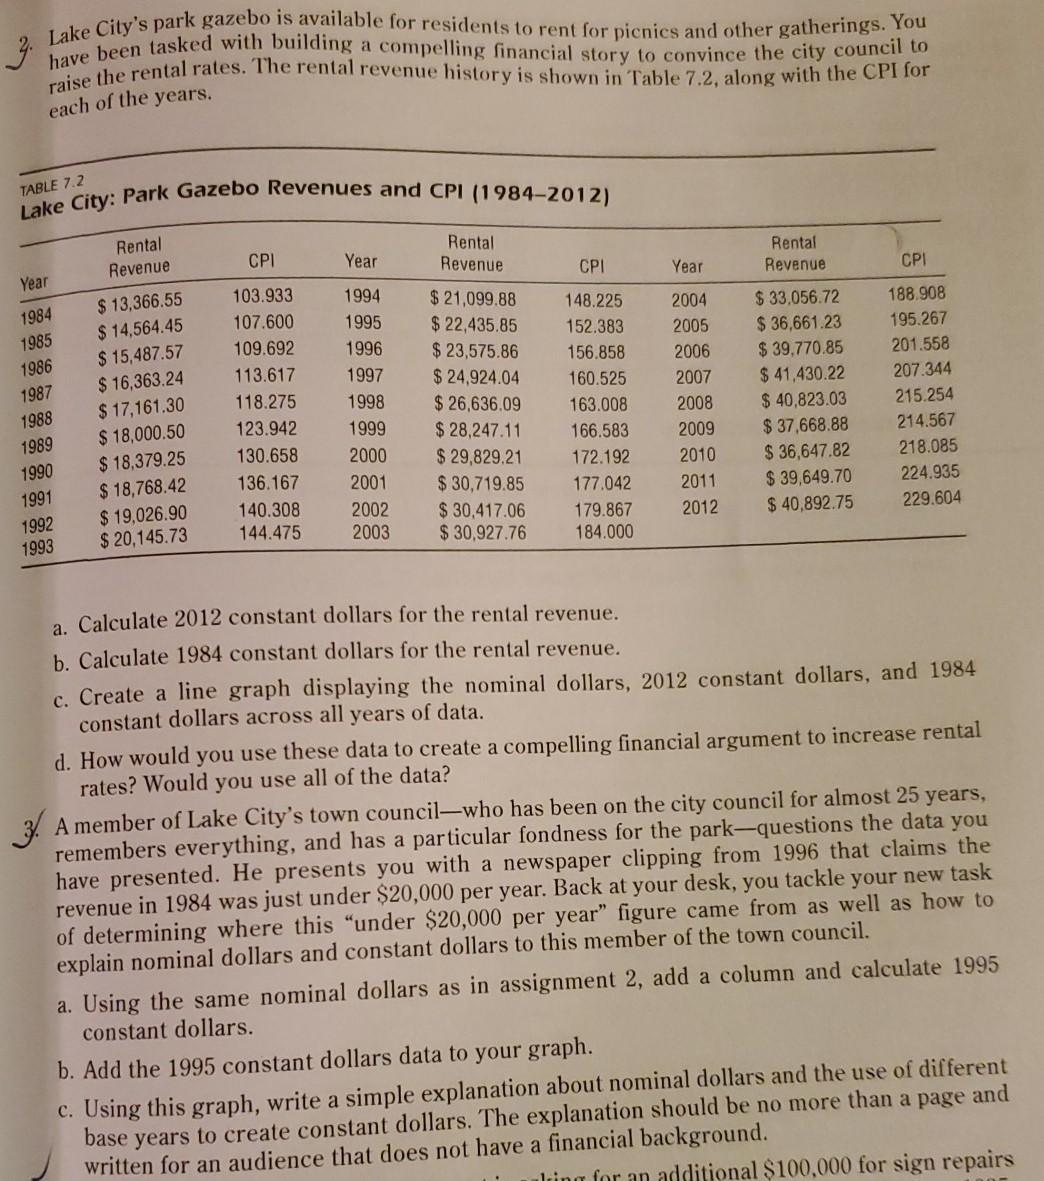
Lake City's park gazebo is available for residents to rent for picnics and other gatherings. You have been tasked with building a compelling financial story to convince the city council to raise the rental rates. The rental revenue history is shown in Table 7.2, along with the CPI for Lake City: Park Gazebo Revenues and CPI (1984-2012) 2. each of the years. TABLE 7.2 CPI Year Rental Revenue CPI Year CPI Year 1994 1984 1985 1986 1987 1988 1989 1990 1991 1992 1993 Rental Revenue $ 13,366.55 $ 14,564.45 $ 15,487.57 $ 16,363.24 $ 17,161.30 $ 18,000.50 $ 18,379.25 $ 18,768.42 $ 19.026.90 $ 20,145.73 103.933 107.600 109.692 113.617 118.275 123.942 130.658 136.167 140.308 144.475 1995 1996 1997 1998 1999 2000 2001 2002 2003 $ 21,099.88 $ 22,435.85 $ 23,575.86 $ 24,924.04 $ 26,636.09 $ 28,247.11 $ 29,829.21 $ 30,719.85 $ 30,417.06 $30.927.76 148.225 152.383 156.858 160.525 163.008 166.583 172.192 177.042 179.867 184.000 2004 2005 2006 2007 2008 2009 2010 2011 2012 Rental Revenue $ 33,056.72 $36.661.23 $ 39,770.85 $ 41,430.22 $ 40,823.03 $ 37,668.88 $ 36,647.82 $ 39,649.70 $ 40,892.75 188.908 195.267 201.558 207.344 215.254 214.567 218.085 224.935 229.604 a. Calculate 2012 constant dollars for the rental revenue. b. Calculate 1984 constant dollars for the rental revenue. c. Create a line graph displaying the nominal dollars, 2012 constant dollars, and 1984 constant dollars across all years of data. d. How would you use these data to create a compelling financial argument to increase rental rates? Would you use all of the data? 3. A member of Lake City's town council-who has been on the city council for almost 25 years, remembers everything, and has a particular fondness for the park-questions the data you have presented. He presents you with a newspaper clipping from 1996 that claims the revenue in 1984 was just under $20,000 per year. Back at your desk, you tackle your new task of determining where this under $20,000 per year figure came from as well as how to explain nominal dollars and constant dollars to this member of the town council. a. Using the same nominal dollars as in assignment 2, add a column and calculate 1995 constant dollars. b. Add the 1995 constant dollars data to your graph. c. Using this graph, write a simple explanation about nominal dollars and the use of different base years to create constant dollars. The explanation should be no more than a page and written for an audience that does not have a financial background. ulring for an additional $100,000 for sign repairs Lake City's park gazebo is available for residents to rent for picnics and other gatherings. You have been tasked with building a compelling financial story to convince the city council to raise the rental rates. The rental revenue history is shown in Table 7.2, along with the CPI for Lake City: Park Gazebo Revenues and CPI (1984-2012) 2. each of the years. TABLE 7.2 CPI Year Rental Revenue CPI Year CPI Year 1994 1984 1985 1986 1987 1988 1989 1990 1991 1992 1993 Rental Revenue $ 13,366.55 $ 14,564.45 $ 15,487.57 $ 16,363.24 $ 17,161.30 $ 18,000.50 $ 18,379.25 $ 18,768.42 $ 19.026.90 $ 20,145.73 103.933 107.600 109.692 113.617 118.275 123.942 130.658 136.167 140.308 144.475 1995 1996 1997 1998 1999 2000 2001 2002 2003 $ 21,099.88 $ 22,435.85 $ 23,575.86 $ 24,924.04 $ 26,636.09 $ 28,247.11 $ 29,829.21 $ 30,719.85 $ 30,417.06 $30.927.76 148.225 152.383 156.858 160.525 163.008 166.583 172.192 177.042 179.867 184.000 2004 2005 2006 2007 2008 2009 2010 2011 2012 Rental Revenue $ 33,056.72 $36.661.23 $ 39,770.85 $ 41,430.22 $ 40,823.03 $ 37,668.88 $ 36,647.82 $ 39,649.70 $ 40,892.75 188.908 195.267 201.558 207.344 215.254 214.567 218.085 224.935 229.604 a. Calculate 2012 constant dollars for the rental revenue. b. Calculate 1984 constant dollars for the rental revenue. c. Create a line graph displaying the nominal dollars, 2012 constant dollars, and 1984 constant dollars across all years of data. d. How would you use these data to create a compelling financial argument to increase rental rates? Would you use all of the data? 3. A member of Lake City's town council-who has been on the city council for almost 25 years, remembers everything, and has a particular fondness for the park-questions the data you have presented. He presents you with a newspaper clipping from 1996 that claims the revenue in 1984 was just under $20,000 per year. Back at your desk, you tackle your new task of determining where this under $20,000 per year figure came from as well as how to explain nominal dollars and constant dollars to this member of the town council. a. Using the same nominal dollars as in assignment 2, add a column and calculate 1995 constant dollars. b. Add the 1995 constant dollars data to your graph. c. Using this graph, write a simple explanation about nominal dollars and the use of different base years to create constant dollars. The explanation should be no more than a page and written for an audience that does not have a financial background. ulring for an additional $100,000 for sign repairs
Step by Step Solution
There are 3 Steps involved in it
Step: 1

Get Instant Access to Expert-Tailored Solutions
See step-by-step solutions with expert insights and AI powered tools for academic success
Step: 2

Step: 3
Ace Your Homework with AI
Get the answers you need in no time with our AI-driven, step-by-step assistance
Get Started
Re Imagining Offshore Finance
Authors: Christopher M. Bruner
1st Edition
0190466871, 978-0190466879