Answered step by step
Verified Expert Solution
Question
1 Approved Answer
Please implement the code in matlab and add photos you're right it has to be 1 (K / x0 -1) exp (-rt) you can use


Please implement the code in matlab and add photos
you're right it has to be 1 (K / x0 -1) exp (-rt) you can use that equation
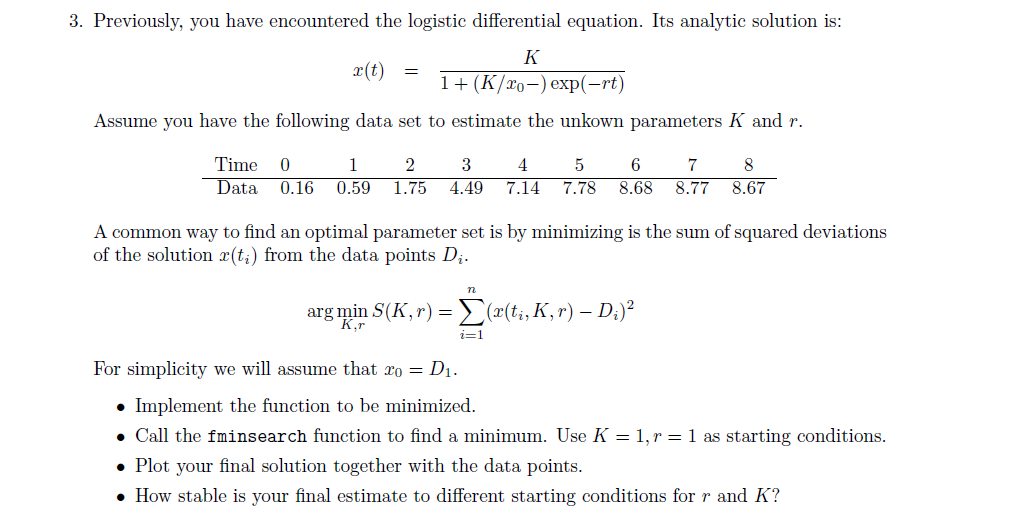
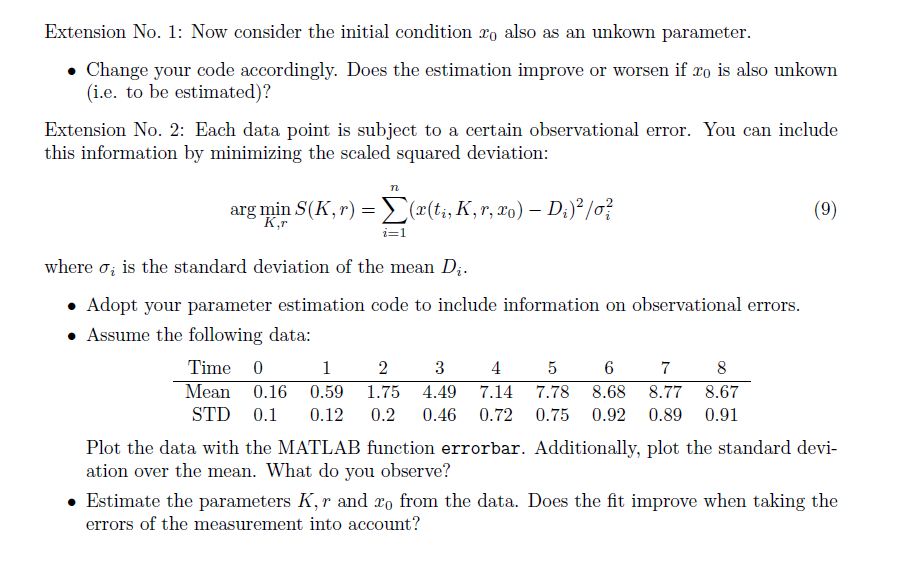
3. Previously, you have encountered the logistic differential equation. Its analytic solution is: = K X(t) 1 + (K/X0-) exp(-rt) Assume you have the following data set to estimate the unkown parameters K and r. Time 0 0.16 1 0.59 2 1.75 3 4.49 4 7.14 5 7.78 6 8.68 7 8.77 8 8.67 Data A common way to find an optimal parameter set is by minimizing is the sum of squared deviations of the solution X(ti) from the data points Di. n arg min S(K,r) = (x(ti,K , r) D;)? i=1 For simplicity we will assume that ro = D1. Implement the function to be minimized. Call the fminsearch function to find a minimum. Use K = 1, r = 1 as starting conditions. Plot your final solution together with the data points. How stable is your final estimate to different starting conditions for r and K? Extension No. 1: Now consider the initial condition to also as an unkown parameter. Change your code accordingly. Does the estimation improve or worsen if xo is also unkown (i.e. to be estimated)? Extension No. 2: Each data point is subject to a certain observational error. You can include this information by minimizing the scaled squared deviation: n arg min S(K,r) = (r(ti,K, r, 10) D;)2/07 (9) i=1 where o; is the standard deviation of the mean Di. Adopt your parameter estimation code to include information on observational errors. Assume the following data: Time 0 1 2 3 4 5 6 7 8 Mean 0.16 0.59 1.75 4.49 7.14 7.78 8.68 8.77 8.67 STD 0.1 0.12 0.2 0.46 0.72 0.75 0.92 0.89 0.91 Plot the data with the MATLAB function errorbar. Additionally, plot the standard devi- ation over the mean. What do you observe? Estimate the parameters K, r and X, from the data. Does the fit improve when taking the errors of the measurement into account? 3. Previously, you have encountered the logistic differential equation. Its analytic solution is: = K X(t) 1 + (K/X0-) exp(-rt) Assume you have the following data set to estimate the unkown parameters K and r. Time 0 0.16 1 0.59 2 1.75 3 4.49 4 7.14 5 7.78 6 8.68 7 8.77 8 8.67 Data A common way to find an optimal parameter set is by minimizing is the sum of squared deviations of the solution X(ti) from the data points Di. n arg min S(K,r) = (x(ti,K , r) D;)? i=1 For simplicity we will assume that ro = D1. Implement the function to be minimized. Call the fminsearch function to find a minimum. Use K = 1, r = 1 as starting conditions. Plot your final solution together with the data points. How stable is your final estimate to different starting conditions for r and K? Extension No. 1: Now consider the initial condition to also as an unkown parameter. Change your code accordingly. Does the estimation improve or worsen if xo is also unkown (i.e. to be estimated)? Extension No. 2: Each data point is subject to a certain observational error. You can include this information by minimizing the scaled squared deviation: n arg min S(K,r) = (r(ti,K, r, 10) D;)2/07 (9) i=1 where o; is the standard deviation of the mean Di. Adopt your parameter estimation code to include information on observational errors. Assume the following data: Time 0 1 2 3 4 5 6 7 8 Mean 0.16 0.59 1.75 4.49 7.14 7.78 8.68 8.77 8.67 STD 0.1 0.12 0.2 0.46 0.72 0.75 0.92 0.89 0.91 Plot the data with the MATLAB function errorbar. Additionally, plot the standard devi- ation over the mean. What do you observe? Estimate the parameters K, r and X, from the data. Does the fit improve when taking the errors of the measurement into accountStep by Step Solution
There are 3 Steps involved in it
Step: 1

Get Instant Access to Expert-Tailored Solutions
See step-by-step solutions with expert insights and AI powered tools for academic success
Step: 2

Step: 3

Ace Your Homework with AI
Get the answers you need in no time with our AI-driven, step-by-step assistance
Get Started


