

Answered step by step
Verified Expert Solution
Question
1 Approved Answer
please include chart for the density of water vs temperature along with the spreadsheet. please circle final answer for both parts. A student wanted to
please include chart for the density of water vs temperature along with the spreadsheet. please circle final answer for both parts.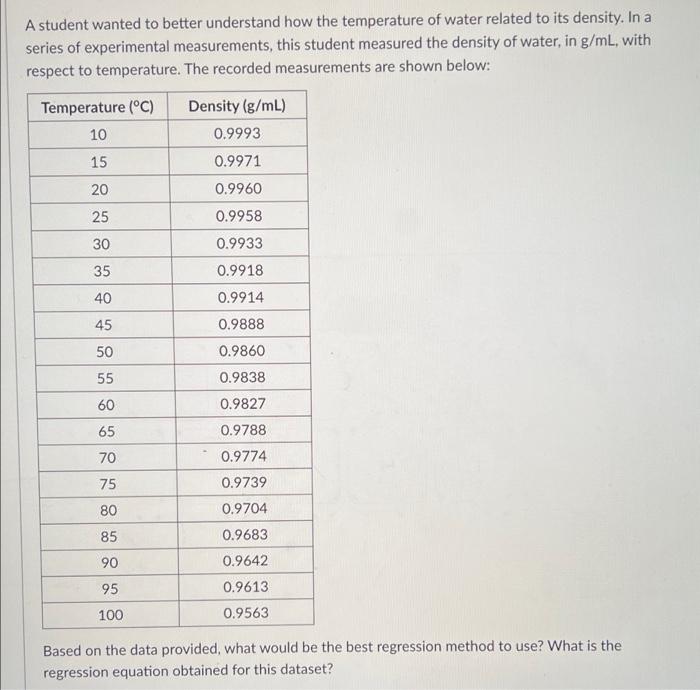
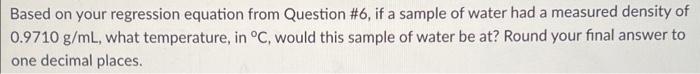
A student wanted to better understand how the temperature of water related to its density. In a series of experimental measurements, this student measured the density of water, in g/mL, with respect to temperature. The recorded measurements are shown below: Temperature (C) 10 Density (g/mL) 0.9993 0.9971 15 20 0.9960 0.9958 25 30 0.9933 35 0.9918 40 0.9914 45 0.9888 50 0.9860 55 0.9838 60 0.9827 0.9788 65 70 75 0.9774 0.9739 0.9704 80 85 0.9683 90 0.9642 0.9613 95 100 0.9563 Based on the data provided, what would be the best regression method to use? What is the regression equation obtained for this dataset? Based on your regression equation from Question #6, if a sample of water had a measured density of 0.9710 g/mL, what temperature, in C, would this sample of water be at? Round your final answer to one decimal places Step by Step Solution
There are 3 Steps involved in it
Step: 1

Get Instant Access to Expert-Tailored Solutions
See step-by-step solutions with expert insights and AI powered tools for academic success
Step: 2

Step: 3
Ace Your Homework with AI
Get the answers you need in no time with our AI-driven, step-by-step assistance
Get Started
Quantitative Chemical Analysis
Authors: Daniel C. Harris
8th edition
1429218150, 978-1429218153