Please include separate screenshot/answer with cell references. :) Thank you
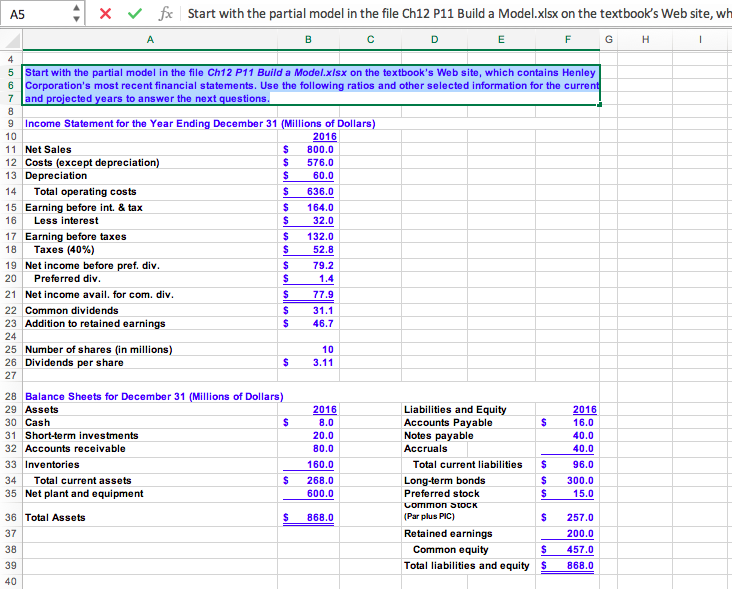
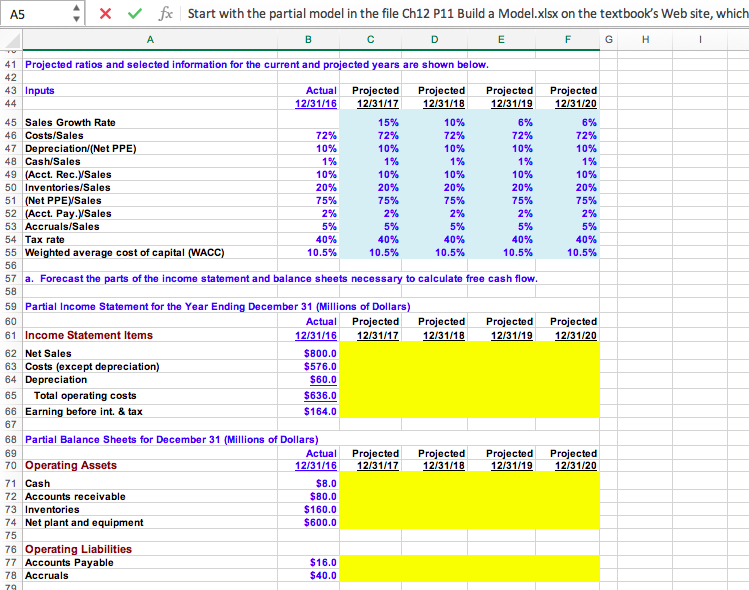
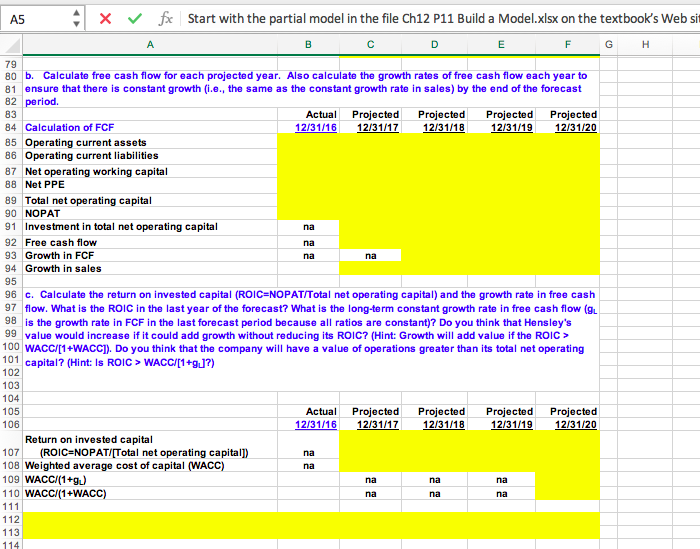
A5 4 x fx Start with the partial model in the file Ch12 P11 Build a Model.xlsx on the textbook's Web site, wh D F G H A B E 1 4 20 1.4 5 Start with the partial model in the file Ch12 P11 Build a Model.xlsx on the textbook's Web site, which contains Henley 6 Corporation's most recent financial statements. Use the following ratios and other selected information for the current 7 and projected years to answer the next questions. 8 9 Income Statement for the Year Ending December 31 (Millions of Dollars) 10 2016 11 Net Sales $ 800.0 12 Costs (except depreciation) $ 576.0 13 Depreciation $ 60.0 14 Total operating costs $ 636.0 15 Earning before int. & tax $ 164.0 16 Less interest $ 32.0 17 Earning before taxes $ 132.0 18 Taxes (40%) $ 52.8 19 Net income before pref. div. $ 79.2 Preferred div. $ 21 Net income avail. for com. div. $ 77.9 22 Common dividends $ 31.1 23 Addition to retained earnings $ 46.7 24 25 Number of shares (in millions) 10 26 Dividends per share $ 3.11 27 28 Balance Sheets for December 31 (Millions of Dollars) 29 Assets Liabilities and Equity 2016 30 Cash $ 8.0 Accounts Payable $ 16.0 31 Short-term investments 20.0 Notes payable 40.0 32 Accounts receivable 80.0 Accruals 40.0 33 Inventories 160.0 Total current liabilities $ 96.0 34 Total current assets $ 268.0 Long-term bonds $ 300.0 35 Net plant and equipment 600.0 Preferred stock $ 15.0 Common STOCK 36 Total Assets $ 868.0 (Par plus PIC) $ 257.0 37 Retained earnings 200.0 38 Common equity $ 457.0 39 Total liabilities and equity S 868.0 40 2016 A5 4 x for Start with the partial model in the file Ch12 P11 Build a Model.xlsx on the textbook's Web site, which A B D E F G H 1 41 Projected ratios and selected information for the current and projected years are shown below. 42 43 Inputs Actual Projected Projected Projected Projected 44 12/31/16 12/31/17 12/31/18 12/31/19 12/31/20 45 Sales Growth Rate 15% 10% 6% 6% 46 Costs/Sales 72% 72% 72% 72% 72% 47 Depreciation/(Net PPE) 10% 10% 10% 10% 10% 48 Cash/Sales 1% 1% 1% 1% 1% 49 (Acct. Rec.Sales 10% 10% 10% 10% 10% 50 Inventories/Sales 20% 20% 20% 20% 20% 51 (Net PPEVSales 75% 75% 75% 75% 75% 52 (Acct. Pay. Sales 2% 2% 2% 2% 2% 53 Accruals/Sales 5% 5% 5% 5% 5% 54 Tax rate 40% 40% 40% 40% 40% 55 Weighted average cost of capital (WACC) 10.5% 10.5% 10.5% 10.5% 10.5% 56 57 a. Forecast the parts of the income statement and balance sheets necessary to calculate free cash flow. 58 59 Partial Income Statement for the Year Ending December 31 (Millions of dollars) 60 Actual Projected Projected Projected Projected 61 Income Statement Items 12/31/16 12/31/17 12/31/18 12/31/19 12/31/20 62 Net Sales $800.0 63 Costs (except depreciation) $576.0 64 Depreciation $60.0 65 Total operating costs $636.0 66 Earning before int. & tax $164.0 67 68 Partial Balance Sheets for December 31 (Millions of Dollars) 69 Actual Projected Projected Projected Projected 70 Operating Assets 12/31/16 12/31/17 12/31/18 12/31/19 12/31/20 71 Cash $8.0 72 Accounts receivable $80.0 73 Inventories $160.0 74 Net plant and equipment $600.0 75 76 Operating Liabilities 77 Accounts Payable $16.0 78 Accruals $40.0 79 A5 A x fae Start with the partial model in the file Ch12 P11 Build a Model.xlsx on the textbook's Web si B D E F G A H 79 na na na na 80 b. Calculate free cash flow for each projected year. Also calculate the growth rates of free cash flow each year to 81 ensure that there is constant growth (i.e., the same as the constant growth rate in sales) by the end of the forecast 82 period. 83 Actual Projected Projected Projected Projected 84 Calculation of FCF 12/31/16 12/31/17 12/31/18 12/31/19 12/31/20 85 Operating current assets 86 Operating current liabilities 87 Net operating working capital 88 Net PPE 89 Total net operating capital 90 NOPAT 91 Investment in total net operating capital 92 Free cash flow 93 Growth in FCF 94 Growth in sales 95 96 c. Calculate the return on invested capital (ROIC=NOPAT/Total net operating capital) and the growth rate in free cash 97 flow. What is the ROIC in the last year of the forecast? What is the long-term constant growth rate in free cash flow (gl 98 is the growth rate in FCF in the last forecast period because all ratios are constant)? Do you think that Hensley's 99 value would increase if it could add growth without reducing its ROIC? (Hint: Growth will add value if the ROIC > 100 WACC/[1+WACCI). Do you think that the company will have a value of operations greater than its total net operating 101 capital? (Hint: Is ROIC > WACC/[1+gu?) 102 103 104 105 Actual Projected Projected Projected Projected 106 12/31/16 12/31/17 12/31/18 12/31/19 12/31/20 Return on invested capital 107 (ROICENOPAT/[Total net operating capital]) 108 Weighted average cost of capital (WACC) 109 WACC/(1+92) 110 WACC/(1+WACC) 111 112 113 114 na na na na na na na na A B A5 fic Start with the partial model in the file Ch12 P11 Build a Model.xlsx on the textbook's W D E F G H 113 114 115 d. Calculate the current value of operations. (Hint: First calculate the horizon value at the end of the forecast period, 116 which is equal to the value of operations at the end of the forecast period. Assume that the annual growth rate 117 beyond the horizon is equal to the growth rate at the horizon.) How does the current value of operations compare with 118 the current amount of total net operating capital? 119 120 Weighted average cost of capital (WACC) 10.5% 121 122 Actual Projected Projected Projected Projected 123 12/31/16 12/31/17 12/31/18 12/31/19 12/31/20 124 Free cash flow 125 Long-term constant growth in FCF 126 Horizon value 127 128 Present value of horizon value 129 Present value of forecasted FCF 130 Value of operations (PV of HV] + [PV of FCF]) 131 132 Total net operating capital 133 134 135 136 137 6. Calculate the price per share of common equity as of 12/31/2016 138 139 Millions except price per share Actual 140 12/31/16 141 Value of operations 142 + Value of short-term investments 143 Total value of company 144 - Total value of all debt 145 Value of preferred stock 146 Value of common equity 147 Divided by number of shares 148 Price per share 149 150 A5 4 x fx Start with the partial model in the file Ch12 P11 Build a Model.xlsx on the textbook's Web site, wh D F G H A B E 1 4 20 1.4 5 Start with the partial model in the file Ch12 P11 Build a Model.xlsx on the textbook's Web site, which contains Henley 6 Corporation's most recent financial statements. Use the following ratios and other selected information for the current 7 and projected years to answer the next questions. 8 9 Income Statement for the Year Ending December 31 (Millions of Dollars) 10 2016 11 Net Sales $ 800.0 12 Costs (except depreciation) $ 576.0 13 Depreciation $ 60.0 14 Total operating costs $ 636.0 15 Earning before int. & tax $ 164.0 16 Less interest $ 32.0 17 Earning before taxes $ 132.0 18 Taxes (40%) $ 52.8 19 Net income before pref. div. $ 79.2 Preferred div. $ 21 Net income avail. for com. div. $ 77.9 22 Common dividends $ 31.1 23 Addition to retained earnings $ 46.7 24 25 Number of shares (in millions) 10 26 Dividends per share $ 3.11 27 28 Balance Sheets for December 31 (Millions of Dollars) 29 Assets Liabilities and Equity 2016 30 Cash $ 8.0 Accounts Payable $ 16.0 31 Short-term investments 20.0 Notes payable 40.0 32 Accounts receivable 80.0 Accruals 40.0 33 Inventories 160.0 Total current liabilities $ 96.0 34 Total current assets $ 268.0 Long-term bonds $ 300.0 35 Net plant and equipment 600.0 Preferred stock $ 15.0 Common STOCK 36 Total Assets $ 868.0 (Par plus PIC) $ 257.0 37 Retained earnings 200.0 38 Common equity $ 457.0 39 Total liabilities and equity S 868.0 40 2016 A5 4 x for Start with the partial model in the file Ch12 P11 Build a Model.xlsx on the textbook's Web site, which A B D E F G H 1 41 Projected ratios and selected information for the current and projected years are shown below. 42 43 Inputs Actual Projected Projected Projected Projected 44 12/31/16 12/31/17 12/31/18 12/31/19 12/31/20 45 Sales Growth Rate 15% 10% 6% 6% 46 Costs/Sales 72% 72% 72% 72% 72% 47 Depreciation/(Net PPE) 10% 10% 10% 10% 10% 48 Cash/Sales 1% 1% 1% 1% 1% 49 (Acct. Rec.Sales 10% 10% 10% 10% 10% 50 Inventories/Sales 20% 20% 20% 20% 20% 51 (Net PPEVSales 75% 75% 75% 75% 75% 52 (Acct. Pay. Sales 2% 2% 2% 2% 2% 53 Accruals/Sales 5% 5% 5% 5% 5% 54 Tax rate 40% 40% 40% 40% 40% 55 Weighted average cost of capital (WACC) 10.5% 10.5% 10.5% 10.5% 10.5% 56 57 a. Forecast the parts of the income statement and balance sheets necessary to calculate free cash flow. 58 59 Partial Income Statement for the Year Ending December 31 (Millions of dollars) 60 Actual Projected Projected Projected Projected 61 Income Statement Items 12/31/16 12/31/17 12/31/18 12/31/19 12/31/20 62 Net Sales $800.0 63 Costs (except depreciation) $576.0 64 Depreciation $60.0 65 Total operating costs $636.0 66 Earning before int. & tax $164.0 67 68 Partial Balance Sheets for December 31 (Millions of Dollars) 69 Actual Projected Projected Projected Projected 70 Operating Assets 12/31/16 12/31/17 12/31/18 12/31/19 12/31/20 71 Cash $8.0 72 Accounts receivable $80.0 73 Inventories $160.0 74 Net plant and equipment $600.0 75 76 Operating Liabilities 77 Accounts Payable $16.0 78 Accruals $40.0 79 A5 A x fae Start with the partial model in the file Ch12 P11 Build a Model.xlsx on the textbook's Web si B D E F G A H 79 na na na na 80 b. Calculate free cash flow for each projected year. Also calculate the growth rates of free cash flow each year to 81 ensure that there is constant growth (i.e., the same as the constant growth rate in sales) by the end of the forecast 82 period. 83 Actual Projected Projected Projected Projected 84 Calculation of FCF 12/31/16 12/31/17 12/31/18 12/31/19 12/31/20 85 Operating current assets 86 Operating current liabilities 87 Net operating working capital 88 Net PPE 89 Total net operating capital 90 NOPAT 91 Investment in total net operating capital 92 Free cash flow 93 Growth in FCF 94 Growth in sales 95 96 c. Calculate the return on invested capital (ROIC=NOPAT/Total net operating capital) and the growth rate in free cash 97 flow. What is the ROIC in the last year of the forecast? What is the long-term constant growth rate in free cash flow (gl 98 is the growth rate in FCF in the last forecast period because all ratios are constant)? Do you think that Hensley's 99 value would increase if it could add growth without reducing its ROIC? (Hint: Growth will add value if the ROIC > 100 WACC/[1+WACCI). Do you think that the company will have a value of operations greater than its total net operating 101 capital? (Hint: Is ROIC > WACC/[1+gu?) 102 103 104 105 Actual Projected Projected Projected Projected 106 12/31/16 12/31/17 12/31/18 12/31/19 12/31/20 Return on invested capital 107 (ROICENOPAT/[Total net operating capital]) 108 Weighted average cost of capital (WACC) 109 WACC/(1+92) 110 WACC/(1+WACC) 111 112 113 114 na na na na na na na na A B A5 fic Start with the partial model in the file Ch12 P11 Build a Model.xlsx on the textbook's W D E F G H 113 114 115 d. Calculate the current value of operations. (Hint: First calculate the horizon value at the end of the forecast period, 116 which is equal to the value of operations at the end of the forecast period. Assume that the annual growth rate 117 beyond the horizon is equal to the growth rate at the horizon.) How does the current value of operations compare with 118 the current amount of total net operating capital? 119 120 Weighted average cost of capital (WACC) 10.5% 121 122 Actual Projected Projected Projected Projected 123 12/31/16 12/31/17 12/31/18 12/31/19 12/31/20 124 Free cash flow 125 Long-term constant growth in FCF 126 Horizon value 127 128 Present value of horizon value 129 Present value of forecasted FCF 130 Value of operations (PV of HV] + [PV of FCF]) 131 132 Total net operating capital 133 134 135 136 137 6. Calculate the price per share of common equity as of 12/31/2016 138 139 Millions except price per share Actual 140 12/31/16 141 Value of operations 142 + Value of short-term investments 143 Total value of company 144 - Total value of all debt 145 Value of preferred stock 146 Value of common equity 147 Divided by number of shares 148 Price per share 149 150